Whenever researchers are conducting studies using state- or county-level data, we usually want some standard demographic variables to serve as controls; things like the total population, average age, and gender and race breakdowns. If the dataset for our main variables of interest doesn’t already have this, we go looking for a new dataset of demographic controls to merge in; but it has always been surprisingly hard to find a clean, easy-to-use dataset for this. For states, I’ve found the University of Kentucky’s National Welfare Database to be the best bet. But what about counties?
I had no good answer, and the best suggestion I got from others was the CDC SEER data. As so often, the government collected this impressively comprehensive dataset, but only releases it in an unusable format- in this case only as txt files that look like this:
I cleaned and reformatted the CDC SEER data into a neat panel of county demographics that look like this:
I posted my code and data files (CSV, XLSX, and DTA) on OSF and my data page as usual. I also posted the data files on Kaggle, which seems to be more user-friendly and turns up better on searches; I welcome suggestions for any other data repositories or file formats you would like to see me post.
This article was updated on March 1 with additional information on kava side effects.
This is a follow-up to my post last week, describing my visit to a shop purveying beverages laced with kava and with kratom, two substances I had not heard of previously. As a service to readers who may deal with someone who is using these materials, here is what I have found out about what they do to people.
Upfront disclaimer: I have no expertise in this area, these are just the observations of an amateur who has read a few articles. Do not make any decisions based on this article.
Primary Effects of Kava
Kava is made from the roots of a plant in the pepper family, which is native to the Pacific Islands. There are two main classes of kava plants. The “noble” cultivars are what has traditionally been used for human consumption, via water extraction of the roots to make a beverage. The non-noble (two-day or “tudei”) cultivars grow faster (so they are cheaper for production), but are more likely to have adverse side effects. Also, the above-ground parts of the plants are known to contain toxic alkaloids.
The Wikipedia summary of effects is, “Systematic reviews and meta-analyses conducted in the last decade have typically indicated a modest positive effect of kava on anxiety and generalized anxiety disorder, though the evidence is mixed and further research is frequently recommended.”
I found a 2020 memo by a FDA toxicologist, titled “Review of the published literature pertaining to the safety of Kava for use in conventional foods”, which covers both the positive effects and the extensive side-effects. The memo notes: “The major physiological action in humans is consistently reported as a pleasant, mild, centrally acting relaxant property which induces a generalized muscle relaxation and, ultimately, a deep natural sleep. A minor property of kava is its local anesthetic properties which are experienced as numbing of the mucous membranes of the mouth and tongue when the beverage is consumed.” That all sounds pretty nice.
The main active compounds in cava are called kavalactones. Known effects of the six major kavalactones are:
For the biochemists among us: “The psychotropic effects of kava are achieved by the modulation of gamma‐amino‐butyric acid (GABA) receptors. Although the exact mechanisms are not known, studies suggest that the effects are mediated via different mechanisms such as upregulation of GABA‐A receptor function, blockade of voltage‐gated sodium ion channels, enhanced ligand binding across GABA‐A receptor subtypes, and reduced excitatory neurotransmitter release.” GABA is the primary inhibitory neurotransmitter in the central nervous system, so it is commonly targeted by tranquilizers such as benzodiazepines (e.g. Valium). Hence, the calming effect. Research suggests that kava components also inhibit the re-uptake of norepinephrine (a chemical that makes you feel alert) and of dopamine (a feel-good hormone).
Side Effects of Kava
The most controversial issue is liver damage. There were a number of very severe cases (complete liver failure) in the late 1990s/early 2000s in Europe, which led to a ban of kava in a number of countries there starting around 2002. It was not banned in the U.S., but the FDA issued an advisory letter expressing concern about liver damage.
Kava advocates were unconvinced, and further research seems to indicate that nearly all of those liver damage cases were due to use of the non-noble cultivars and/or the use of stems instead of just the roots and/or the extraction being done with some alcoholic solvent rather than water (probably due to greedy/ignorant kava suppliers). Most European countries have relaxed their outright bans, although in many cases kava sales are still restricted or regulated. Because their main market got shut off due to the liver problems, Pacific island nations scrambled to rebuild kava credibility. They now try to ensure that only proper kava is exported to the West.
Kava advocates claim that if kava is extracted the traditional way from traditional cultivars, there are no appreciable severe bad side-effects. On the other hand, the 2020 FDA memo document claimed there was a wide range of serious adverse effects of kava use among traditional kava users in the eastern Pacific, especially liver damage, among heavy kava drinkers: “Several studies show a clear association of increased level of liver enzymes GGT, ALP, and moderate to heavy kava beverage consumption as shown in Table 2…..Hepatic injury due to traditional aqueous extracts of kava root was reported in a study of 27 heavy kava drinkers in New Caledonia (Russmann et al. 2003).”
On closer examination, however, it seems that the FDA document gave an overly negative view of kava liver effects. The Russman 2003 study did not actually show “heptatic injury” among the 27 heavy kava drinkers. All it showed was elevated levels of the liver-related enzymes. It is true that there were pretty consistent observations of elevated levels of enzymes such as GGT (gamma-glutamyl transpeptidase) and ALP (alanine aminotransferase) in blood samples. Most of the studies of Polynesian subjects cited in the FDA memo lacked controls, but Brown (2007) included kava users and nonusers in its survey of Tongans living in Hawaii. This study showed high levels of GGT and ALP among the kava users, yet without any clinical indications of liver malfunction. Also, other liver-related markers in the blood such as AST, ALT, bilirubin, and ferritin were normal in the kava users. The significance of the partial abnormalities in enzymes is not clear. My guess is that the liver is somewhat stressed but not to the point of malfunction.
So it seems true that moderate consumption of kava prepared the traditional way (water extraction from roots of noble cultivars) shows no general tendency for observable liver damage. That said, the elevated liver-related enzymes are grounds for at least a little caution, and there have been a (very) few cases of genuine liver damage from traditionally extracted kava. Russman (2003) reported two women in New Caledonia who developed symptoms of liver distress from kava; these symptoms resolved after cessation of kava use. And Becker (2019) documented the case of an otherwise healthy woman in Brazil who experienced complete liver failure following 52 days of using an approved kava pill at approved dosage; her life was saved by a liver transplant. However, people die every year from eating peanuts, so I don’t know how much to read into these isolated cases of liver damage from kava.
A common effect of kava use is dermatitis, presenting as dry skin, rashes, and eruptions. (This strikes me as an allergic-type reaction). Other common side-effects can be nausea and headaches. These effects typically resolve quickly if kava use is discontinued. In the plus column, there is some sketchy evidence for anti-cancer activity by kava. In general, cognition is not impaired.
I read about sixty reviews on Amazon from purchasers of kava root powders, and more discussions on Reddit. Most were quite happy with the kava products, but emphasized that preparing the drink from the root takes some time and effort to squeeze and then filter; the brew tastes terrible, like dirt (you have to gulp it down, not sip it), and some temporary nausea is common. However, there were a nontrivial minority that reported very ugly experiences, and one man who with his first dose went comatose and nearly died. The general opinion is that kava beverage made fresh (by you or at a kava bar) from the ground root is better than capsules or packaged drinks made from kava extracts.
The exact effects may depend on your genome – some folks may get whacked, while others escape unscathed. And there may be systemic differences between how Caucasians and Polynesians react to kava. Apparently you must chug it down on an empty stomach to get the full effects. It is best to drink it in multiple small increments, rather than one giant glass. Some users chase each “shell” with a swish of some other beverage to clear the taste out, and/or eat a tiny snack like a few chips to calm the queasy stomach.
Side effects seem to be greatly amplified when kava is consumed with other substances, especially alcohol. That makes chemical sense, since kava acts on many of the same metabolic pathways as alcohol and antianxiety meds like benzodiazepines and barbiturates. This is significant, since in the West kava is often consumed in a social context which includes alcohol.
For further reading on kava effects: see an objective 2022 review by Soarez, and many pro-kava articles such as this on the kava promotion site kavacoalition.org. That site includes testimonials of people using kava instead of opioids for coping with chronic pain from injuries. Although its main function is to reduce anxiety, that in turn may mitigate the sensations of pain. A number of participants in a Reddit thread stated that kava has helped them overcome alcoholism.
One source estimated that there are about 200 kava bars in the U.S., with about half of them in Florida. After a court battle with the state, a kava bar opened in Virginia in 2024. The state has so far has not approved serving of kratom.
My takeaway on kava: It seems to me to be somewhat similar to cannabis or alcohol – light, occasional use can give a good feeling, especially pleasant as a shared experience with friends. For some, it might be helpful in coping with pain. Unlike alcohol, there seems to be no obvious tendency towards addiction. However, as with alcohol and cannabis, there is some possibility of serious adverse effects, especially with heavy use and if it is consumed with other substances. Therefore, it would seem wise to start slow with kava and monitor your body’s reactions.
Also, it is essential to make sure you are getting kava made the right way, as discussed above. At a kava bar, you can talk with the server. If you are taking capsules, I’d suggest contacting the manufacturer. Or you can buy plain kava root, and steep your own brew.
Effects of Kratom
I will spend less time on kratom effects, since it acts largely like an opioid. Need we say more.
Kratom is extracted from the leaves of an evergreen plant native to southeast Asia. We discussed some of the varieties of kratom earlier. Quotations here are all from the Wikipedia article; they mesh with what I have read elsewhere.
The active compounds are a mix of dozens of alkaloid compounds. The key ones seem to interact with opioid receptors in the brain. But the interactions are complex and poorly-understood. On the plus side, “These compounds display functional selectivity and do not activate the β-arrestin pathway partly responsible for the respiratory depression, constipation, and sedation associated with traditional opioids.”
For recreational use, “At low doses, kratom produces euphoric effects comparable to those of coca. At higher doses, kratom produces opioid-like effects.” Much of kratom use is for more serious issues, such as managing chronic pain or helping with opioid withdrawal.
There are many documented adverse side effects, resulting in many visits to hospitals:
Common side-effects include appetite loss, erectile dysfunction, nausea and constipation. More severe side-effects may include respiratory depression (decreased breathing), seizure, psychosis, elevated heart rate and blood pressure, trouble sleeping, and, rarely, liver toxicity. Addiction is a possible risk with regular use: when use is stopped, withdrawal symptoms may occur. A number of deaths have been attributed to the use of kratom, both by itself and mixed with other substances.
…Long-term use of high doses of kratom may lead to development of tolerance, dependence, and withdrawal symptoms, including loss of appetite, weight loss, decreased libido, insomnia, muscle spasms, muscle and bone pain, increased yawning and/or sneezing, myoclonus, watery eyes, hot flashes, fever, diarrhea, restlessness, anger, and sadness. This may lead to resumption of use. Frequent use of high doses of kratom may cause tremors, anorexia, weight loss, seizures, psychosis and other mental health conditions.
Perhaps the biggest concern with kratom is the high propensity for addiction and the need to increase dosage to obtain the desired effects:
Kratom is a botanical with a known addiction liability and, in vulnerable individuals, dependence may develop rather quickly with tolerance noted at three months and four- to ten-fold dose escalations required within the first few weeks…Kratom addiction carries a relapse risk as high as 78% to 89% at three months post-cessation.
In 2017 the FDA stated that “There is no reliable evidence to support the use of kratom as a treatment for opioid use disorder; there are currently no FDA-approved therapeutic uses of kratom… and the FDA has evidence to show that there are significant safety issues associated with its use.”
Some advice here on Reddit on how with kratom “less is more” — due to complex biochemical interactions, upping your dose or making it more frequent can actually diminish the desired effects, and start down the road of diminishing returns and then using higher and higher doses. And this Reddit where users describe their problems with kratom addiction:
i suggest you stop while you are still able to walk away relatively unscathed. addiction is a very disgusting thing that can happen to a person. you will absolutely feel worse than you ever thought you could feel, save for losing a child or something insane happening IRL.
some drugs will actually cause a physical addiction, like kratom. this means your body adjusts to it & stops doing its job in order to let the drug do it. now when you stop using, your body & mind are without their own processes & they are also without the drug. this leaves you empty, sick, wide awake but exhausted, sweaty but cold, aching pain. for alcohol, withdrawal can actually lead to seizures, extreme hallucinations & delusions, & even will just straight up kill you bc you need a drink so bad.
My takeaway on kratom: This one seems like playing with fire, due to its addictive properties. Also, street doses of kratom are sometimes spiked with horrible drugs like fentanyl. Thus, I see little case for promoting it for recreational use, given that there are safer alternatives such as weed, booze, and kava. (And in general, there are more fruitful ways to rise above anxiety than drinking or smoking something – – change your thinking patterns, or even use flashing lights to put your brain into alpha waves. )
It is possible that kratom could be useful to someone dealing with chronic pain, as an alternative to opioids with their known addition danger. I have deep sympathy for anyone in that position. I would hope that they would work with a medical professional or at least a trustworthy friend to monitor their usage (keeping it low, no matter what), since in these matters it is easy to deceive oneself as to what is really going on.
ADDENDUM
In case someone is tempted to try kratom out of curiosity, I will share the cautionary observation an acquaintance emailed me after reading the original version of this article:
You know, I met some heroin addicts who said that they always told themselves they wouldn’t do it, they had seen it destroy people. But they ended up one day just caving to curiosity. One day, they just shrugged and said “screw it, I wanna see what this is about.” And their life was ruined by the immediate addiction. It’s a very sad story.
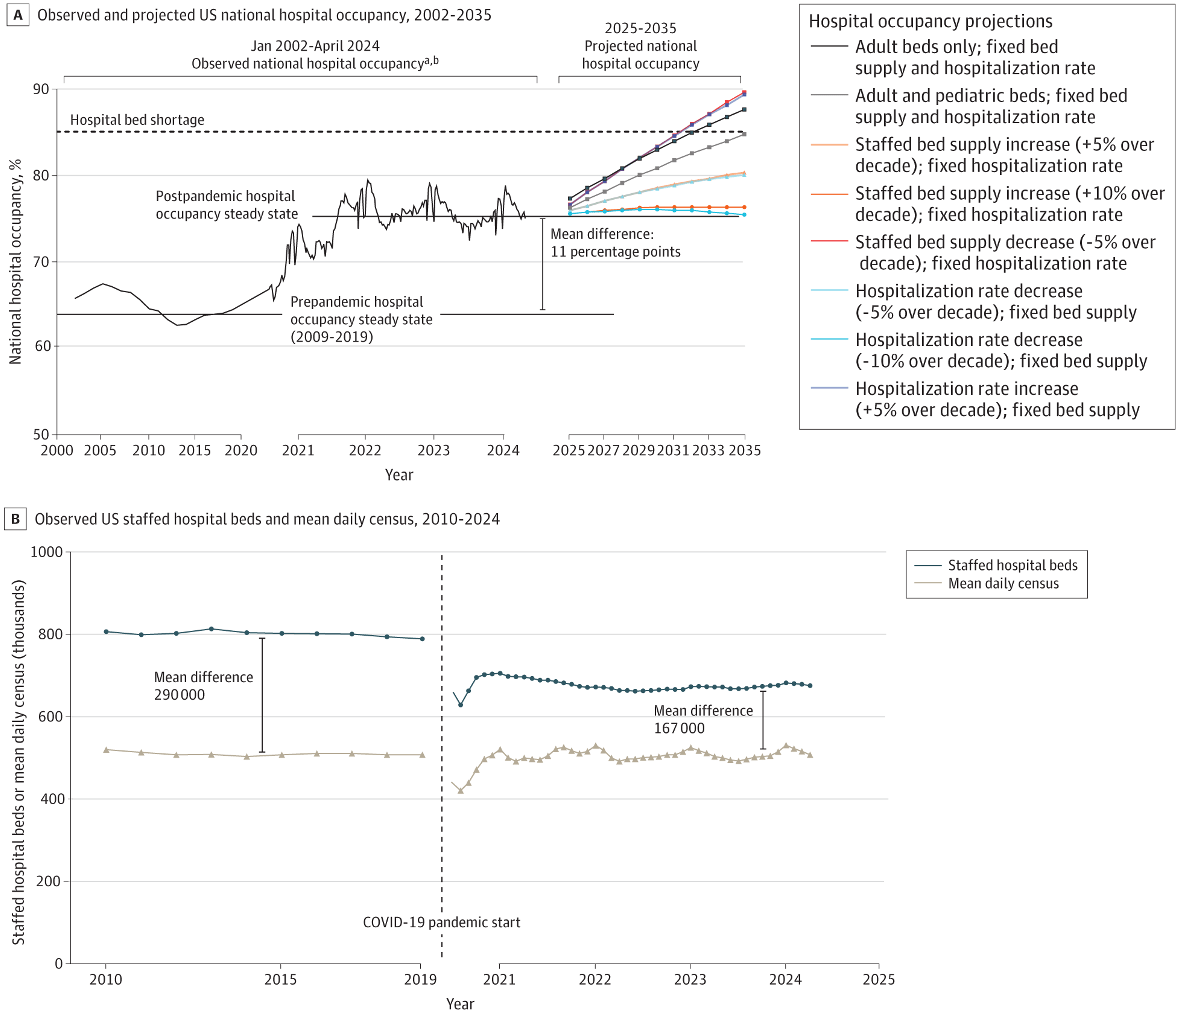
The average hospital is now 3/4 full- more full than during much of the worst of the Covid pandemic, and well above the 2/3 occupancy rate that prevailed during the 2010s. This is according to a study out yesterday in JAMA Open:
This seems to be due to a reduction in bed supply, rather than an increase in demand:
The number of staffed hospital beds declined from a prepandemic steady state of 802 000 (2009-2019 mean) to a post-PHE steady state of 674 000, whereas the mean daily census steady state remained at approximately 510 000
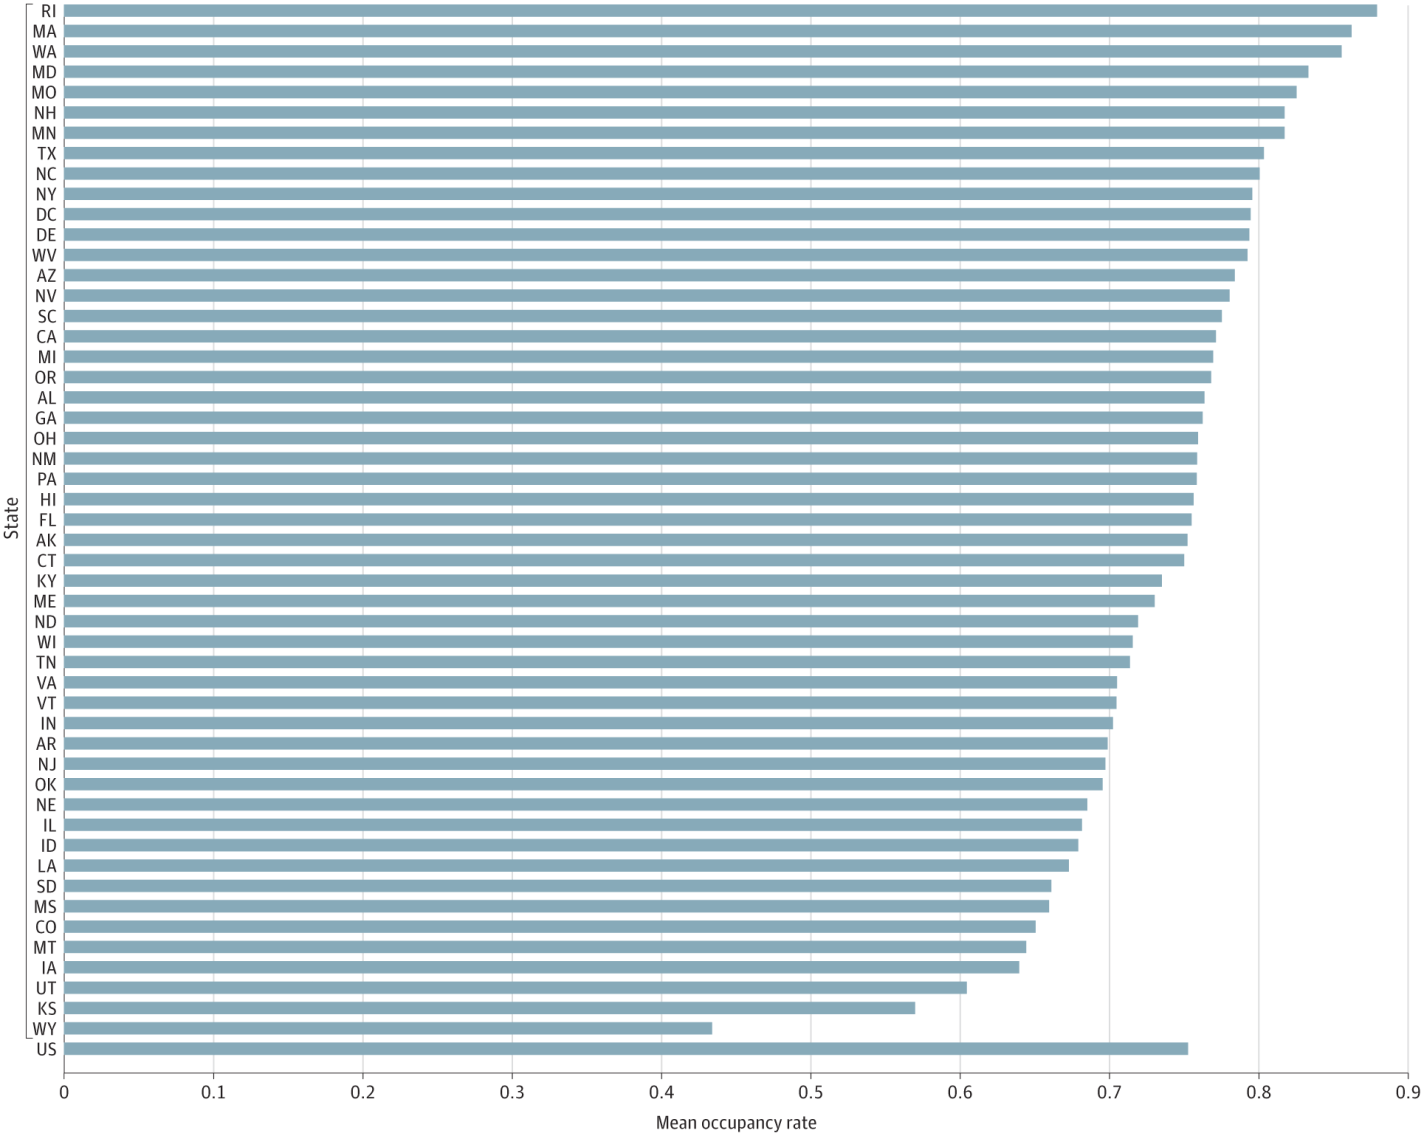
To me this is one more reason to reform Certificate of Need laws that put barriers in the way of hospitals opening or adding beds. Luckily I see a lot of momentum for CON reform this legislative season, including the highest-occupancy state, Rhode Island:
Last week I visited a family member in Saint Petersburg, Florida. We had a very nice time, walking around the pier area of the city and going out on his boat. Every day was the same weather: sunny, and a high of 80° F (in mid-February).
I was out walking in the neighborhood, and I saw signage for a shop that piqued my curiosity. It offered cannabis products, which I knew about, but also “kava” and “kratom”, and apparently “nitro”. When I came back to the house, I asked my host what kava was. He indicated it was some kind of recreational drug, whose use seemed to be expanding, at least in that area. I did a superficial check online, finding that kava is an extract from the roots of a plant native to some South Pacific islands, which is reputed to have anxiety-reducing and other feel-good properties.
A couple of days later I walked into the shop and introduced myself as an out-of-state tourist, who saw the sign out front and was curious. There were no other customers at the time, so the saleswoman patiently graciously answered my questions.
I started off asking about kava. But she indicated there was actually more interest in kratom. That is what she imbibes herself, although not frequently. Kratom is extracted from the leaves of an evergreen, Mitragyna speciosa, which is native to Southeast Asia. It seems to have stronger effects than kava, and a physician I spoke with felt that kratom was more likely to be addictive. (I plan to do a deeper dive into the pharmacology of kava and kratom in later articles on this blog).
I was told that kratom comes in three main types: red, green, and white. These are extracted at different stages of leaf maturity. Red is for pain relief, white is for energy, and green is in between. “Train wreck” has all three colors. The products in the shop with kratom, or kratom plus kava greatly outnumbered those with kava alone.
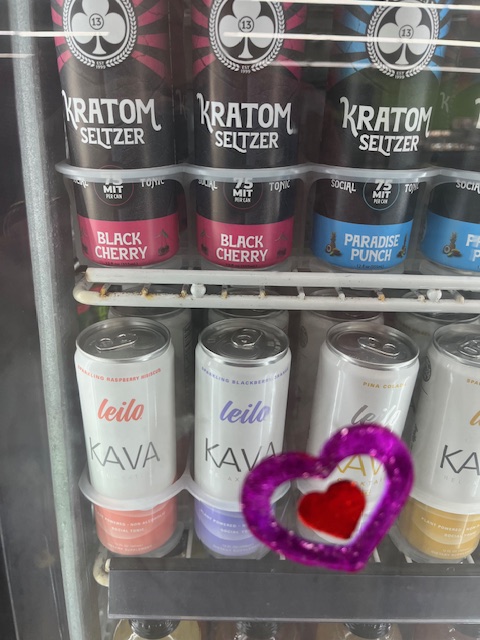
For pure kava, I would have to buy a can of soda (photo below) or buy a prepared drink at the bar.
While we were there, a customer came and ordered two drinks from the bar. He was a middle-aged, upstanding citizen, not some alienated youth covered in tattoos and body-piercings. He told us he has been using kratom for two weeks now, and it has helped him considerably. He said he suffers pain from arthritis and from operations, and that his alcohol use has gone way down since he started kratom. Normally, this man uses white kratom, but since the bar was out of the white extract, he walked out with two large cups of “train wreck”.
The shop also sells various cannabis related products. They mainly contain THCA, which is a legal and less potent version of THC, which is the most active ingredient in marijuana.
The sign out front offered mushrooms as well; I am not sure how “magic” they are. As for “nitro”, it turns out that that is not another psychotropic drug. It is just cold-brewed coffee infused with nitrogen gas, to give a somewhat creamy emulsion. Just another way for Americans to spend $6.00 on a cup of coffee.
I thought about buying and trying some kava or kratom drink, for the sake of science, but at my age I figured I needed to keep all my brain cells. I recalled that decades ago it was emphatically stated that marijuana (unlike alcohol) was not harmful, but now we know better. So, I thanked the clerk and walked out empty-handed.
POST-SCRIPT: See my follow-up article on effects of kava and kratom. Kava seems fairly safe and pleasant, maybe on a par with weed, but kratom functions largely like an opioid and should probably be avoided. Also, based on my additional reading, the kava beverages depicted above are likely to be ineffective; the way to go is to fresh-squeeze ground-up kava root in water. This can be done by you, or for you at a kava bar.
The NSCH is the latest casualty of the new administration taking down major datasets from government websites. Between Archive.org and what I had downloaded for old projects, I was able to get all the 2016-2023 topical NSCH files and post them on an Open Science Foundation page.
I took this as a chance to improve the data- the government previously only made the topical Public Use Files available in SAS and Stata formats one year at a time, so I added a merged version for all available years in both Stata and Excel formats.
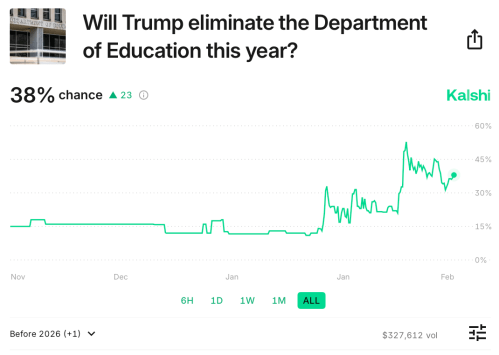
I hope and expect that the National Survey Children’s Health will be back up at official websites soon. But I expect that other datasets will be taken down permanently, so now is the time to download what you think you might need and add it to your data hoard– especially if you want anything from the Department of Education.
Several major datasets produced by the federal government went offline this week. Some, like the Behavioral Risk Factor Surveillance Survey and the American Community Survey, are now back online; probably most others will soon join them. But some datasets that the current administration considers too DEI-inflected could stay down indefinitely.
This serves as a reminder of the value of redundancy- keeping datasets on multiple sites as well as in local storage. Because you never really know when one site will go down- whether due to ideological changes, mistakes, natural disasters, or key personnelmoving on.
If you are currently looking for a federal dataset that got taken down, some good places to check are IPUMS, NBER, Archive.org, or my data page. PolicyMap has posted some of the federal datasets that seem particularly likely to stay down; if you know of other pages hosting federal datasets that have been taken down, please share them in the comments.
This is about something unpleasant which I never heard of before this month, but I am sharing in case readers may benefit from a bit of intel here.
In a family I know with two kids under five, it started with the youngest child after he was likely exposed to unclean water. He vomited once, and then was apparently fine. I may be a bit fuzzy on the timeline, but I think it was the next day that the father came down with symptoms. Besides violent emptying of the GI tract from both ends, he was flat in bed for over 24 hours, hardly able to move. This was initially blamed on food poisoning from a restaurant seafood meal, but by the following day, the mom was feeling weak and shortly succumbed, with similar effects.
A woman went over to help this family. She wore a N-95 type mask and washed her hands diligently. Within a few days, the full symptoms suddenly overtook her, as well. But her husband never got it. The older child in the original family seemed to have escaped, but a couple of days later he came down with similar symptoms, which lasted off and on for several days.
Most likely the culprit here was the “norovirus”. The virus is named after the city of Norwalk, Ohio, where an outbreak occurred in 1968. It bears the charming nickname, “the winter vomiting disease.” Although the effects of the virus are very unpleasant, fortunately they usually last only a couple of days, with full recovery being the norm. The sufferer should acquire immunity to that strain of the virus for six months to two years. Some people may escape becoming symptomatic, based on the bacterial populations in their gut biome.
Since this is an economics blog, here are some quick stats. In the U.S. the norovirus is estimated to cause about 20 million illnesses a year and about half of all foodborne disease outbreaks. Norovirus causes some 900 deaths and 100,000 hospitalizations annually, mostly among adults aged 65 and older. It also leads to nearly 500,000 emergency department visits, mostly involving young children.
A model of the worldwide economic burden of the disease found:
Globally, norovirus resulted in a total of $4.2 billion (95% UI: $3.2–5.7 billion) in direct health system costs and $60.3 billion (95% UI: $44.4–83.4 billion) in societal costs per year. Disease amongst children <5 years cost society $39.8 billion, compared to $20.4 billion for all other age groups combined. Costs per norovirus illness varied by both region and age and was highest among adults ≥55 years. Productivity losses represented 84–99% of total costs varying by region. While low and middle income countries and high income countries had similar disease incidence (10,148 vs. 9,935 illness per 100,000 persons), high income countries generated 62% of global health system costs.
Once it shows up in a family, it is hard to avoid. A reason is that you can be sickened by exposure to as few as ten viral particles, compared to billions that are expelled in a bodily fluid incidents. A doctor reported:
She once acquired a norovirus infection by simply using the same bathroom that had been used earlier in the day by a visiting in-law who was recovering from a recent bout with the stomach bug. That’s because “people who have norovirus can shed the virus for up to two weeks after their symptoms are gone.”
In another case, a diner in a restaurant vomited on the floor. The mess was quickly cleaned up by staff, and other diners continued eating. In the next few days, 90% of the people at the same table as the sick person fell ill, along with 70% of the diners at an adjacent table, and 25% of the folks at a table across the room.
OK, that’s the bad news. How can we fight back? Lengthy handwashing with soap should help, along with quarantining as much as possible. It turns out that alcohol is not very good at killing this bug, so the usual hand sanitizers may be ineffective. Better results can be had cleaning surfaces with a bleach-water solution.
The main care needed is hydration. From what I have read, most Gatorade-type sports drinks do provide needed electrolytes (e.g., sodium and potassium), but probably have more sugar that is optimal for this situation. Gatorade Zero has sucralose in place of sugar, if you are OK with that. Pedialyte is designed for rehydration after diarrhea, and has less sugar and more electrolytes than Gatorade. Avoid “Gatorade Water” – it is just water, with the tiniest “infusion” of sodium and potassium.
If you find yourself stricken, it is reportedly wise to have a wastebasket or other receptable at hand in the bathroom, in case you face urgent activity from both ends at once (trying to word this delicately).
Fun fact I learned researching this topic: if the GI tract has been emptied, best avoid dairy for 48 hours after symptoms stop. That allows lactose in the gut to build back up again.
I have never gone on an extended cruise, partly because I don’t think I could resist the frequent offerings of desserts and snacks. But reading of norovirus outbreaks on cruise ships has given me another reason to stay on terra firma.
Americans spend far more on health care than anywhere else in the world but we have the lowest life expectancy among large, wealthy countries.
A lot of that can be explained by the unique aspects of our health care system. Among other things, we reward doctors more for medical procedures than for keeping people healthy, keep costs hidden from customers and spend money on tasks that have nothing to do making patients feel better.
“We spend more on administrative costs than we do on caring for heart disease and caring for cancer,” said Harvard University economist David Cutler. “It’s just an absurd amount.”
The article notes that the whole system is skewed towards high costs. It is not just profiteering insurance companies. Seven factors are listed. I will excerpt them in italics below, and close with a few of my comments.
Reason 1: Lack of price limits
U.S. hospitals have more specialists than do medical facilities in other nations. Having access to 24/7 specialty care, particularly for hospitals in major metro areas, drives up costs… Patients have more elbow room and privacy here. U.S. hospitals typically have either one or two patients per room, unlike facilities abroad that tend to have open wards with rows of beds, Chernew said. He said differences in labor markets and regulatory requirements also can pack on costs.
Of the $4.5 trillion spent on U.S. health care in 2022, hospitals collected 30% of that total health spending, according to data from the Centers for Medicare & Medicaid Services. Doctors rank second at 20%. Prescription drugs accounted for 9% and health insurance − both private health insurance and government programs such as Medicare and Medicaid − collect 7% in administrative costs.
Reason 2: Hospitals and doctors get paid for services, not outcomes
Doctors, hospitals and other providers are paid based on the number of tests and procedures they order, not necessarily whether patients get better. The insurer pays the doctor, hospital or lab based on negotiated, in-network rates between the two parties.
Critics of this fee-for-service payment method says it rewards quantity over quality. Health providers who order more tests or procedures get more lucrative payments whether the patients improve or not.
Reason 3: Specialists get paid much more ‒ and want to keep it that way
Doctors who provide specialty care such as cardiologists or cancer doctors get much higher payments from Medicare and private insurers than primary care doctors.
Some see that as a system that rewards doctors who specialize in caring for patients with complex medical conditions while skimping on pay for primary care doctors who try to prevent or limit disease.
[My comment: There is a saying in management science that your system is perfectly designed for the results you are getting. In other nations with a fixed pot of money, doled out by the government, to mainly non-profit health providers, there is (in theory, at least) an incentive system that would work towards minimizing overall health expenses. In the U.S., though, we have a mainly for-profit system, that collects more moolah the more health problems we have, and the more expensive are the treatments. Most healthcare providers try to be noble-minded and work for the good of their patients, but still the overall financial incentives are what they are. The health insurance companies are one of the few forces working against endless upward spiraling of healthcare costs. ]
Under the current system, doctors are chosen or approved by the American Medical Association to a 32-member committee which recommends values for medical services that Medicare then considers when deciding how much to pay doctors. Some have compared the idea of doctors setting their own payscale to the proverbial fox guarding the henhouse.
Reason 4: Administrative costs inflate health spending
One of the biggest sources of wasted medical spending is on administrative costs, several experts told USA TODAY….Harvard’s Cutler estimates that up to 25% of medical spending is due to administrative costs.
Health insurers often require doctors and hospitals to get authorization before performing procedures or operations. Or they mandate “step therapy,” which makes patients try comparable lower-cost prescription drugs before coverage for a doctor-recommended drug kicks in. These mandates trigger a flurry of communication and tasks for both health insurers and doctors.
Reason 5: Health care pricing is a mystery
Patients often have no idea how much a test or a procedure will cost before they go to a clinic or a hospital. Health care prices are hidden from the public. …An MRI can cost $300 or $3,000, depending on where you get it. A colonoscopy can run you $1,000 to $10,000.
Economists cited these examples of wide-ranging health care prices in a request that Congress pass the Health Care Price Transparency Act 2.0, which would require hospitals and health providers to disclose their prices.
Reason 6: Americans pay far more for prescription drugs than people in other wealthy nations
There are no price limits on prescription drugs, and Americans pay more for these life-saving medications than residents of other wealthy nations.
U.S prescription drug prices run more than 2.5 times those in 32 comparable countries, according to a 2023 HHS report…. Novo Nordisk charged $969 a month for Ozempic in the U.S. ‒ while the same drug costs $155 in Canada, $122 in Denmark, and $59 in Germany, according to a document submitted by Sanders.
[My comment: Yes, this disparity irks me greatly].
Reason 7: Private Equity
Wall Street investors who control private equity firms have taken over hospitals and large doctors practices, with the primary goal of making a profit. The role of these private equity investors has drawn increased scrutiny from government regulators and elected officials.
One example is the high-profile bankruptcy of Steward Health Care, which formed in 2010 when a private equity firm, acquired a financially struggling nonprofit hospital chain from the Archdiocese of Boston.
… Private equity investors also have targeted specialty practices in certain states and metro regions.
Last year, the Federal Trade Commission sued U.S. Anesthesia Partners over its serial acquisition of practices in Texas, alleging these deals violated antitrust laws and inflated prices for patients. …FTC Chair Lina Khan has argued such rapid acquisitions allowed the doctors and private equity investors to raise prices for anesthesia services and collect “tens of millions of extra dollars for these executives at the expense of Texas patients and businesses.”
[ This also concerns me. That anesthesia monopoly should never have been allowed, in my opinion. The reason the PE firm paid to acquire all those individual practices was so that they could raise prices while minimizing services. Duh. That is the PE gamebook. When they do a corporate takeover, they nearly always fire employees and raise prices on products, to goose profits. This would not be a problem if the business were, say, selling pet rocks, but healthcare is different.
In many metro areas now, nearly all healthcare providers (even if they seem to retain their private practices) have become part of one or two mega conglomerates that cover the area. I feel fortunate because at least on of the mega conglomerates in my area is a high-quality non-profit, but I pity those whose only choice is between two for-profits.]
Final comments: I think another factor here is in our private enterprise system, it is so costly to become a doctor that they have to charge relatively high fees to compensate. This leads to a system where there are layers and layers of admins and nurses to shield you from actually seeing the doctor. As an example, I sliced my finger a couple of years ago, and went to an urgent care facility. There was an admin at the desk who took down my insurance info and relayed my condition to the back. Some time later, an aide took me back and weighed me and took my blood pressure. I think a nurse swung by as well. Finally, The Doctor Himself sailed in, to actually patch me up. And of course there were layers of administrative paperwork between me, the care facility, and my insurance company, to settle all the charges.
In contrast, a friend told me that when he broke his arm in the UK, he went to the local clinic, which was staffed by a doctor, and no one else. The doc set his arm, charged him some nominal fee, and sent him on his way.
There are other factors, I’m sure, such as the unhealthy lifestyle choices of many Americans. Think: obesity and opioids, among others. I suspect that is to blame for the poorer health outcomes in this country, more than the healthcare system.
In favor of the current U.S. system, although we pay much more, I think we do get something in return. It seems that with a good health plan, the availability of procedures is better in the U.S. than in many other countries, though I am open to correction on that.
I’ve written about proteins twice before. Once concerning protein content generally and then another concerning amino acid content of animal proteins. The reason that I stuck to animal proteins initially was because I held a common and false belief: Singular vegetarian foods aren’t complete proteins. The meat-eaters gotchya claim is that meats contain complete proteins. After all, we’ve heard a million times that beans and grains are often eaten together because they form a complete protein. The native North Americans? Corn and beans. Subcontinent Indians? Rice and Lentils or chickpeas. Japan? Rice and soy. Choose your poor or vegetarian population in the world, and they combine beans and grains. We’ve always been told that it’s because the combination constitutes a ‘complete protein’.
But you know what else constitutes a complete protein? Any of those foods all by themselves. What the heck. I haven’t been lied to. But I’ve certainly been misled. Let me briefly tell you my research journey. My recommended daily intake (RDI) are from the World Health Organization and the amino acid data is from the US Department of Agriculture. Prices are harder to pin down in a representative way, but I cite those too.
I wrote about the protein content of different foods previously. I summarized how much beef versus pea and wheat flour one would need to eat in order to consume the recommended daily intake (RDI) of ‘complete proteins’ – foods that contain all of the essential amino acids that compose protein. These amino acids are called ‘essential’ because, unlike the conditionally essential or non-essential amino acids, your body can’t produce them from other inputs. Here, I want to expand more on complete proteins when eating on a budget.
Step 1: What We Need
To start, there are nine essential amino acids with hard to remember names for non-specialists, so I’ll just use the abbreviations (H, I, L, K, M, F, T, W, V). The presence of all nine essential amino acids is what makes a protein complete. But, having some of each protein is not the same as having enough of each protein. Here, I’ll use the World Health Organization’s (WHO) guidelines for essential amino acid RDI for a 70kg person. See the table below.
Step 2: What We Need to Eat
What foods are considered ‘complete proteins’? There are many, but I will focus on a few animal sources: Eggs, Pork Chops, Ground Beef, Chicken, & Tuna. Non-animal proteins will have to wait for another time. Below are the essential amino acid content per 100 grams expressed as a percent of the RDI for each amino acid. What does that mean? That means, for example, that eating 100 grams of egg provides 85% of the RDI for M, but only 37% of the RDI for H.