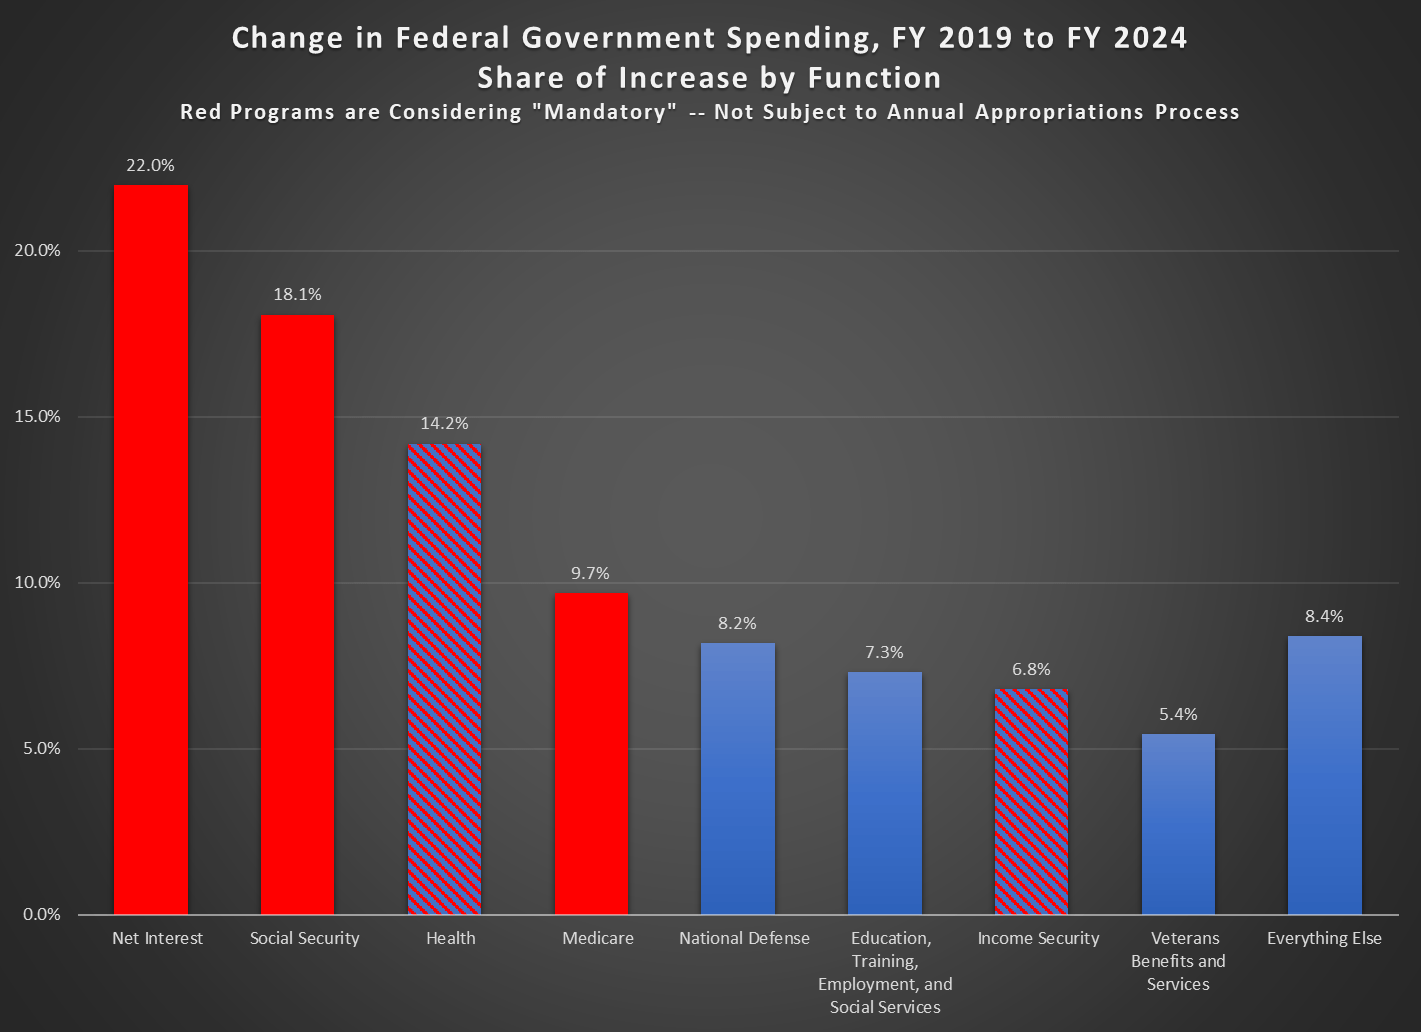
In Fiscal Year 2019, the US federal government spent $4.45 trillion dollars. In Fiscal Year 2024, spending was $6.75 trillion, or an increase of $2.3 trillion dollars. If you adjusted the 2019 number for inflation with the CPI, it would only be about $1 trillion more. Where did that additional $2.3 trillion go?
It will probably not surprise you that most of the increase in spending went to the largest categories of spending. Historically these have been health, Social Security, and defense, but now we must also include interest spending (roughly equal in size to defense and Medicaid in 2024). Indeed, with these areas of spending, 72 percent of the increase is accounted for. Add in the next three functions, and we’ve already accounted for over 90 percent of the increase.
Importantly, most of these categories are outside of the annual federal budget process, meaning that Congress does not need to approve new spending each year (Congress could change them, just as it could change any law, but it’s not part of the annual budgeting process). The “mandatory” categories, as they are called in federal law, are shaded red. I’ve striped with red and blue the health and income security functions, because some of this is subject to the annual budget process, but most of it is not. For example, Medicaid is not subject to the budget process (biggest part of the “health” function) and SNAP is not subject to the budget process (a big part of income security — it is set by the Farm Bill, usually on a five-year cycle).
So, when we talk about the $2 trillion increase since 2019, or the roughly $2 trillion cuts that would be needed to balance the budget, keep in mind that most of this is not subject to the annual budget process. It would require Congress to consider them specifically to enact cuts — though some big categories, such as Social Security, would be automatically cut under current law once their trust funds are exhausted (coming up on about a decade for the Social Security Old-Age Trust Fund).
For many people nowadays, investing in “stocks” means buying a fund like SPY or VOO which tracks the large cap S&P 500 index, or maybe QQQ or QQQM which track the tech-heavy NASDAQ 100 index. These types of funds are exchange-traded funds (ETFs), which very low annual fees (around 0.2% or so). These are so-called passive funds, which mechanically buy and sell stocks such that their holdings match what is in their respective indices. No extra judgment on stock picking is required.
An alternative is to pick stocks yourself, or to buy into a fund with active management, where humans (and their algorithms) try to buy stocks which will beat the passive indices, and try to avoid losing stocks. The active versus passive debate has been going on for decades. There will always be some active funds that outperform in any given year. These successes help keep the allure of active management alive. On average, though, the performance of active funds (before fees) is generally not much different than the passive funds. Thus, with their added fees, the active funds are net losers.
However, there are always cheerful fund managers with a story on how they have a plan to kill it this year, and there are investors willing to buy those stories. Sometimes these fund managers take financial advisors out for expensive lunches, and, behold, said advisors then recommend these actively managed funds to their clients. And so, there are plenty of active funds that still exist. New ones are minted every year, even as some older ones go out of business.
A problem with benchmarking against a cap-weighted fund like SPY or QQQ is that these passive indices are actually very effective. These work as closet momentum-rewarding funds: as the share price of, say, Microsoft goes up and up (presumably because of accelerating earnings), its representation among the biggest 500 companies (by stock capitalization) goes up. Thus, the better, growing companies automatically keep making bigger contributions to the indices, while fading companies sink to lower and lower per cent weighting. That works well to relentlessly home in on the relatively few stocks that account for the gains of the entire market, and to weed down all those other firms, most of which are net losers on stock price over time. This algorithm governing the cap weighted funds is tough for active management to beat.
Having stated these challenges, I’d like to compare performance of some actively-managed funds that have shown enhanced performance in recent years. The problem is, of course, we cannot know if this outperformance will continue. But hopefully looking at performance and discussing the underlying strategies of the funds may help investors decide if they would like to participate in any of them.
Two broad categories of stock funds are growth and value. Growth looks at how fast a firm is increasing revenues, earnings, etc. Most tech stocks command high share prices because of their growth prospects, rather than current earnings (although many of the current big tech leaders generate gobs of cash). Value looks at measures such as price/earnings and price/sales and price/book value, hoping to find undervalued firms whose price does not yet reflect the underlying value. Tech funds are generally under-represented in the value category.
Here we will look at five good actively-managed ETFs, and compare total returns (with dividends reinvested) to the S&P 500 fund SPY. They all claim to incorporate both growth and value into their stock picking. These five funds are:
SPGP – This is a supposed “growth at a reasonable price” fund, which seems to weight value more than growth. In top ten holdings, there is only one tech stock, a 2.7% weighting of Nvidia. There are four petroleum companies, and diverse smattering of other types of firms.
GARP – Another “growth at a reasonable price” (note “G.A.R.P.”) fund. This tilts heavily toward growth: seven of the top ten holdings are tech, with 5.43% Nvidia.
PVAL – As indicated in the name (Putnam Focused Large Cap Value), this is a value fund, but with some growth considerations – – The top ten are: Walmart (retail), Exxon Mobil (petro), Thermo Fisher Scientific, Citigroup, Bank of America (finance), Oracle (tech), UnitedHealth Group (healthcare), Coca-Cola, NXP Semiconductors, and PulteGroup (homebuilder).
MOAT – – “VanEck Morningstar Wide Moat” – This fund seeks to replicate the performance of the Morningstar® Wide Moat Focus Index, which in turn tries to identify a diverse group of U.S. large companies with wide “moats”, that give them sustainable advantages over competitors. Four measures are used to determine a corporation’s dominance: Intangible Assets (brands, patents, proprietary technologies); Switching Costs (inconvenient for the customer to find an alternative); Network Effect (when customers use one service, they adopt additional company services); Cost Advantage.
FFLC – This fund uses “fundamental analysis” and looks for companies that can take advantage of trends in “technological advances, product innovation, economic plans, demographics, social attitudes, and other factors”. An analysis of the fund’s holdings (heavy in big tech; 6% Nvidia) shows a strong focus on growth and momentum, with a moderate value weighting.
All these funds have plausible rationales for choosing the stocks they do. A big question is always: how much of a company’s promise is already reflected in its stock price? If everyone else has already figured out that, say, Microsoft will have high sustained earnings growth, then maybe the current share price is so high that it will not go up any faster than the broad market.
Now for the charts. I will discuss 1-year, 3-year, and 5-year charts, so we can see how the fund strategies worked in different market regimes. The one-year chart covers the raging bull market of the past twelve months, especially in AI-related tech/growth stocks. The 3-year chart encompasses a lengthy bear episode that occupied most of 2022, in reaction to the raising of interest rates to tamp down inflation. The 5-year chart includes the brief but sharp pandemic panic March-April 2020, sandwiched in a huge rise in internet-related big tech stocks 2019-2021.
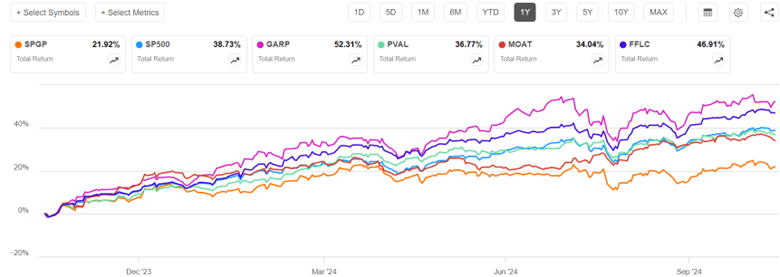
One-Year Chart
Over the past one year, GARP (52% return) soared way above S&P 500 (blue line, 39%), but with high volatility, consistent with its heavy growth/tech exposure. FFLC steadily pulled ahead of SP500 over the past twelve months, racking up a 47% return. PVAL and MOAT finished close to SP500, while tech-poor SPGP flat-lined in the most recent six months and so got left far behind.
Three-Year Chart (End Oct 2021-end Oct 2024)
The defining features of the past three years were a roughly 21% bear market decline in S&P 500 during Jan-Oct 2022, followed by a strong recovery, which was interrupted by a moderate slump July-Oct 2023. FFLC and PVAL performed nearly identically for the first third of this time period (through early March, 2023). They dropped much less than SP500 in 2022, and so by early March, 2023 they were some 15% ahead of SP500. PVAL’s lead over SP500 shrank a bit over the next twelve months, and then widened March-July 2024, to give PVAL (43%) a 16% advantage over SP500 (27%) at the end of three years. FFLC just kept steadily widening its lead over SP500, ending with a 58% return over this three-year time period. MOAT and SPGP also fell less than SP500 in 2022, but fell more than PVAL and FFLC, and they did not keep pace with the tech-led surge in 2023-2024. In the end, MOAT finished essentially even with SPY, and SPGP finished lower (18%). Tech-heavy GARP crashed harder than SP500 in 2022, but more than made up for it with the 2024 tech-fest, finishing well above SP500 and tied with PVAL at 43%.
I won’t show the full five-year chart, since some of the funds did not start prior to that period. But I will make a few semi-quantitative comments. The five-year time period is a little kinder to SPGP – this fund showed a fairly consistent lead over SP500 in 2021 as well as 2022, and so got rave reviews then in the investing literature. It was only in the past six months that it performed so poorly.
FFLC got off to a rocky start, falling about 10% behind SP500 in 2020-2021, although its winning ways since then gave it the overall best 5-year performance. GARP and MOAT pretty much kept pace with SP500 Oct 2019-Oct 2021, so their five-year performance vs SP500 is about the same as for three-year (GARP soundly beat SP500, MOAT roughly tied).
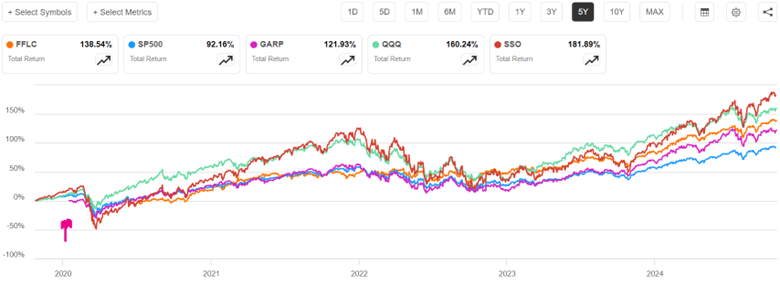
One more chart (below), a five-year comparison of SP500 to FFLC (overall winner among the active funds discussed above) and GARP (tech-heavy) to QQQ (passive, tech-heavy, tracks NASDAQ 100 stocks) and SSO (its stock price moves up and down 2X the daily price movement of S&P500). GARP didn’t start operation till early 2020 (marked by red arrow on chart), to its curve should be shifted up to make a fair comparison with the others; with this correction, it would end up roughly tied with FFLC, with both these funds beating SP500 by about 33% (135% return vs 92%). But even these stellar active funds were soundly beaten by QQQ and even more by the passive 2X fund SSO. Holders of SSO, however, would have suffered heart-stopping drawdowns along the way (e.g. over 50% loss in market value in early 2020).
Readers can draw their own conclusions from this flyover of results. Just like you can fool people some of the time, any active fund may beat “the market” (e.g., S&P 500) some of the time. Some active funds seem to beat the market most of the time. But it is most unlikely that any given fund will beat it all of the time. The S&P 500 algorithm is actually pretty effective. It may behoove the investor to make their own judgement as to what market regime we are in or are about to be in, and to choose active funds which are more likely to thrive in that regime.
I am motivated to include some FFLC (for overall consistent good performance) and PVAL (for a bit of crash protection) in my holdings. But I recognize that their performance could deteriorate in the future, if their investing style no longer works in some new market regime. SPGP is a cautionary example, going from rock star in 2021-2022 to awful in 2024. Even FFLC had an unfavorable first year of operation. The tech giants that dominate QQQ continue to also dominate earnings growth, so QQQ may continue to outpace SP500.
As far as SSO, I earlier wrote on strategies for 2X returns using 2X funds or call options. If you think stocks are going to keep going up, it can make sense to hold these 2X funds. Many advisors, though, recommend against just buy and hold because of the enormous possible losses in a crash; too many investors panic and sell at a low price in that situation. I hold some QLD, which is a 2X QQQ fund, but only as a minor component of my portfolio. Also, if I can overcome fear in the moment, I plan to swap out of plain vanilla stock funds and into a 2X fund like SSO after the next big dip in the market, and then swap back out of SSO after the market recovers.
Disclaimer: Nothing here should be considered advice to buy or sell any security.
It’s spooky season and I just received perhaps the spookiest of student emails. We all know that students never read the syllabus, only want to know what’s on the exam, and can’t be bothered to pay attention. But, and hear me out…what if they are listening?
I got this email yesterday. It might be my favorite student email ever, even if it is direct evidence that my stream of consciousness while lecturing, from the students’ perspectives, must border on surreal at times. I don’t know that much of it is actually funny, but it’s interesting to see what actually sticks in a student’s mind. Notes in curly brackets { } are edits and additions from me, with a few small redactions to ensure the anonymity of the student:
From: {NAME REDACTED}
Halloween is the time to celebrate the spooky things in life, and what is scarier than being perceived? I have taken it upon myself to write down some of the silly things you say in class throughout the month of October to celebrate the scariest time of the year. I have compiled them all here and I think you should be proud of your wit. I think they are funnier without context, so in the spirit of politics, I will be leaving it out.
“I’m just a decomposing corpse here on stage.”
“The good thing about a recession is it’s not a vibes-based measure.”
“[Imagine] You’re wearing a suit, mens or pant….”
“We’re not making assumptions about shapes… yet.”
“Can you imagine the ad campaigns for the eight year old vote?!”
“[In reference to Jesse Ventura, one might even imagine little hearts scribbled in the margins] He’s perfect” {Note: This was not said in admiration of his politics, but rather his existence as Jesse Ventura}
“{Irrelevant 3rd party candidate} is the antichrist, that’s all I know. They kicked my dog and I want to throw them into the 4th layer of hell.”
(with the most deadpan tone and expression) “Yippee, we’re fine, we’re free, we’re great.”
“There’s crooks, and then there’s crooks”
“What I’m saying is, we’re all becoming monsters.” (very on theme to be honest)
“I cannot tell the difference between parody and reality.” (uh oh)
“White gets 1, grey gets 0, and professor Makowsky goes into a quiet rage.”
“Get an amish pretzel with amish butter on it, ya know. Love yourself.”
“Stay away from the swamps, there’s luggage there that wants to eat you.”
The experimental economics world is currently still doing data collection in traditional physical labs with human subjects who show up in person. This is still the gold standard, but it is expensive per observation. Many researchers, including myself, also do projects with subjects that are recruited online because the cost per observation is much lower.
As I remember it, the first platform that got widely used was Mechanical Turk. Prior to 2022, the attitude toward MTurk changed. It became known in the behavioral research community that MTurk had too many bots and bad actors. MTurk had not been designed for researchers, so maybe it’s not surprising that it did not serve our purposes.
The Prolific platform has had a good reputation for a few years. You have to pay to use Prolific but the cost per observation is still much lower than what it costs to use a traditional physical laboratory or to pay Americans to show up for an appointment. Prolific is especially attractive if the experiment is short and does not require a long span of attention from human subjects.
This week at my university the Economics Department Co-hosted an event titled “Interest Rates and Student Loans” with the Office of Financial Aid. I discussed interest rates for a broad audience of young adults. Below is my talk on interest rates.
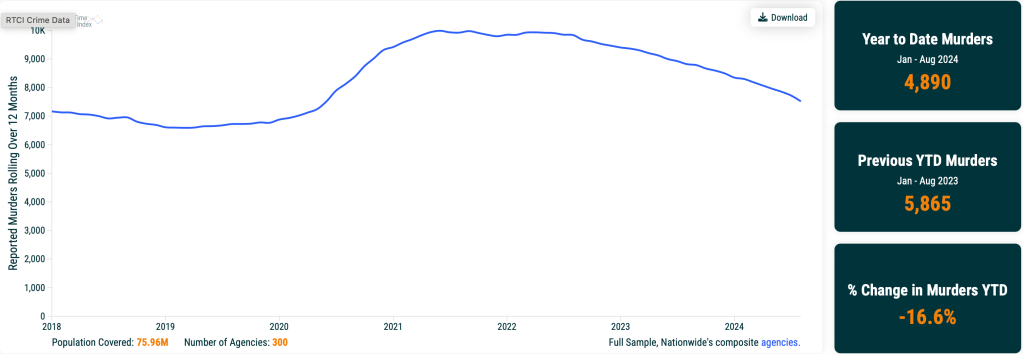
If you want to know how many pigs were killed in the United States yesterday, the USDA has the answer. But if you want to know how many humans were killed in the US this month, the FBI is going to need a year or two to figure it out. The new Real Time Crime Index, though, can tell you much sooner, by putting together the faster local agency reports:
Trends currently look good, though murders still aren’t quite back to pre-2020 levels.
In addition to graphing top-line state and national trends, the Real Time Crime Index also offers the option to download a CSV with city-level data going back to 2018. This seems like a great resource for researchers, worthy of adding to my page of most-improved datasets.
As the presidential race finishes out the last two weeks, it’s clearly a close race. In the past I have recommended prediction markets, and right now these are giving Trump about 60% odds. There have been lately a few big bettors coming into the markets and primarily betting on Trump, so there has been speculation of manipulation, but even at 60-40 the race is pretty close to a toss-up.
Another tool many use to follow the election are prediction models, which usually incorporate polling data plus other information (such as economic conditions or even prediction markets themselves). One of the more well-known prediction models is from Nate Silver, who right now has the race pretty close to 50-50 (Trump is slightly ahead and has been rising recently).
But Silver’s model, and many like it, is likely very complicated and we don’t know what’s actually going into it (mostly polls, and he does tell us the relative importance of each, but the exact model is his trade secret). I think those models are useful and interesting to watch, but I actually prefer a much simpler model: Ray Fair’s President and House Vote-Share Models.
The model is simple and totally transparent. It uses just three variables, all of which come from the BEA GDP report, and focuses on economic growth and inflation (there are some dummy variables for things like incumbency advantage). Ray Fair even gives you a version of the model online, which you can play with yourself. Because the model uses data from the GDP report, we still have one more quarter of data (releasing next week), and there may be revisions to the data. So you can play with it (and one of the variables uses the 3 most recent quarters of growth), but mostly these numbers won’t change very much.
I focus much of my investing energy in the “high yield” area, finding stocks that pay out highish yields (8-12%, these days). Unless the company really hits hard times and has to cut its payout, I know I will make those returns over the next twelve months. But with ordinary stocks, you cannot count on any particular returns. The price of any stock a year from now will be the earnings per share (which can be forecasted with some degree of accuracy) times the price/earnings ratio, which is largely dependent on the emotions (“animal spirits”, in the words of Keynes) of the millions of market participants. Will I find a “greater fool” to buy my Amazon stock in a year for 20% more than I paid for it??
I have never gotten really comfortable with that as an investing model, and so I have erred on the side of caution and generally held less than the recommended 60% or so of my portfolio in plain stocks. In hindsight, that was a mistake. Every $10,000 put into the plain, dumb S&P500 fund SPY twenty years ago has turned into roughly $200,000. One reason for my caution has been a steady stream of articles that always warn that stocks are overvalued; after going up so much in the past X years, surely returns will be poor for the next several years.
But I try to learn from my mistakes, and I am now forcing myself to hold more equities than I “feel” like. To support this hopefully rational behavior, I am paying more attention to articles that present bull cases for stocks. One author on the Seeking Alpha investing site who has been consistently and correctly bullish for the past two years is Lawrence Fuller. Here I will summarize his Oct 9 article with the tongue-in-cheek title Be Afraid, Be Very Afraid. (To read articles on Seeking Alpha, you may have to start a free account, where you just have to give them an email address; I use my secondary “junk” email for these sorts of applications, which tend to send a lot of junky (not malicious) notifications).
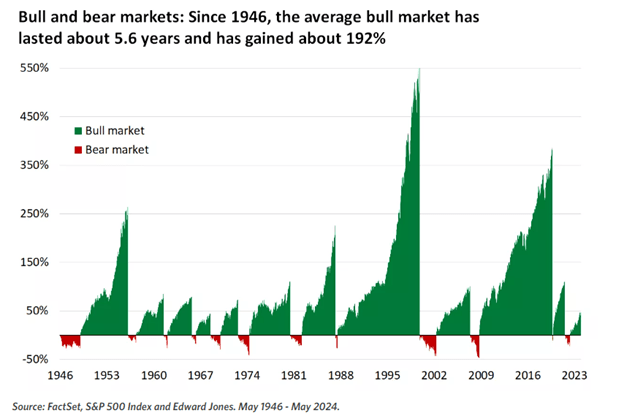
He first addressed the angst that says, “Stocks have already run up so much, they are due for a crash”, by means of this chart showing cumulative returns in preceding bull markets:
It is obvious that, compared to the average bull market, we are still in early innings with the present bull which started in Oct 2022.
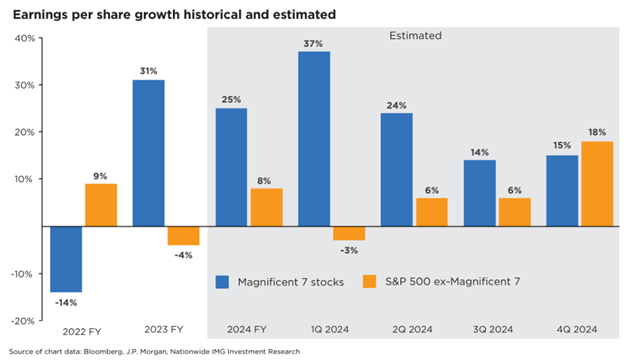
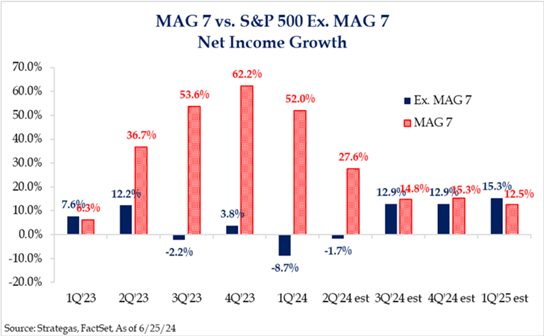
Fuller also makes the case that the good news on earnings has spread recently from the so-called Magnificent Seven big tech stocks (Microsoft, Apple, Nvidia, etc.) to the broader market. This should serve to support further price rises in the broad indices:
The chart below, which shows a similar story, in terms of net income growth:
He concludes:
“It is also important to recognize that the valuation of the S&P 500 is far more reasonable when we exclude the exceedingly expensive Magnificent 7 and focus on the remaining 493. In fact, we don’t have the valuation problem that bears purport we have today. Hence, I advised investors to avoid the market-cap-weighted indexes and focus on equal weight or look at sectors that had been left behind during the bull market to date…Therefore, I suggest not succumbing to fear. Instead, focus on whether the weight of evidence suggests we should be in wealth accumulation mode or wealth preservation mode.”
In a follow-up article, Are You Worried About An Overvalued Market? , Fuller notes that small cap stocks (as defined by the Russel 2000 index, which is held by the IWM fund) are more reasonably valued than big tech, and so are likely to outperform over the next year.
Economic data will appear alarming due to hurricane impacts, but the economy is growing at 3% with strong corporate profit prospects and low recession risk.
Inflation is on track to fall to 1.8% by May, with real wage growth outpacing pre-pandemic trends. Future inflation is expected to remain stable at 2.1% over the next 30 years.
Market valuation is not as overvalued as feared, with potential for significant upside (up to 30% to 38%) based on corporate profit growth and falling interest rates.
Short-term market volatility is normal; long-term investors should embrace corrections for potential high returns as fundamentals remain strong.
The average 2-year return after a 10+% correction is 35%, meaning long-term investors should embrace corrections as wonderful buying opportunities. Buy with confidence in the face of any short-term market weakness, as long as you stick to your optimal personal asset allocation, based on your specific risk profile and financial needs.
This article has a number of interesting and informative sections, including on why cash flow/enterprise value is a better metric for assessing the valuation of a stock than price/earnings.
I am part of the exodus from Twitter to Bluesky. I still maintain my Twitter account, but do not post there. I do, however, still scroll both of my feeds on occasion. I am more optimistic for the future of Bluesky for a variety of reasons, not least of which is simply that it is improving with each week. The mechanics are excellent, there is far less garbage/noise/bots, and I never feel like I am party to anything with nefarious ambitions in the long or short run. There is a problem though.
It’s still kind of… boring. The echo chamber feeling at Bluesky is stronger, born almost exclusively of the selection effects of first and second movers from Twitter. I am rarely surprised on Bluesky, I never feel terribly challenged in an exciting way, unless you count the more frequent posting of squishy academic policy affirmations. There’s plenty of (warranted) election anxiety, but there’s no oppositional forces. There’s no tension.
Which is not to say Twitter is providing any of that in spades. Quite to the contrary, it’s a shell of its former self. The heaviest posters with the biggest followings have found plenty of reasons to stay, but for every big follower account, there were hundreds of medium sized accounts that pushed and pulled the conversation in interesting directions, providing both traction and the occasional surprise. A large share of medium accounts have abandoned ship, some moving to Bluesky, but far more have just dropped out of the medium entirely (apologies for the homonyms). There are interesting people left on Twitter, but they are inundated with bots, trolls, and milquetoast careerists only hanging around because they fell ass backwards into a couple thousand followers and feel too capital committed to move elsewhere. A once rich and diverse intellectual stew has been watered down into a thin broth of increasingly questionable nutritional value. And like a lot of spicy foods, I know I used to complain about the heat while I was eating it, but damned if I don’t miss it all the same.
Bluesky has passed the proof of concept. It works. It has value. Now we just need that final cohort to make the leap and bring the heat.
UPDATE ADDENDUM (10/22/24)
So THAT happened. Most people who are going to read it have already read it, but I did want to add two notes for future reference, both of which I tacked onto bluesky threads.
I’ll admit I didn’t expect the word “tension” to get parsed as “negative approbation” , trauma, horrific violence, or hate. I could blame this on the internet, but this is my fault. I’ve been around long enough I should have know better. There is a reason why I tend to write things that come off pre-emptively defensive or as if they are equivocating. I try to prevent misinterpretation, willful or earnest, of my words. I should have done a better job here.
People are rightfully protective of Bluesky as a space separate from Twitter. That said, there are definitely a lot of trolls and bots already in place trying to turning any discourse into a hatefest.
Some highlights from reading the book What is Real? The Unfinished Quest for the Meaning of Quantum Physics*
Page 9 “The godfather of quantum physics, Niels Bohr, talked about a division between the world of big objects, where classical Newtonian physics rules, and small objects, where quantum physics reigned.”
The book has some drama, much centered around Einstein’s rejection of the Copenhagen interpretation.
The title of Chapter 2 is so excellent: “Chap 2: Something Rotten in the Eigenstate of Denmark”
Pg 37 “But Max Born had discovered a piece of the puzzle that summer. He found that a particle’s wave function in a location yields the probability of measuring the particle in that location – and that the wave function collapses once measurement happens… The measurement problem had arrived.”
Pg 56 “Einstein rejected any violation of locality, calling it “spooky action at a distance” in a letter to Max Born.”
Pg 79 “By the end of the war, the Manhattan Project had cost the nation nearly $25 billion, employing 125,000 people at thirty-one different locations across the United States and Canada. Hundreds of physicists were called away from their everyday laboratory work … After the war ended, physics research in the United States never returned to what it was… Damned by their success … military research dollars poured into physics.”
Pg 82 “Research into the meaning of quantum physics was one of the casualties of the war. With all these new students crowding classrooms around the country, professors found it impossible to teach the philosophical questions at the foundation of quantum physics.”
Joy: The politics of physics in academia was interesting to me. I recommend this book to university economists on that merit alone.
Page 100 “the photons are deliberately messing with you”
Experimentalists take note, page 104 “The story that comes along with a scientific theory influences the experiments that scientists choose to perform”
Joy: Having no internet greatly slowed down the spread of the correct ideas. However, eventually, over the course of a few decades and with a few career casualties, the more correct information did seem to influence the consensus.
Joy: I’m used to economists having very basic and sometimes heated disagreements. One might say that issues in economics are a bit more subjective than a topic in the physical sciences. However, with quantum physics turning out to be so weird, there are also heated disagreements among the physicists.
An equivalent book for economics might be Grand Pursuit by Sylvia Nasar.
Pg 108: “Bohm’s theory had also appeared during the height of Zhdanovism, an ideological campaign by Stalin’s USSR to stamp out any work that had even the faintest whiff of a conflict with the ideals of Soviet communism.”
Pg 124: “This universal wave function, according to Everett, obeyed the Schrödinger equation at all times, never collapsing, but splitting instead. Each experiment, each quantum event… creating a multitude of universes…”
*Thanks to Josh Reeves and Samford University for buying me the book.