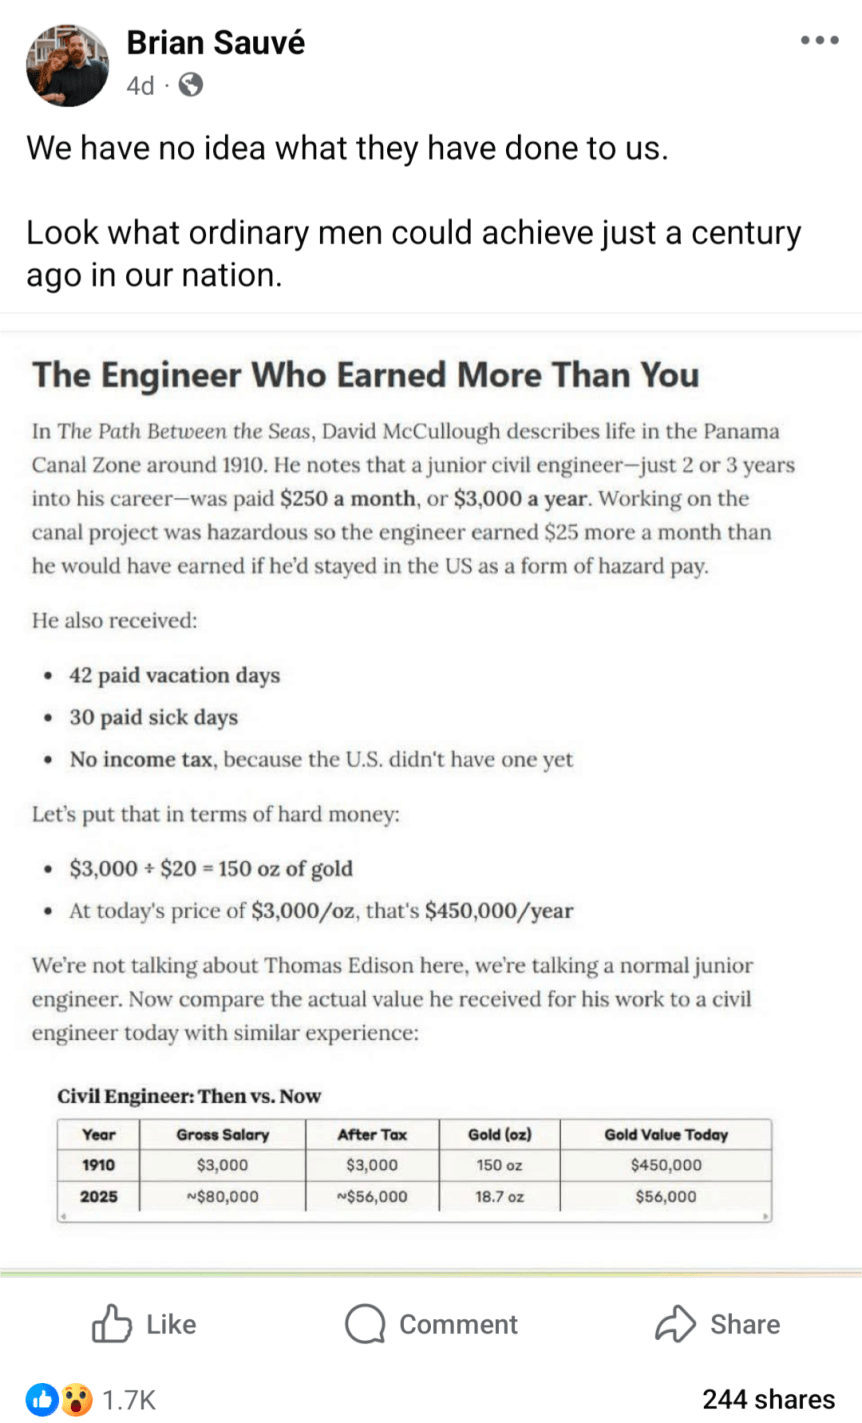
Inflation adjusting income and prices from the past is a common theme in my blog posts, including fact checking of other attempts to do these adjustments. But here is a really novel one, in a viral post from Facebook (which comes from this essay), which claims that a civil engineer earned the equivalent of $450,000 in today’s terms:
Can this be correct? If so, it would represent massive stagnation in incomes over time. Thankfully, there are two major errors, or at least misleading aspects to the calculation.
- The listed salary was not one of an “ordinary man” — far from it.
- Using gold prices to inflation adjust the incomes is very misleading.
First, the salary: $3,000 per year was definitely not what ordinary men earned. The average wage, for example, for a production worker in manufacturing was 18 cents per hour. You would need to work almost 17,000 hours to earn $3,000 at that wage, which of course is not possible. In reality, the average worker put in 57 hours per week — which means they earned about $500 if they were able to work 50 weeks per year (most probably didn’t). So already we see that the civil engineer working on the Panama Canal is making about 6 times as much as an “ordinary man.” Agricultural workers, the other main industry of 1910, earned about $28 per month ($22 if they also received board) — even less than manufacturing, and only about 1/10 of the engineer
Second, the gold price adjustment is misleading. Yes, in 1910, gold was how we defined currency in the US. But you can’t eat gold, and most people only keep a little gold on hand that can be described as providing services for them (such as jewelry). What people really wanted were real goods and services, and mostly goods. Around 1910, the average American household spent about 40% of their income on food, 23% on housing, and 15% on clothing. Comparing standards of living over time requires us to look at what people spend their money on, not what the currency is denominated in. And that’s what a good consumer price index does: it compares the prices of all consumer spending at different points in time, not just one thing like gold, allowing us to make rough comparisons of income over time.
Using the Measuring Worth historical CPI (which extends the BLS CPI back before 1913), we see that the index was 9.21 in 1910, and it stands at 323.364 in August 2025. So the 18-cent manufacturing wage from 1910 is roughly equivalent to $6.32 in current dollars. The average manufacturing wage today? Around $29. And of course, workers today have a whole range of fringe benefits, worth roughly another $13.58 for private sector workers. This means that an “ordinary man” today working in manufacturing can buy 5-7 times as many real goods and services as his 1910 counterpart for each hour he works. And the work is, of course, much safer today: BLS reports 23,000 industrial deaths in 1913 (61 deaths per 100,000 workers), but only 391 manufacturing deaths in 2023 (0.003 deaths per 100,000 workers).
But what about that extraordinary man in 1910, the civil engineer? How was he doing compared with today? Using the same historical CPI, we can see that $3,000 in 1910 is roughly equivalent to $105,000 today. Not bad! That’s almost exactly the median pay for civil engineers today. But keep in mind the civil engineer working in Panama was an unusually highly paid position. A 1913 report from the American Society of Civil Engineers suggests that most early career civil engineers were making closer to $1,500 per year — half of the Panama engineer. Engineers were also a highly skilled, very rare profession in 1910. And don’t forget that about 10% of the American workers on the Canal died in the construction, mostly from disease so the engineers were probably just as susceptible to death as the laborers.
Finally, we might ask a different question: what if you had held onto gold since 1910? Let’s say your great-great grandfather was a civil engineer, and managed over the course of a few years to save one year’s salary in gold. He even managed to hide it during the 1930s-1970s, when private holding of gold was generally illegal in the US.
How much would that 150 ounces of gold be worth today? That answer is simple: about $615,000 today (gold has gone up a bit just since that calculation was done in May!). But was that a good investment? Not really. A $3,000 investment in the stock market from 1910 to 2024 would be worth about… $120 million (it’s actually a bit more than that, since the market continued to rise after January 2024). Of course, that would have required a bit of active management, since index funds don’t come along until much later. But your great-great grandfather would have been much wiser to set up a trust for you and have it actively managed to approximate the entire US stock market, rather than to bury 150 ounces of gold in his backyard.
Even assuming you lost half the value to management fees, the stock portfolio today would be worth at least 100 times as much as the gold.

