Small, rural, private schools stand out to me as the most likely to show up on lists of closed colleges. This summer I discussed a 2020 paper by Robert Kelchen that identified additional predictors using traditional regression:
sharp declines in enrollment and total revenue, that were reasonably strong predictors of closure. Poor performances on federal accountability measures, such as the cohort default rate, financial responsibility metric, and being placed on the most stringent level of Heightened Cash Monitoring
Kelchen just released a Philly Fed working paper (joint with Dubravka Ritter and Doug Webber) that uses machine learning and new data sources to identify more predictors of college closures:
The current monitoring solution to predicting the financial distress and closure of institutions — at least at the federal level — is to provide straightforward and intuitive financial performance metrics that are correlated with closure. These federal performance metrics represent helpful but suboptimal measures for purposes of predicting closures for two reasons: data availability and predictive accuracy. We document a high degree of missing data among colleges that eventually close, show that this is a key impediment to identifying institutions at risk of closure, and also show how modern machine learning algorithms can provide a concrete solution to this problem.
The paper also provides a great overview of the state of higher ed. The sector is currently quite large:
The American postsecondary education system today consists of approximately 6,000 colleges and universities that receive federal financial aid under Title IV of the federal Higher Education Act…. American higher education directly produces approximately $700 billion in expenditures, enrolls nearly 25 million students, and has approximately 3 million employees
Falling demand from the demographic cliff is causing prices to fall, in addition to closures:
Between the early 1970s and mid-2010s, listed real tuition and fee rates more than tripled at public and private nonprofit colleges, as strong demand for higher education allowed colleges to continue increasing their prices. But since 2018, tuition increases have consistently been below the rate of inflation
Most college revenue comes from tuition or from state support of public schools; gifts and grants are highly concentrated:
Research funding is distributed across a larger group of institutions, although the vast majority of dollars flows to the 146 institutions that are designated as Research I universities in the Carnegie classifications…. Just 136 colleges or university systems in the United States had endowments of more than $1 billion in fiscal year 2023, but they account for more than 80 percent of all endowment assets in American higher education. Going further, five institutions held 25 percent of all endowment assets, and 25 institutions held half of all assets

Now lets get to closures. As I thought, size matters:
most institutions that close are somewhat smaller than average, with the median closed school enrolling a student body of about 1,389 full-time equivalent students several years prior to closure
As does being private, especially private for-profit (states won’t bail you out when you lose money):

As do trends:
variables measuring ratios of financial metrics and those measuring changes in covariates are generally more important than those measuring the level of those covariates
When they throw hundreds of variables into a machine learning model, it can predict most closures with relatively few false positives, though no one variable stands out much (FRC is Financial Responsibility Composite):

My impression is that the easiest red flag to check for regular people who don’t want to dig into financials is “is total enrollment under 2000 and falling at a private school”.
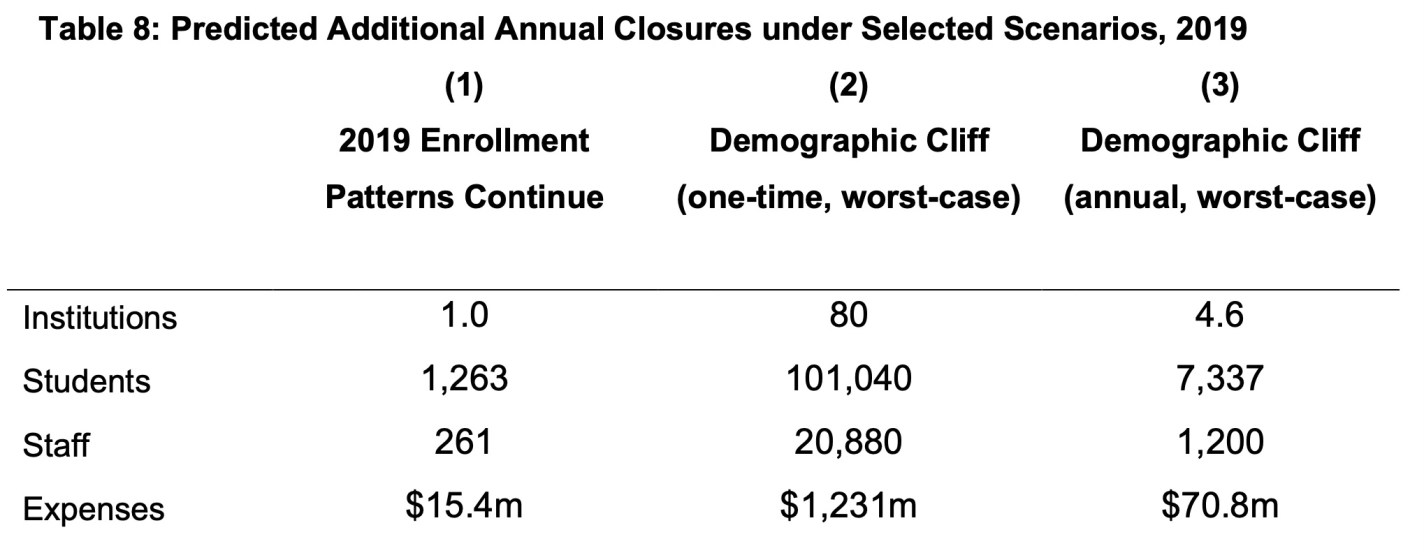
They predict that the coming Demographic Cliff (the falling number of new 18-year-olds each year) will lead to many more closures, though nothing like the “half of all colleges” you sometimes hear:
The full paper is available ungated here. I’ll close by reiterating my advice from the last post: would-be students, staff, and faculty should do some basic research to protect themselves as they consider enrolling or accepting a job at a college. College employees would also do well to save money and keep their resumes ready; some of these closures are so sudden that employees find out they are out of a job effective immediately and no paycheck is coming next month.


