More Or Less Money

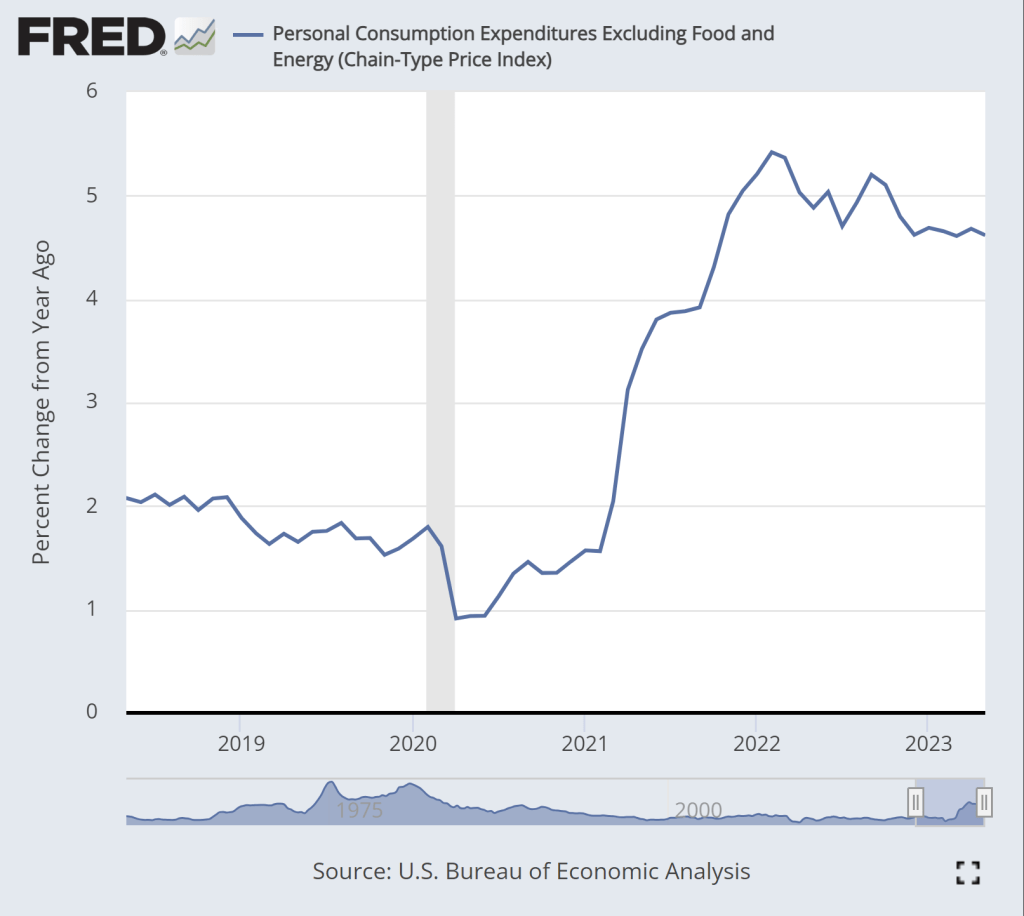
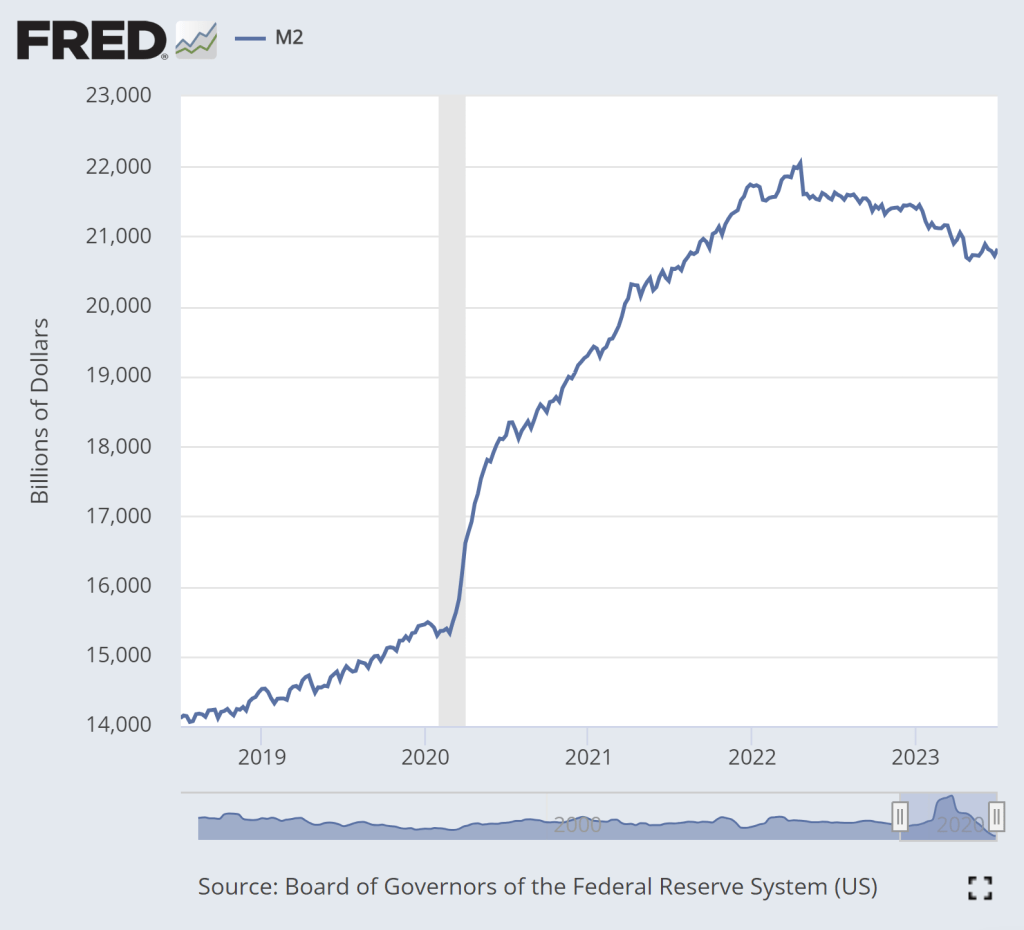
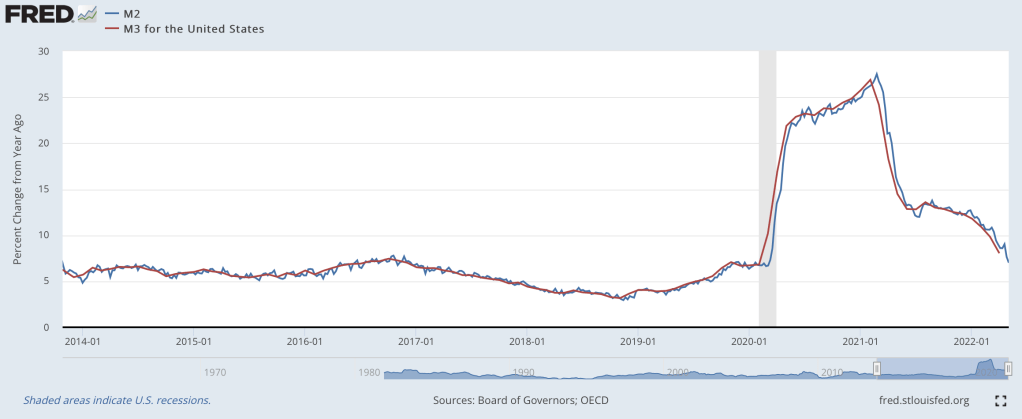
Money and interest rates have been in the news because the Fed wants to slow the rate of inflation, maintain financial stability, and avoid a recession. Let’s break it down. First, some broad context. The M1 and M2 were all chugging along prior to 2020. M2 was growing along with NGDP and, after raising interest rates, the Fed had begun lowering them again. Then Covid, the stimuli, and the redefinition of M1 happened. Now, we’re trying to get back to something that looks like normal. See the graphs below.

https://fred.stlouisfed.org/graph/?g=1aFgM
https://fred.stlouisfed.org/graph/?g=1aFgO

But these aggregates gloss over some relevant compositional changes. Let’s go one-by-one.

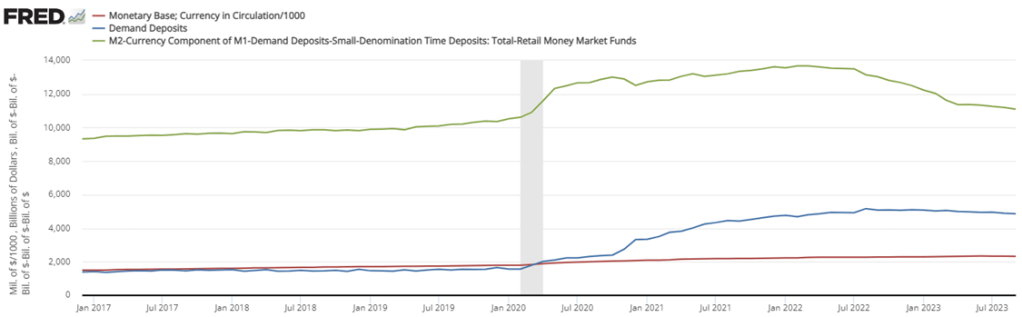
The monetary base includes both bank reserves and currency in circulation. We could break it down further, but I’ll save that for another time. What we see is that while currency in circulation did grow faster post-covid, it was nothing compared to the growing reserve balances. From January to May of 2020, currency grew by 7.5% while reserves almost doubled. That means a few things. 1) People weren’t running on banks. Covid was not a financial crises in the sense that people were withdrawing huge sums of cash. 2) Banks were well capitalized, safe, and stable. Further, uncertainty aside, banks were ready to lend. And they did. Not long after the recession, everyone and their brother was re-financing or taking on new debt. More recently, we can see that currency has stabilized and, again, most of the action has been in reserve balances. As of September 2023, reserve balances are down 23% from the high in September 2021.

https://fred.stlouisfed.org/graph/?g=1aF06

The thing about the monetary base, however, is that reserves don’t translate into more spending unless the reserves are loaned out. The money supply that people can most easily spend, M1, is composed of currency held outside of banks, deposit balances, and “other liquid deposits” (green line below).*  See the graph below. Again, most of the action wasn’t in the physical printing of hard, physical cash. People’s checking account balances ballooned thanks to less spending on in-person services and thanks to the stimulus checks and other relief programs. Deposit balances more than doubled from January to December of 2020. Ultimately, deposit balances were 3.3 *times* higher by August of 2022. Since then, the balances have been on a slow, steady decline of about 5.8% over the course of the year. But even then, it’s those “other” deposits, previously categorized as M2, where most of the action is. The value of those balances have fallen by a whopping 2.5 *trillion* and 19% dollars in the past 18 months. People are drawing down their savings.

https://fred.stlouisfed.org/graph/?g=1aFgV

Finally, we get to M2, the less liquid measure of the money supply. Besides the M1 components, it also includes small time deposits, such as CD’s, and money market funds (not including those held in IRA and Keogh accounts). Money market funds and small time deposits have *increased* in value since the post stimulus tightening as people chase the allure of higher interest rates on offer. Measured by volume, the declines in the broad money supply have darn near all come from declines in M1 (again, the jump is redefinition). And of that, it’s almost entirely coming out of “other” liquid deposits, as illustrated above. That’s savings balances. It’s true that there is some other-other balances, but it’s mostly savings accounts.

https://fred.stlouisfed.org/graph/?g=1aFgY

Zooming in on just those “other” balances (below left), people still have higher balances than they did prior to the pandemic. But by now, they’re below the pre-pandemic trend.  Savings accounts are depleted. However, since many people don’t use savings account anymore due to the decade plus of low interest rates, it’s appropriate to consider both “other” accounts and demand deposits (below right). By that measure, we still have plenty of post-Covid liquidity at our disposal.

https://fred.stlouisfed.org/graph/?g=1aFLj
https://fred.stlouisfed.org/graph/?g=1aFLo


*Other liquid deposits consist of negotiable order of withdrawal (NOW) and automatic transfer service (ATS) balances at depository institutions, share draft accounts at credit unions, demand deposits at thrift institutions, and savings deposits, including money market deposit accounts.

PS. So where is all this above-trend NGDP coming from, if not the money supply? Hmmmm.

A Pessimistic Take on Inflation

Last week I wrote an optimistic take on inflation. The rate of general price inflation has fallen a lot in recent months, and wage growth is now clearly outpacing inflation. That’s all good news.

Today, the Fed will announce their latest interest rate decision. Will the good news on inflation lead the Fed to stop raising interest rates? I’m not very good at making predictions, but today I’ll give a pessimistic take on inflation which suggests the Fed (and everyone else) should still be concerned about inflation.

The pessimistic take can be summarized in two charts. First, this chart shows the year-over-year change in the core PCE inflation index. As most readers will know, core indexes take out food and energy prices. This is not a “cheat” to mask important goods, it’s done because these are particularly volatile categories of goods. If we want to see the true underlying trend in inflation, we should ignore price fluctuations that are driven largely by weather and geopolitics.

While there is some moderation in inflation in this chart, we don’t see anything like the dramatic decline in the CPI-U, which fell from about 9 to 3 percent over roughly the past year. True, there is some decline over the past year, but only about 1 percentage point, and it has been stuck at just over 4.6 percent for the past 6 months. This is not a return to normalcy, as this rate historically has stayed in the band of 1-2 percent.

The second pessimistic chart is M2, a broad measure of the money supply.

The dramatic increase in M2 during 2020 is clear. That’s a big source of the inflation issues we’ve had over the past 2 years. There is some cause for optimism in this chart: M2 has clearly shrunk from the peak in Spring 2022. In fact, using a year-over-year percentage change, M2 has been negative since last November.

But if we look very recently, there is less cause for optimism. Since late April, M2 has stopped falling. In fact, it’s up a little bit. Is this a sign that the Fed doesn’t really have inflation under control? Perhaps. The increase isn’t huge, and there’s always some seasonality and noise to this data so we shouldn’t overanalyze this small deviation from the general decline in the past year plus. But we’ll need to continue watching this data.

Is this the peak of inflation?

I think so, though the path back to 2% is a long one. Two months ago I wrote that “the Fed is still under-reacting to inflation“. We’ve had an eventful two months since; last Friday the BLS announced CPI prices rose 1% just in May, and that:

The all items index increased 8.6 percent for the 12 months ending May, the largest 12-month increase since the period ending December 1981

Then this Wednesday the Fed announced they were raising interest rates by 0.75%, the biggest increase since 1994, despite having said after their last meeting that they weren’t considering increases above 0.5%. I don’t like their communications strategy, but I do like their actions this month. This change in the Fed’s stance is one reason I think we’re at or near the peak.

Its not just what the Fed did this week, its the change in their plans going forward. As of April, the Fed said the Fed Funds rate would be 1.75% in December, and markets thought it would be 2.5%. But now the Fed and markets both project 3.5% rates in December.

The other reason I’m optimistic is that the days of rapid money supply growth continue to get further behind us. From March to May 2020, the M2 and M3 supply exploded, growing at the fastest pace in at least 40 years:

Rapid inflation began about 12 months later. But the rate of money supply growth peaked in February 2021, then began a rapid decline. Based on the latest data from April 2022, money supply growth is down to 8%, a bit high but finally back to a normal range. Money supply changes famously influence prices with “long and variable lags”, so its hard to call the top precisely. But the fact that we’re now 15 months past the peak of money supply growth (and have stable monetary velocity) is encouraging. Old-fashioned money supply is the same indicator that led Lars Christiansen to predict this high inflation in April 2021 after successfully predicting low inflation post-2009 (many people got one of those calls right, but very few got both).

Stocks also entered an official bear market this week (down 20% from highs), which is both a sign of excess money no longer pumping up markets, and a cause of lower demand going forward.

Markets seem to agree with my update: 5-year breakevens have fallen from a high of 3.6% back in March down to 2.9% today, implying 2.9% average inflation over the next 5 years. Much improved, though as I said at the top the path to 2% will be a long one- think years, not months. Even the Fed expects inflation to be over 5% at the end of this year, and for it to fall only to 2.6% next year.

What am I still worried about? The Producer Price Index is still growing at 20%. The Fed is raising rates quickly now but their balance sheet is still over twice its pre-Covid level and is shrinking very slowly. The Russia-Ukraine war drags on, keeping oil and gas prices high, and we likely still have yet to see its full impact on food prices. Making good predictions is hard.

While I’m sticking my neck out, I’ll make one more prediction, though this one is easier- Dems are in for a bad time in November. A new president’s party generally does badly at his first midterm, as in 2018 and 2010. But this time the economy will be a huge drag on top of that. November is late enough that the real economy will be notably slowed by the Fed’s inflation-fighting effects, but not so late that inflation will be under control (I expect it to be lower than today but still above 5%). Markets currently predict a 75% chance that Republicans take the House and Senate in November, and if anything that seems low to me.