All of us have assets. Together, they experience some average rate of return and the value of our assets changes over time. Maybe you have an idea of what assets you want to hold. But how much of your portfolio should be composed of each? As a matter of finance, we know that not only do the asset returns and volatilities differ, but that diversification can allow us to choose from a menu of risk & reward combinations. This post exemplifies the point.
1) Describe the Assets
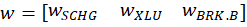
I analyze 3 stocks from August 1, 2024 through August 1, 2025: SCHG (Schwab Growth ETF), XLU (Utility ETF), and BRK.B (Berkshire Hathaway). Over this period, each asset has an average return, a variance, and co-variances of daily returns. The returns can be listed in their own matrix. The covariances are in a matrix with the variances on the diagonal.
The return of the portfolio that is composed of these three stocks is merely the weighted average of the returns. In particular, each return is weighted by the proportion of value that it initially composes in the portfolio. Since daily returns are somewhat correlated, the variance of the daily portfolio returns is not merely equal to the average weighted variances. Stock prices sometimes increase and decrease together, rather than independently.
Since the covariance matrix of returns and the covariance matrix are given, it’s just our job to determine the optimal weights. What does “optimal” mean? This is where financiers fall back onto the language of risk appetite. That’s hard to express in a vacuum. It’s easier, however, if we have a menu of options. Humans are pretty bad at identifying objective details about things. But we are really good at identifying differences between things. So, if we can create a menu of risk-reward combinations, then we’re better able to see how much a bit of reward costs us.
2) Create the Menu
In our simple example of three assets, we have three weights to determine. The weights must sum to one and we’ll limit ourselves to 1% increments. It turns out that this is a finite list. If our portfolio includes 0% SCHG, then the remaining two weights sum to 100%. There are 101 possible pairs that achieve that: (0%, 100%), (1%,99%), (2%,98%), etc. Then, we can increase the weight on SCHG to 1% for which there are 100 possible pairs of the remaining weights: (0%,99%), (1%, 98%), (2%, 97%), etc. We can iterate this process until the SCHG weight reaches 100%. The total number of weight combinations is 5,151. That means that there are 5,151 different possible portfolio returns and variances. The below figure plots each resulting variance-return pair in red.
To say Warren Buffett is not a fan of gold would be an understatement. His basic beef is that gold does not produce much of practical value. His instincts have always been to buy businesses that generate steady and growing cash by producing goods or services that people need or want – – businesses like railroads, beverage makers, and insurance companies.
Here are some quotes on the subject from the Oracle of Omaha, where I have bolded some phrases:
“Gold … has two significant shortcomings, being neither of much use nor procreative. True, gold has some industrial and decorative utility, but the demand for these purposes is both limited and incapable of soaking up new production. Meanwhile, if you own one ounce of gold for an eternity, you will still own one ounce at its end” — Buffett, letter to shareholders, 2011
“With an asset like gold, for example, you know, basically gold is a way of going long on fear, and it’s been a pretty good way of going long on fear from time to time. But you really have to hope people become more afraid in the year or two years than they are now. And if they become more afraid you make money, if they become less afraid you lose money. But the gold itself doesn’t produce anything” — Buffett, CNBC’s Squawk Box, 2011
This from when the world’s 67-cubic foot total gold hoard was worth about $7 trillion, which by his reckoning was the value of all U.S. farmland plus seven times the value of petroleum giant ExxonMobil plus an extra $1 trillion:
“And if you offered me the choice of looking at some 67-foot cube of gold … and the alternative to that was to have all the farmland of the country, everything, cotton, corn, soybeans, seven ExxonMobils. Just think of that. Add $1 trillion of walking around money. I, you know, maybe call me crazy but I’ll take the farmland and the ExxonMobils” – – Cited in https://www.nasdaq.com/articles/3-things-warren-buffett-has-said-about-gold
And my favorite:
“Gold gets dug out of the ground in Africa, or someplace. Then we melt it down, dig another hole, bury it again and pay people to stand around guarding it. It has no utility. Anyone watching from Mars would be scratching their head“. – – From speech at Harvard, see https://quoteinvestigator.com/2013/05/25/bury-gold/
One thing Buffett did NOT say is that gold is “barbarous relic”. That line is owned by John Maynard Keynes from a hundred years ago, referring to the notion of tying national money issuance to the number of bars of gold held in the national vaults:
“In truth, the gold standard is already a barbarous relic. All of us, from the Governor of the Bank of England downwards, are now primarily interested in preserving the stability of business, prices, and employment, and are not likely, when the choice is forced on us, deliberately to sacrifice these to outworn dogma, which had its value once” – Monetary Reform (1924)
Has Buffett’s Berkshire Hathaway Beaten Gold as an Investment?
Given all that trash talk from the legendary investor, let’s see how an investment in his flagship Berkshire Hathaway company (stock symbol BRK.B) compares to gold over various time periods. I will use the ETF GLD as a proxy for gold, and will include the S&P 500 index as a proxy for the general U.S. large cap stock market.
As always, these comparisons depend on your starting and ending points. In the 1990s and 2000s, BRK.B hugely outperformed the S&P 500, cementing Buffett’s reputation as one of the greatest investors of all time. (GLD data doesn’t go back that far). In the past twelve months, gold (up 41%) has soundly beaten SPY (up 14 %) and completely trounced BRK.A (up 9%), as of last week. A couple of one-off factors have gone into these results: Gold had an enormous surge in January-April as the world markets digested the implications of never-ending gigantic U.S. budget deficits, and the markets soured on BRK.A due to the announced upcoming retirement of Buffett himself.
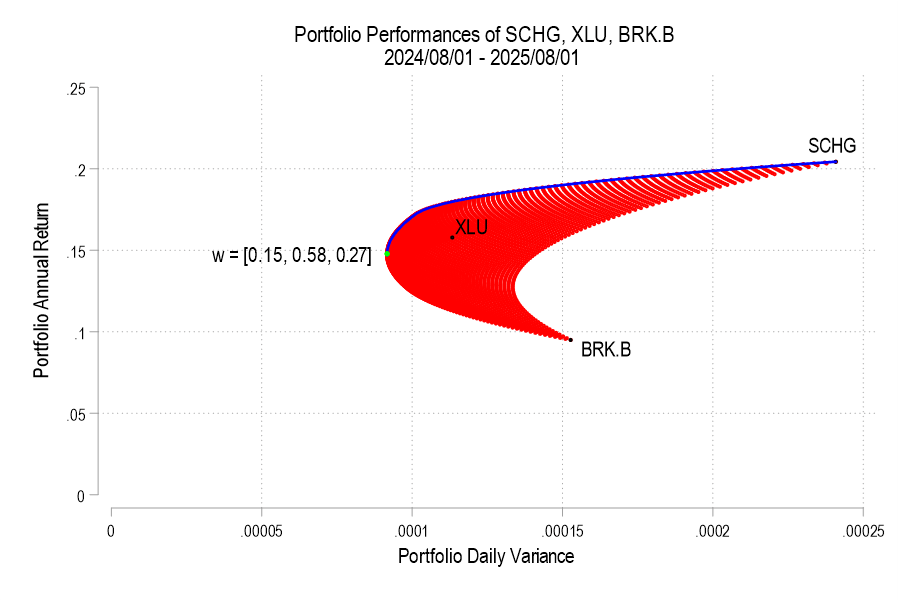
Stepping back to look over the past ten years shows the old master still coming out on top. In this plot, gold is orange, S&P 500 is blue, and BRK.A is royal purple:
Over most of this time period (through 7/21/2025), BRK.A and SP500 were pretty close, and gold lagged significantly. Gold was notably left behind during the key stock surge of 2021. Even with the rise in gold and dip in BRK.A this year, Buffett’s company (up 232%) still beats gold (198%) over the past ten years. BRK.A pulled well ahead of SP500 during the 2022 correction, and never gave back that lead. In the April stock market panic this year, BRK.A actually went up as everything else dropped, as it was seen as a tariff-proof safe haven. SP500 was ahead of gold for nearly all this period, until the crash in stocks and the surge in gold in the first half of 2025 brought them to essentially a tie for the past decade.
For what it’s worth, I will pass along a couple of points from an optimistic take on the current stock market pullback, by Seeking Alpha author Dividend Sensei. The article is “History Says Shut Up And Buy: 12 Hyper-Growth Blue Chips To Buy Right Now”. His thesis is that corrections come and go as specific fears come and go, but tech stocks only keep going up, so now is a good time to buy.
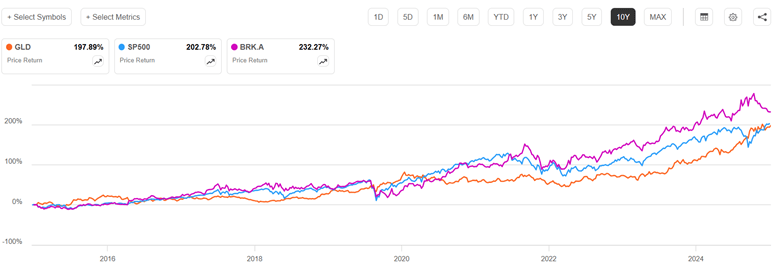
History seems to be on his side. Below is a 25-year plot of the NASDAQ 100 fund QQQ. It is true that on a really long scale, any significant dip would have been a good buying opportunity. And the run-up since 2016 has been astonishing. $10,000 invested then would be about $50,000 now. I find it sobering, however, that (just going by eyeball) it took about fourteen years for QQQ to regain its 2000 peak. That might be longer than most investors want to wait. And in the shorter term, these tech stocks lost some 80% of their market value between 2000 and 2002, and revisited that low in 2008. We can look back now from decades later and call this a “dip”, but at the time it felt like an endless investment nightmare.
(I should add that the 2000 peak pricing was not supported by appreciable cash earnings, but by breathless hype about this new thing called the “internet” that was going to change EVERYTHING. This past year has seen similar hyperventilation over AI, but in contrast to 2000, now the big tech firms make ginormous gobs of money, and gobs more each year. So maybe it really is different this time…)
QQQ total return since March 1, 1999; % scale. From Seeking Alpha.
The Psychology of Market Corrections
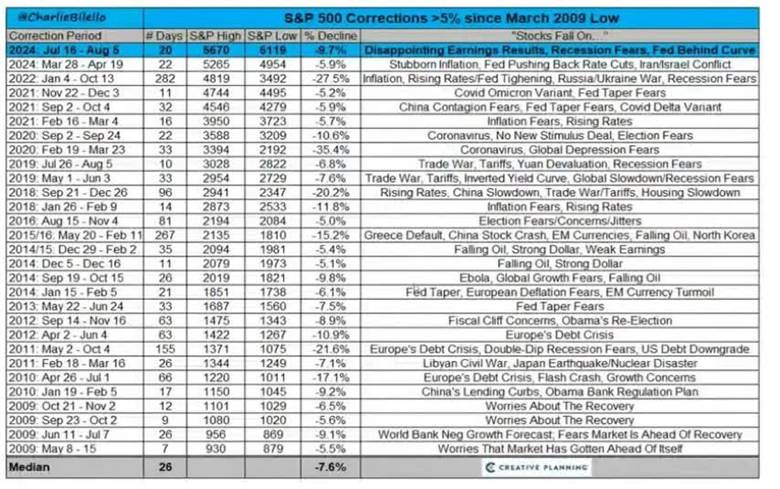
The author pointed out that every correction is based on some deep fear, and eventually that fear dissipates. I thought this table he showed of the fear factors involved in the 30 or so stock market pullbacks since the March 2009 low was interesting and instructive:
The type here may be hard to read, so I will repeat here the two most recent “fears” listed, both from 2024:
March 28-Apr 19 (5.9% drop): “Stubborn Inflation, Fed Pushing Back Rate Cuts, Iran/Israel Conflict”
These are recent enough that any market-engaged reader here will resonate with these concerns which loomed so large at the time. And yet, the collective market shrugged them all off to post a robust 21% gain for all of 2024.
Where do we go from here? I have no idea. As of writing this Tuesday morning, we seem to be bumping along at a level 2-3% higher in QQQ than the lows last week, but still 10-11 % lower than a month ago. This has brought it to levels of about late September, 2024. If I look at a five-year log plot and draw an eyeball-fit straight line through it all, it seems like prices went above that line for Nov-early Feb, in a burst of post-election enthusiasm, but have now come back to the trendline. Barring some macro or geopolitical disaster, therefore, one might expect QQQ to trend 10-15 % higher in the next twelve months (with a standard deviation of another 10% or so around the trendline). But as old-time Yankees catcher Yogi Berra said, “It’s tough to make predictions, especially about the future.”
Disclaimer: Nothing here should be considered advice to buy or sell any security.
As of the market open today, tech stocks (e.g. the NASDAQ 100 fund QQQ) are down more than 10% from their recent highs. The broader S&P 500 fund SPY is down about 8%. Hands are wringing…what does it all mean?
By applying standard definitions, we can know exactly what it means:
A pullback is a market drop of 5-10% and is very short term. It is a dip from a recent high during an ongoing bull market while upward momentum is still intact, and is a normal adjustment to a market cycle.
The market is in “correction phase” after a drop between 10-20% and can last a few months. These moves are typically met with higher volatility. Corrections can be violent as investors’ fear levels rise and panic selling may hit the market.
Real time news and social media can intensify this fear as investors may follow the herd mentality. The average market correction lasts anywhere between two and four months and is frequently accompanied by adverse market conditions. However, corrections are often seen as ideal times to buy high-value stocks at discounted prices.
So, technically, the S&P has experienced a “pullback”, while the NASDAQ 100 has undergone a “correction”. Just to round out the infernal trinity of market moves with a definition of a “bear market”:
A bear market occurs after a drop of 20+% over at least a two-month time frame. In a bear market, investor confidence has been shattered and many investors will sell their stocks for fear of further losses. Trading activity tends to decrease as do dividend yields.
Bear markets tend to become vicious cycles when rallies are sold and not bought This happened in 2000 and 2007 and can typically be seen on charts as the market makes lower lows and lower highs. Bear markets tend to occur in the contraction phase of the business cycle and last, on average, approximately 16 months.
You don’t know if you are really in a bear market until things get really bad, at which point it is probably too late to sell. (Amateurs get discouraged and sell AFTER stocks have dropped, which is why the average investor does appreciably worse than the accounts of dead people where stocks just sit there without being traded). When stocks recover at least 20% following a bear market over at least a two-month period, that is defined as the start of a new bull market regime.
Having a correction (i.e. 10-20% dip) in the middle of a bull market year is pretty normal. Although whole-year market returns have been positive for 34 out of the past 45 years, the typical year experiences a correction averaging 14%.
None of this vocabulary clarification answers the practical question of how bad will the current pullback/correction get? As usual, I read argument on both sides. The bears are saying (a) what they have been saying since 2018 or so, that the market is unrealistically overvalued, and (b) the macroeconomic world is about to fall apart, which they have also been saying for years. This time may be different, with the new administration’s erratic policies, but history shows that so far, the market is not much correlated to who is in the West Wing.
The bulls are saying (a) the market values did get run up unrealistically after the election and with AI hype, so the current pullback is just a healthy reset to a level for resuming further market growth, and (b) despite negative talking, the actual numbers show decent employment and GDP, so macro is OK (and it is very rare to have an actual bear market absent a serious bad macroeconomic driver).
If I really knew the answer here, I would be writing this from my private Caribbean island. But I’ll share how I am playing it. For the past 15 years or so, it has nearly always worked well to buy in after a say 10% correction. What seemed so gut-wrenching and scary at the time almost always turns into just a blip on the endlessly rising market charts in hindsight.
I had set aside some “dry powder” funds specifically to take advantage of buying opportunities like now. So, I am manfully mastering my fears and buying small amounts every couple days of 2X levered funds like SSO and QLD. (See here for discussion of such funds, they go up or down $2 for every $1 the underlying S&P or NASDAQ go up or down, so it’s kind of like being able to buy twice as much stock for the same dollar amount. But as usual, caveat emptor).
But I am not going all-in on any particular day. It is always frustrating to miss buying right at the bottom, but nobody rings a bell there, either. I have searing memories of March 2020 and of 2008 when just when you thought the bottom was in, it dropped out the next day or week.
Disclaimer: Nothing here should be considered advice to buy or sell any security.
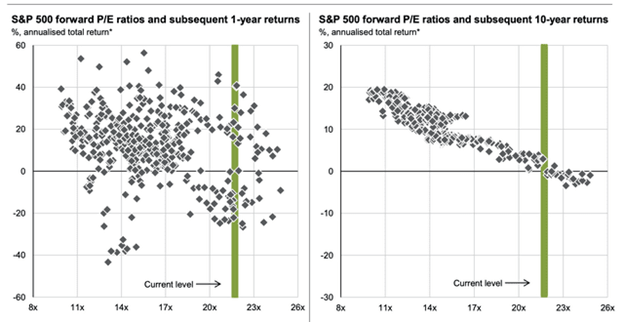
The left-hand side shows that there is very little correlation between the current forward P/E ratio and the returns in the next year; as we have seen in the past few years, and canonically in say 1995-1999, market euphoria can commonly carry over from one year to the next. (See here for discussion of momentum effect in stock prices). So, on this basis, the current sky-high P/E should give us no concern about returns in the next year.
However, the right-hand side is sobering. It shows a very strong tendency for poor ten-year returns if the current P/E is high. In fact, this chart suggests a ten-year return of near zero, starting with the current market pricing. Various financial institutions are likewise forecasting a decade of muted returns [1].
The classic optimistic-but-naïve response to unwelcome facts like these is to argue, “But this time it’s different.” I am old enough to remember those claims circa 1999-2000 as P/E’s soared to ridiculous heights. Back then, it was “The internet will change EVERYTHING!”. By that, the optimists meant that within a very few years, tech companies would find ways to make huge and ever-growing profits from the internet. Although the internet steadily became a more important part of life, the rapid, huge monetization did not happen, and so the stock market crashed in 2000 and took around ten years to recover.
A big reason for the lack of early monetization was the lack of exclusive “moats” around the early internet businesses. Pets.com was doomed from the start, because anyone could also slap together a competing site to sell dog food over the internet. The companies that are now reaping huge profits from the internet are those like Google and Meta (Facebook) and Amazon that have established quasi-monopolies in their niches.
The current mantra is, “Artificial intelligence will change EVERYTHING!” It is interesting to note that the same challenge to monetization is evident. ChatGPT cannot make a profit because customers are not willing to pay big for its chatbot, when there are multiple competing chatbots giving away their services for practically free. Again, no moat, at least at this level of AI. (If Zuck succeeds in developing agentic AI that can displace expensive software engineers, companies may pay Meta bigly for the glorious ability to lay off their employees).
My reaction to this dire ten-year prognostication is two-fold. First, I have a relatively high fraction of my portfolio in securities which simply pump out cash. I have written about these here and here. With these investments, I don’t much care what stock prices do, since I am not relying on some greater fool to pay me a higher price for my shares than I paid. All I care is that those dividends keep rolling in.
My other reaction is…this time it may be different (!), for the following reason: a huge fraction of the S&P 500 valuation is now occupied by the big tech companies. Unlike in 2000, these companies are actually making money, gobs of money, and more money every year. It is common, and indeed rational, to value (on a P/E basis) firms with growing profits more highly than firms with stagnant earnings. Yes, Nvidia has a really high P/E of 43, but its price to earnings-growth (PEG) ratio is about 1.2, which is actually pretty low for a growth company.
So, with a reasonable chunk of my portfolio, I will continue to party like it’s 1999.
[1] Here is a blurb from the Llama 3.1 chatbot offered for free in my Brave browser, summarizing the muted market outlook:
Financial institutions are forecasting lower stock market returns over the next decade compared to recent historical performance. According to Schwab’s 2025 Long-Term Capital Market Expectations, U.S. large cap equities are expected to deliver annualized returns of 6% over the next decade, while international developed market equities are projected to slightly outperform at 7.1%.1 However, Goldman Sachs predicts a more modest outlook, with the S&P 500 expected to return around 3% annually over the next decade, within a range of –1% and 7%.42 Vanguard’s forecasts also indicate a decline in expected returns, with U.S. equities falling to a range of 2.8% to 4.8% annually. These forecasts suggest that investors may face a period of lower returns compared to the past decade’s 13% annualized total return.
It seems to be an accepted fact that there is a momentum effect with stock prices: a stock which has done well over the past 6-12 months is likely to continue to do better than average over the next six months or so. A number of funds (ETFs) have been devised which try to take advantage of this factor.
On the other hand, sometimes trends reverse, and stock that was hot twelve months ago has now run up in price, and may be due for a pause.
Here we will compare several momentum ETFs against the plain S&P 500 fund, SPY. In order to make it an apples-to-apples comparison, I am looking mainly at momentum funds that primarily draw from the S&P 500 large cap universe of stocks, excluding small-cap or tech only funds. [1] These large cap momentum funds are MTUM, JMOM, and SPMO. These funds all select stocks according to various rules. Besides trying to identify stocks with raw price momentum, these rules typically aim to minimize risk or volatility. I added one outlier, GMOM, that is very diversified. This fund does not hold individual stocks. Rather, it draws on some 50 different ETFs, including funds that focus on fixed income, commodities, or international or small cap as well as large cap US stocks, seeking to hold funds that show good relative momentum.
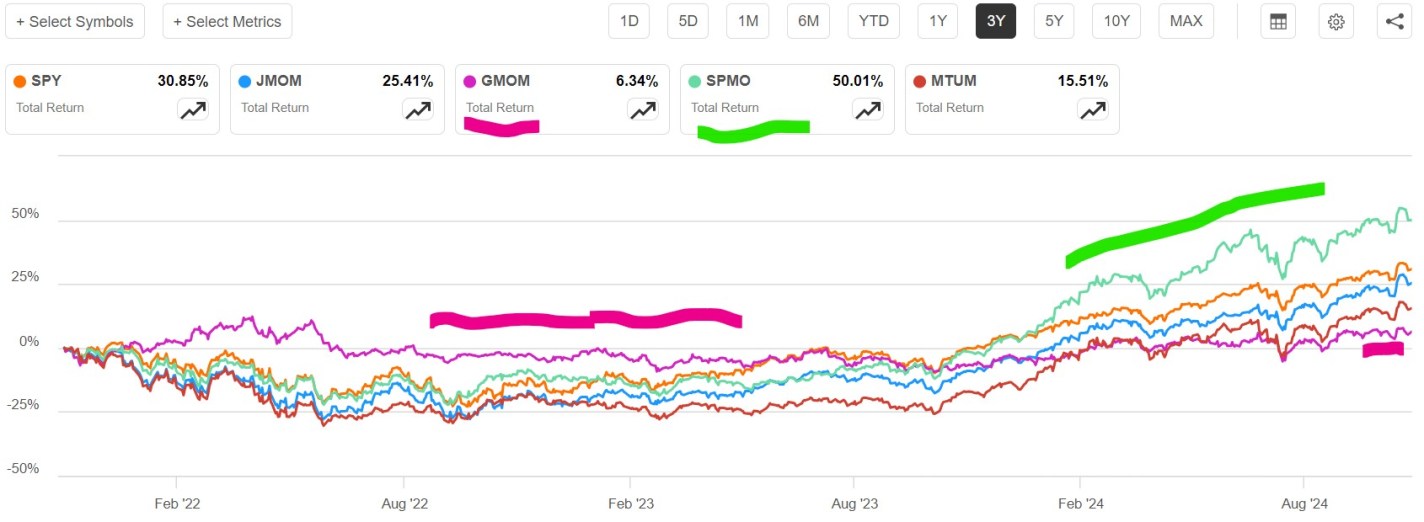
A plot of total returns over the past three years for these funds is shown below. It can be seen that plain SPY (orange line) beat all of the momentum funds except for SPMO (green line) in this timeframe. This is partly explained by the fact that SPY itself is a sort of momentum fund: the more a given stock’s price goes up, the bigger its representation in this capital-weighted fund. Also, over the past ten years or so, simply the biggest companies (the big tech quasi-monopolies like Google, Microsoft, etc.) have been generating more and more earnings, leaving the traditional auto and oil companies and banks, etc., in the dust.
By not focusing on U.S. large cap stocks, the diversified GMOM (marked with purple highlighter line) is less volatile. Its price did not drop nearly as much as the other funds in 2022, but it missed out on the great 2023-2024 stock run-up. SPMO (marked with green highlighter) really took off in that 2023-2024 big tech fiesta, by virtue of being concentrated in stocks like Nvidia, which went up roughly 10X in this timeframe. But this outperformance may be something of a one-off lucky strike. SPMO is still about the best of the momo funds, normally at least keeping up with SPY, but it does not consistently outperform it.
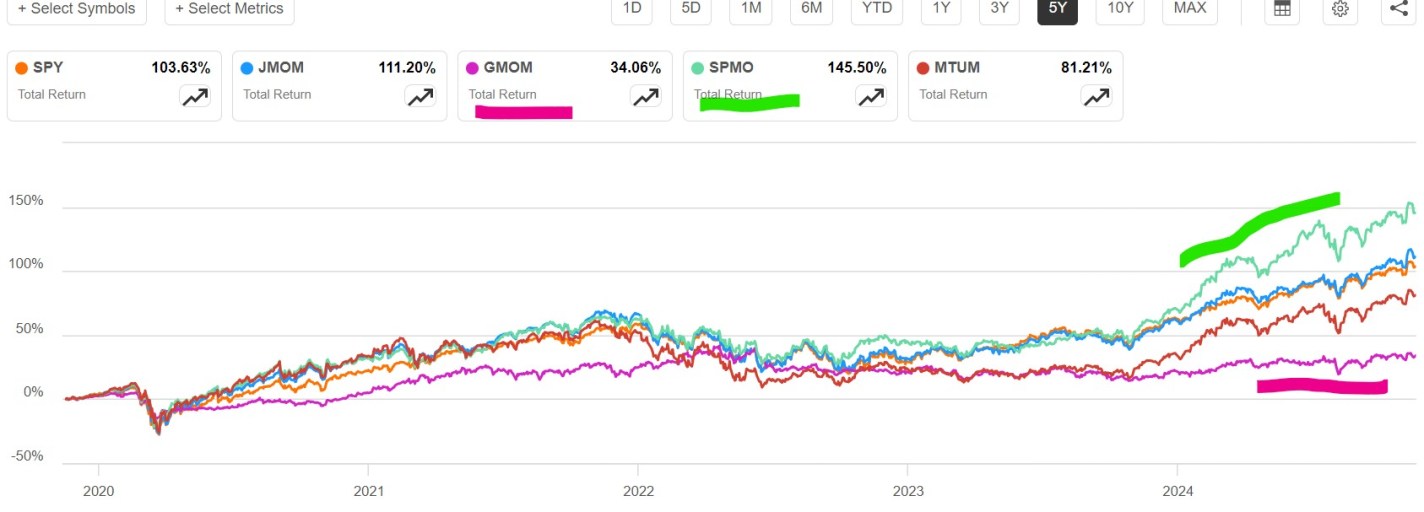
The five-year plot below illustrates similar trends, though it is a bit harder to read. Again, SPMO (green highlighter) largely keeps up with SPY, with a big outperformance spurt at the end. And GMOM is pretty flat; that really hurt it in the big 2020-2021 runup of big tech stocks. Over this five-year timeframe, JMOM kept up with SPY, and actually edged a bit ahead. MTUM, like most of the stock momo funds, actually ran ahead of SPY in the 2020-2021 runup, but fell somewhat more in 2022, and then got left in the dust in 2023. It is likely that it fell prey to trend reversal, which is a constant hazard for momentum funds. For most of 2022, the “best” stocks were dull value stocks, while tech stocks did terribly. Thus, a plain momentum algo fund would come into 2023 loaded with non-tech stocks. I suspect that is what happened to MTUM.
It happens that the SPMO algo has features that try to protect it from loading up on non-growth stocks during a bear market. So, it seems to be the best general momentum stock fund. It selects stocks which have shown positive momentum over the past twelve months, with the most recent month excluded (so as not to discriminate against a stock which had a temporary drop). Its chief vulnerability is that it only updates its holdings once every six months (mid-March and mid-September), so it is often acting on very old information. (Supposedly, it is better to update a momentum fund every three months).
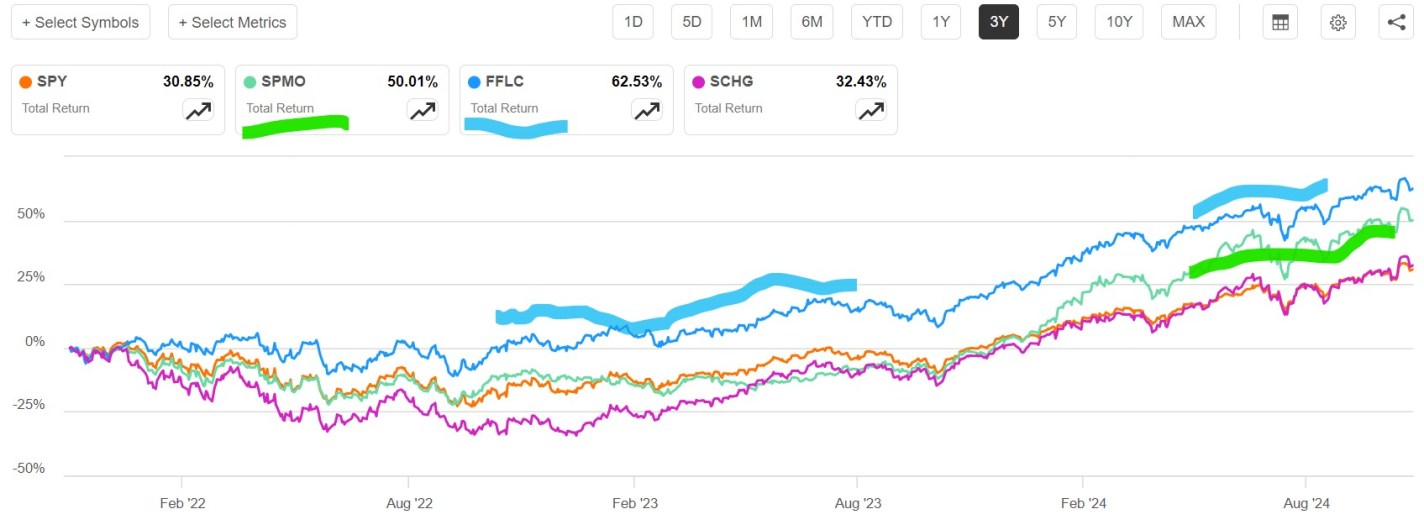
How does SPMO compare to a top actively-managed fund like FFLC or plain growth stock fund SCHG? The three-year plot below shows that FFLC (blue line, 63% total return) beat SPMO (green line, 50% return). Although SPMO had an impressive surge in the past year, FFLC just kept steadily outperforming SPY over the whole three-year period. This suggests that having good human judgement at the helm, able to adapt to differing market environments (2022 bear vs. 2023-2024 tech bull) can do better than a single, focused algorithm. I prefer a fund which keeps steadily outperforming “the market” (i.e., S&P 500) rather than one which only occasionally has moments of glory, so I hold more FFLC than SPMO.
In the plot above, the growth fund SCHG suffered more in 2022 when the tech high-flyers fell to earth, but made up for it in 2023-2024, to end up matching SPY over three years. On longer time-frames, SCHG handily beats SPY, as we noted in an earlier article on growth stocks.
[1] See this Insider Monkey article for a listing of ten best U.S. stock momentum funds. Some of these focus on small cap, mid cap, or technology stocks.
Will Growth Stocks Continue to Trounce Value Stocks?
It’s no secret that growth stocks, mainly big tech companies like Apple and Microsoft, have massively out-performed so-called value stocks in the past fifteen years. Value stocks tend to have lower price/earnings and steady earnings and low price/earnings. They include sectors such as petroleum, utilities, traditional banks, and consumer products. These companies often pay substantial dividends from their cash flow.
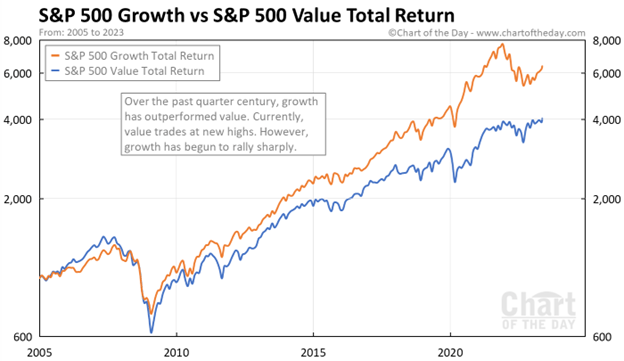
Here are some charts which make the point. This 2005-early 2023 chart shows value stocks (blue curve) having a small edge 2005-2008, then the growth stocks (orange curve) keep ripping higher and higher. Financial stocks, which mainly fall in the value category, were hit particularly hard in the 2008-2009 downturn.
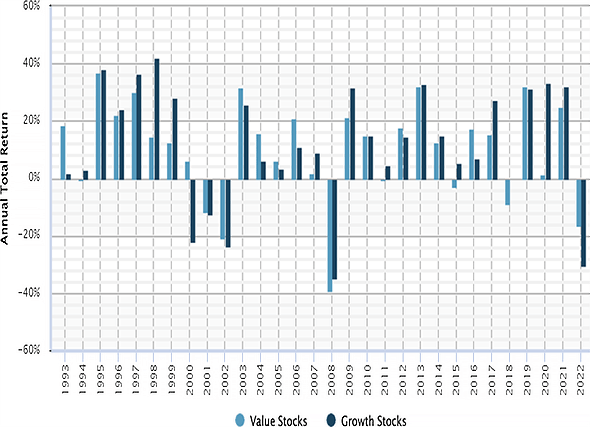
Here is a bar chart display of annual returns of value stocks (blue bars) and of growth stocks for the years 1993-2022. In 1997-1999 growth stocks outperformed. This was the great tech bubble – I remember it well, investors were shoveling money into any enterprise with a customer-facing website, whether or not there was any reasonable path to profitability. Reality caught up in 2000 (“What was I thinking??”), tech stock prices crashed and then tech was hated for a couple of years. But by 2009 or so, today’s big tech firms had emerged and established their quasi-monopolies, and started actually making money and even more money.
So, is the answer to just allocate all your equity portfolio to big tech and walk away? This is a question I have been asking myself. Even as growth stocks dominate year after year, there have continued to be voices warning that this is anomaly; historically, value stocks have performed better. So, with the sky-high valuations of today’s big tech, there is due to be a big mean reversion where the “Magnificent 7” get crushed, and Big Banks and Big Oil and Proctor & Gamble and even humble utilities finally get to shine.
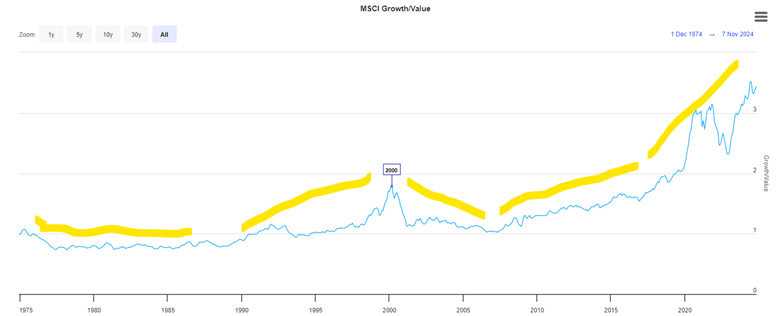
I don’t have a chart that goes that far back, but I have read that over the past 100 years, value has usually beat “growth”. Here is a hard-to-read plot of value vs growth for 1975-2024. I have added yellow highlighter lines to mark major trend periods. Growth underperformed 1975-1990, then growth picked up steam and culminated in the peak in the middle of the chart at 2000. Growth then underperformed 2000-2008, as noted earlier, as the excesses of the tech bubble were unwound, and people made paper fortunes in the real estate bubble of 2001-2007.
Growth has dominated since 2009, excerpt for 2022. That was the year the Fed raised interest rates, which tends to punish growth stocks. However, with their unstoppable increases in earnings (accounting for the vast majority of the earnings in the whole S&P 500), big tech has come roaring back. Yes, they sport high P/E ratios, but they have the earnings and the growth to largely justify their high valuations.
I have been influenced by the continual cautions about growth stocks becoming overvalued. Many an expert has advocated for value stocks. In June of this year, Bank of America head of US equity strategy Savita Subramanian told an audience at the Morningstar Investment Conference: “I have one message to you: Buy large-cap value.” So, for the past couple of years, I have gone relatively light on big tech and have over-allocated to “safer” investments like fixed income and value stocks. Silly me.
In the last few months, I finally decided to give up fighting the dominant trend, and so I put some funds into SCHG, which is specifically large cap growth, and in other growth-heavy funds. As you may imagine, these funds are loaded with Nvidia and Meta and other big tech. They have done very well since then.
How about going forward? Will the growth dominance continue, or will the dreaded mean reversion strike at last? At some point, I suspect that big tech earnings will slow down to where their high valuations can no longer be supported. But I don’t know when that will be, so I will just stay diversified.
Boilerplate disclaimer: Nothing here should be taken as advice to buy or sell any security.
For many people nowadays, investing in “stocks” means buying a fund like SPY or VOO which tracks the large cap S&P 500 index, or maybe QQQ or QQQM which track the tech-heavy NASDAQ 100 index. These types of funds are exchange-traded funds (ETFs), which very low annual fees (around 0.2% or so). These are so-called passive funds, which mechanically buy and sell stocks such that their holdings match what is in their respective indices. No extra judgment on stock picking is required.
An alternative is to pick stocks yourself, or to buy into a fund with active management, where humans (and their algorithms) try to buy stocks which will beat the passive indices, and try to avoid losing stocks. The active versus passive debate has been going on for decades. There will always be some active funds that outperform in any given year. These successes help keep the allure of active management alive. On average, though, the performance of active funds (before fees) is generally not much different than the passive funds. Thus, with their added fees, the active funds are net losers.
However, there are always cheerful fund managers with a story on how they have a plan to kill it this year, and there are investors willing to buy those stories. Sometimes these fund managers take financial advisors out for expensive lunches, and, behold, said advisors then recommend these actively managed funds to their clients. And so, there are plenty of active funds that still exist. New ones are minted every year, even as some older ones go out of business.
A problem with benchmarking against a cap-weighted fund like SPY or QQQ is that these passive indices are actually very effective. These work as closet momentum-rewarding funds: as the share price of, say, Microsoft goes up and up (presumably because of accelerating earnings), its representation among the biggest 500 companies (by stock capitalization) goes up. Thus, the better, growing companies automatically keep making bigger contributions to the indices, while fading companies sink to lower and lower per cent weighting. That works well to relentlessly home in on the relatively few stocks that account for the gains of the entire market, and to weed down all those other firms, most of which are net losers on stock price over time. This algorithm governing the cap weighted funds is tough for active management to beat.
Having stated these challenges, I’d like to compare performance of some actively-managed funds that have shown enhanced performance in recent years. The problem is, of course, we cannot know if this outperformance will continue. But hopefully looking at performance and discussing the underlying strategies of the funds may help investors decide if they would like to participate in any of them.
Two broad categories of stock funds are growth and value. Growth looks at how fast a firm is increasing revenues, earnings, etc. Most tech stocks command high share prices because of their growth prospects, rather than current earnings (although many of the current big tech leaders generate gobs of cash). Value looks at measures such as price/earnings and price/sales and price/book value, hoping to find undervalued firms whose price does not yet reflect the underlying value. Tech funds are generally under-represented in the value category.
Here we will look at five good actively-managed ETFs, and compare total returns (with dividends reinvested) to the S&P 500 fund SPY. They all claim to incorporate both growth and value into their stock picking. These five funds are:
SPGP – This is a supposed “growth at a reasonable price” fund, which seems to weight value more than growth. In top ten holdings, there is only one tech stock, a 2.7% weighting of Nvidia. There are four petroleum companies, and diverse smattering of other types of firms.
GARP – Another “growth at a reasonable price” (note “G.A.R.P.”) fund. This tilts heavily toward growth: seven of the top ten holdings are tech, with 5.43% Nvidia.
PVAL – As indicated in the name (Putnam Focused Large Cap Value), this is a value fund, but with some growth considerations – – The top ten are: Walmart (retail), Exxon Mobil (petro), Thermo Fisher Scientific, Citigroup, Bank of America (finance), Oracle (tech), UnitedHealth Group (healthcare), Coca-Cola, NXP Semiconductors, and PulteGroup (homebuilder).
MOAT – – “VanEck Morningstar Wide Moat” – This fund seeks to replicate the performance of the Morningstar® Wide Moat Focus Index, which in turn tries to identify a diverse group of U.S. large companies with wide “moats”, that give them sustainable advantages over competitors. Four measures are used to determine a corporation’s dominance: Intangible Assets (brands, patents, proprietary technologies); Switching Costs (inconvenient for the customer to find an alternative); Network Effect (when customers use one service, they adopt additional company services); Cost Advantage.
FFLC – This fund uses “fundamental analysis” and looks for companies that can take advantage of trends in “technological advances, product innovation, economic plans, demographics, social attitudes, and other factors”. An analysis of the fund’s holdings (heavy in big tech; 6% Nvidia) shows a strong focus on growth and momentum, with a moderate value weighting.
All these funds have plausible rationales for choosing the stocks they do. A big question is always: how much of a company’s promise is already reflected in its stock price? If everyone else has already figured out that, say, Microsoft will have high sustained earnings growth, then maybe the current share price is so high that it will not go up any faster than the broad market.
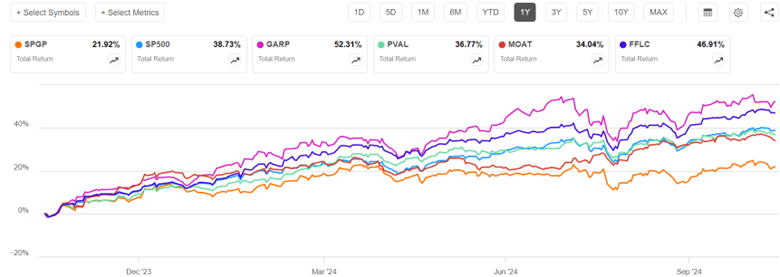
Now for the charts. I will discuss 1-year, 3-year, and 5-year charts, so we can see how the fund strategies worked in different market regimes. The one-year chart covers the raging bull market of the past twelve months, especially in AI-related tech/growth stocks. The 3-year chart encompasses a lengthy bear episode that occupied most of 2022, in reaction to the raising of interest rates to tamp down inflation. The 5-year chart includes the brief but sharp pandemic panic March-April 2020, sandwiched in a huge rise in internet-related big tech stocks 2019-2021.
One-Year Chart
Over the past one year, GARP (52% return) soared way above S&P 500 (blue line, 39%), but with high volatility, consistent with its heavy growth/tech exposure. FFLC steadily pulled ahead of SP500 over the past twelve months, racking up a 47% return. PVAL and MOAT finished close to SP500, while tech-poor SPGP flat-lined in the most recent six months and so got left far behind.
Three-Year Chart (End Oct 2021-end Oct 2024)
The defining features of the past three years were a roughly 21% bear market decline in S&P 500 during Jan-Oct 2022, followed by a strong recovery, which was interrupted by a moderate slump July-Oct 2023. FFLC and PVAL performed nearly identically for the first third of this time period (through early March, 2023). They dropped much less than SP500 in 2022, and so by early March, 2023 they were some 15% ahead of SP500. PVAL’s lead over SP500 shrank a bit over the next twelve months, and then widened March-July 2024, to give PVAL (43%) a 16% advantage over SP500 (27%) at the end of three years. FFLC just kept steadily widening its lead over SP500, ending with a 58% return over this three-year time period. MOAT and SPGP also fell less than SP500 in 2022, but fell more than PVAL and FFLC, and they did not keep pace with the tech-led surge in 2023-2024. In the end, MOAT finished essentially even with SPY, and SPGP finished lower (18%). Tech-heavy GARP crashed harder than SP500 in 2022, but more than made up for it with the 2024 tech-fest, finishing well above SP500 and tied with PVAL at 43%.
I won’t show the full five-year chart, since some of the funds did not start prior to that period. But I will make a few semi-quantitative comments. The five-year time period is a little kinder to SPGP – this fund showed a fairly consistent lead over SP500 in 2021 as well as 2022, and so got rave reviews then in the investing literature. It was only in the past six months that it performed so poorly.
FFLC got off to a rocky start, falling about 10% behind SP500 in 2020-2021, although its winning ways since then gave it the overall best 5-year performance. GARP and MOAT pretty much kept pace with SP500 Oct 2019-Oct 2021, so their five-year performance vs SP500 is about the same as for three-year (GARP soundly beat SP500, MOAT roughly tied).
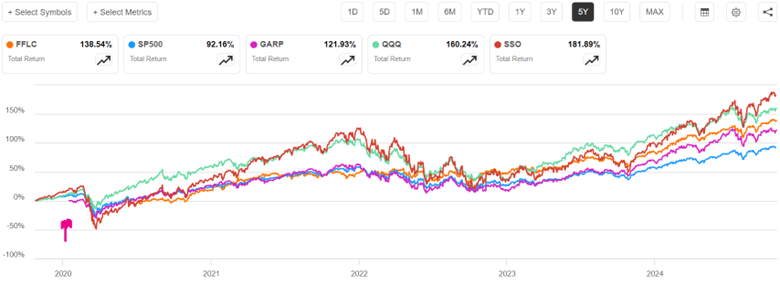
One more chart (below), a five-year comparison of SP500 to FFLC (overall winner among the active funds discussed above) and GARP (tech-heavy) to QQQ (passive, tech-heavy, tracks NASDAQ 100 stocks) and SSO (its stock price moves up and down 2X the daily price movement of S&P500). GARP didn’t start operation till early 2020 (marked by red arrow on chart), to its curve should be shifted up to make a fair comparison with the others; with this correction, it would end up roughly tied with FFLC, with both these funds beating SP500 by about 33% (135% return vs 92%). But even these stellar active funds were soundly beaten by QQQ and even more by the passive 2X fund SSO. Holders of SSO, however, would have suffered heart-stopping drawdowns along the way (e.g. over 50% loss in market value in early 2020).
Readers can draw their own conclusions from this flyover of results. Just like you can fool people some of the time, any active fund may beat “the market” (e.g., S&P 500) some of the time. Some active funds seem to beat the market most of the time. But it is most unlikely that any given fund will beat it all of the time. The S&P 500 algorithm is actually pretty effective. It may behoove the investor to make their own judgement as to what market regime we are in or are about to be in, and to choose active funds which are more likely to thrive in that regime.
I am motivated to include some FFLC (for overall consistent good performance) and PVAL (for a bit of crash protection) in my holdings. But I recognize that their performance could deteriorate in the future, if their investing style no longer works in some new market regime. SPGP is a cautionary example, going from rock star in 2021-2022 to awful in 2024. Even FFLC had an unfavorable first year of operation. The tech giants that dominate QQQ continue to also dominate earnings growth, so QQQ may continue to outpace SP500.
As far as SSO, I earlier wrote on strategies for 2X returns using 2X funds or call options. If you think stocks are going to keep going up, it can make sense to hold these 2X funds. Many advisors, though, recommend against just buy and hold because of the enormous possible losses in a crash; too many investors panic and sell at a low price in that situation. I hold some QLD, which is a 2X QQQ fund, but only as a minor component of my portfolio. Also, if I can overcome fear in the moment, I plan to swap out of plain vanilla stock funds and into a 2X fund like SSO after the next big dip in the market, and then swap back out of SSO after the market recovers.
Disclaimer: Nothing here should be considered advice to buy or sell any security.
I focus much of my investing energy in the “high yield” area, finding stocks that pay out highish yields (8-12%, these days). Unless the company really hits hard times and has to cut its payout, I know I will make those returns over the next twelve months. But with ordinary stocks, you cannot count on any particular returns. The price of any stock a year from now will be the earnings per share (which can be forecasted with some degree of accuracy) times the price/earnings ratio, which is largely dependent on the emotions (“animal spirits”, in the words of Keynes) of the millions of market participants. Will I find a “greater fool” to buy my Amazon stock in a year for 20% more than I paid for it??
I have never gotten really comfortable with that as an investing model, and so I have erred on the side of caution and generally held less than the recommended 60% or so of my portfolio in plain stocks. In hindsight, that was a mistake. Every $10,000 put into the plain, dumb S&P500 fund SPY twenty years ago has turned into roughly $200,000. One reason for my caution has been a steady stream of articles that always warn that stocks are overvalued; after going up so much in the past X years, surely returns will be poor for the next several years.
But I try to learn from my mistakes, and I am now forcing myself to hold more equities than I “feel” like. To support this hopefully rational behavior, I am paying more attention to articles that present bull cases for stocks. One author on the Seeking Alpha investing site who has been consistently and correctly bullish for the past two years is Lawrence Fuller. Here I will summarize his Oct 9 article with the tongue-in-cheek title Be Afraid, Be Very Afraid. (To read articles on Seeking Alpha, you may have to start a free account, where you just have to give them an email address; I use my secondary “junk” email for these sorts of applications, which tend to send a lot of junky (not malicious) notifications).
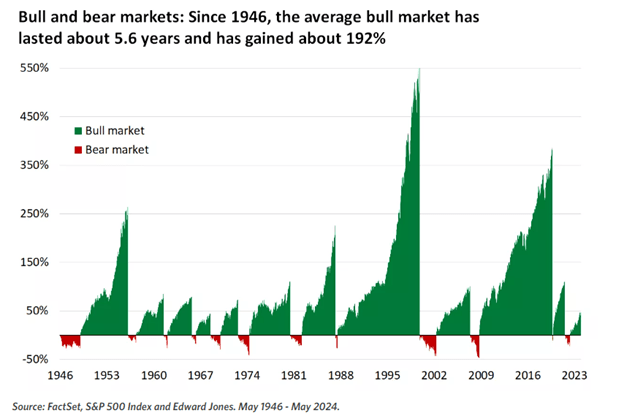
He first addressed the angst that says, “Stocks have already run up so much, they are due for a crash”, by means of this chart showing cumulative returns in preceding bull markets:
It is obvious that, compared to the average bull market, we are still in early innings with the present bull which started in Oct 2022.
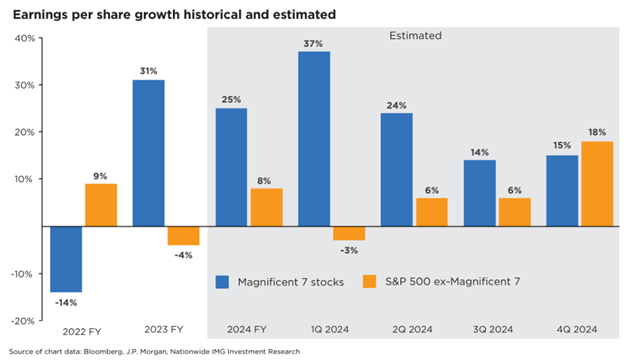
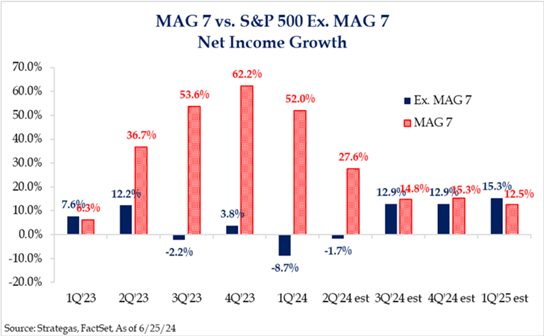
Fuller also makes the case that the good news on earnings has spread recently from the so-called Magnificent Seven big tech stocks (Microsoft, Apple, Nvidia, etc.) to the broader market. This should serve to support further price rises in the broad indices:
The chart below, which shows a similar story, in terms of net income growth:
He concludes:
“It is also important to recognize that the valuation of the S&P 500 is far more reasonable when we exclude the exceedingly expensive Magnificent 7 and focus on the remaining 493. In fact, we don’t have the valuation problem that bears purport we have today. Hence, I advised investors to avoid the market-cap-weighted indexes and focus on equal weight or look at sectors that had been left behind during the bull market to date…Therefore, I suggest not succumbing to fear. Instead, focus on whether the weight of evidence suggests we should be in wealth accumulation mode or wealth preservation mode.”
In a follow-up article, Are You Worried About An Overvalued Market? , Fuller notes that small cap stocks (as defined by the Russel 2000 index, which is held by the IWM fund) are more reasonably valued than big tech, and so are likely to outperform over the next year.
Economic data will appear alarming due to hurricane impacts, but the economy is growing at 3% with strong corporate profit prospects and low recession risk.
Inflation is on track to fall to 1.8% by May, with real wage growth outpacing pre-pandemic trends. Future inflation is expected to remain stable at 2.1% over the next 30 years.
Market valuation is not as overvalued as feared, with potential for significant upside (up to 30% to 38%) based on corporate profit growth and falling interest rates.
Short-term market volatility is normal; long-term investors should embrace corrections for potential high returns as fundamentals remain strong.
The average 2-year return after a 10+% correction is 35%, meaning long-term investors should embrace corrections as wonderful buying opportunities. Buy with confidence in the face of any short-term market weakness, as long as you stick to your optimal personal asset allocation, based on your specific risk profile and financial needs.
This article has a number of interesting and informative sections, including on why cash flow/enterprise value is a better metric for assessing the valuation of a stock than price/earnings.
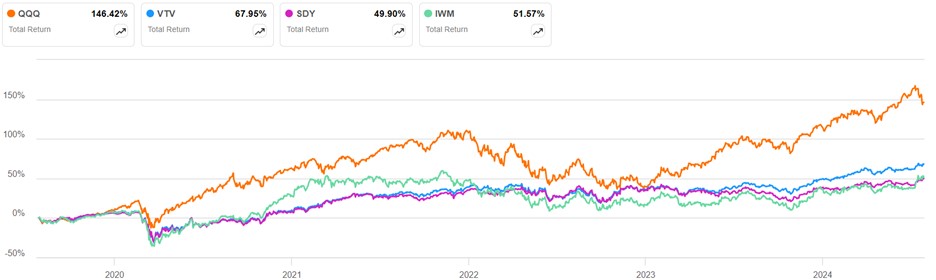
Tech stocks have been unstoppable for the past fifteen or so years. Here is a chart from Seeking Alpha for total return of the tech-heavy QQQ fund (orange line) over the past five years, compared to a value-oriented stock fund (VTV), a fund focused on dividend-paying stocks (SDY) and the Russel 2000 small cap fund IWM.
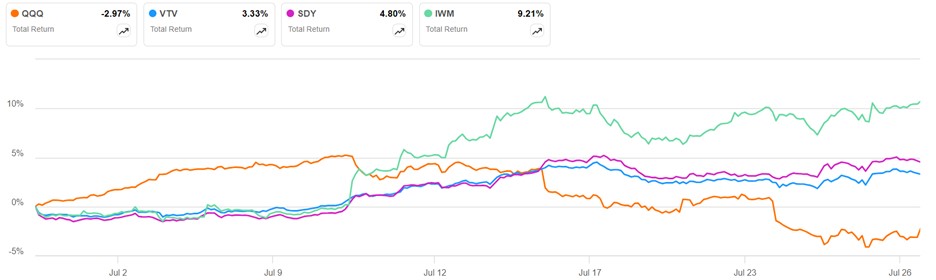
QQQ has left the others in the dust. There has been a reversal, however, in the past month. The tech stocks have sagged nearly 10% since July 11, while the left-for-dead small caps (IWM, green line) rose by 10%:
Some of this is just mean reversion, but there seems to be a deeper narrative shift going on. For the past 18 months, practically anything that could remotely be connected with AI, especially the Large Language Models (LLM) exemplified by ChatGPT, has been valued as though it would necessarily make every-growing gobs of money, for years to come.
In recent weeks, however, Wall Street analysts have started to question whether all that AI spending will pay off as expected. Here are some headlines and excerpts (some of the linked articles are behind paywalls):
““There are growing concerns that the return on investment from heavy AI spending is further out or not as lucrative as believed, and that is rippling through the whole semiconductor chain and all AI-related stocks,” said James Abate, chief investment officer at Centre Asset Management.”
““The overarching concern is, where is the ROI on all the AI infrastructure spending?” said Alec Young, chief investment strategist at Mapsignals. “There’s a pretty insane amount of money being spent. Jim Covello, the head of equity research at Goldman Sachs Group Inc., is among a growing number of market professionals who are arguing that the commercial hopes for AI are overblown and questioning the vast expense required to build out infrastructure required for the computing to run and train large-language models.”
“It really feels like we are moving from a ‘tell me’ story on AI to a ‘show me’ story,” said Ohsung Kwon, equity and quantitative strategist at Bank of America Corp. “We are basically at a point where we’re not seeing much evidence of AI monetization yet.”
Google stock got dinged last week for excessive capital spending, even though earnings were strong. Microsoft reports its Q4 earnings after the market closes today (Tuesday); we will see how investors parse these results.