We have known for a long time (basically since the start of the pandemic) that COVID primarily affects the elderly. Infection fatality rates are hard to calculate (since not all infections are reported), but most of the data suggest that the elderly are much more likely to die from COVID than other age groups.
For some, this has become one of the most important aspects of the pandemic. For example, Don Boudreaux emphasizes the age distribution of deaths many times in a recent episode of Econtalk, and he uses this point to argue that we addressed the pandemic incorrectly (to say the least). Boudreaux specifies that COVID is only deadly for those 70 and older. And while I won’t rehash the argument here, please also see my exchange with Bryan Caplan, where he argues that elderly lives are worth a lot less than younger lives (I disagree).
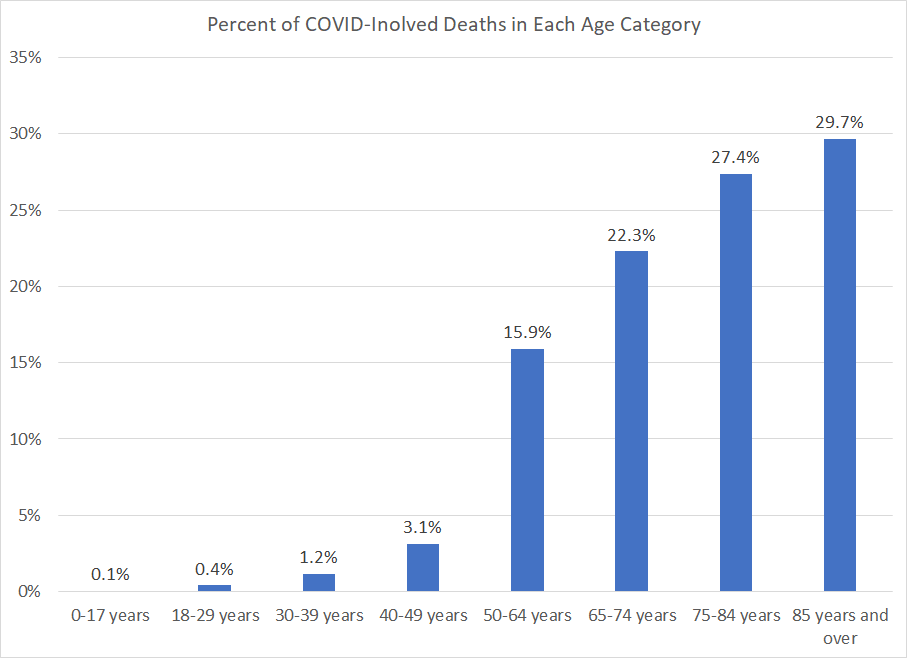
At first blush, the data seems to bear that out. The CDC reports that almost 80% of COVID-involved deaths were among those aged 65 and older (I will use the CDC’s definition of COVID-involved deaths throughout this post). In other words, of the currently reported almost 600,000 COVID deaths in the US, about 475,000 were 65 and older. Throw in the 50-64 age group, and you’ve now got 570,000 of the deaths (95% of the total).
But is this the right way to think about it? Remember, the elderly always account for a large share of deaths, around 75% in recent years. So it shouldn’t surprise us that most deaths from just about any disease are concentrated among the elderly.
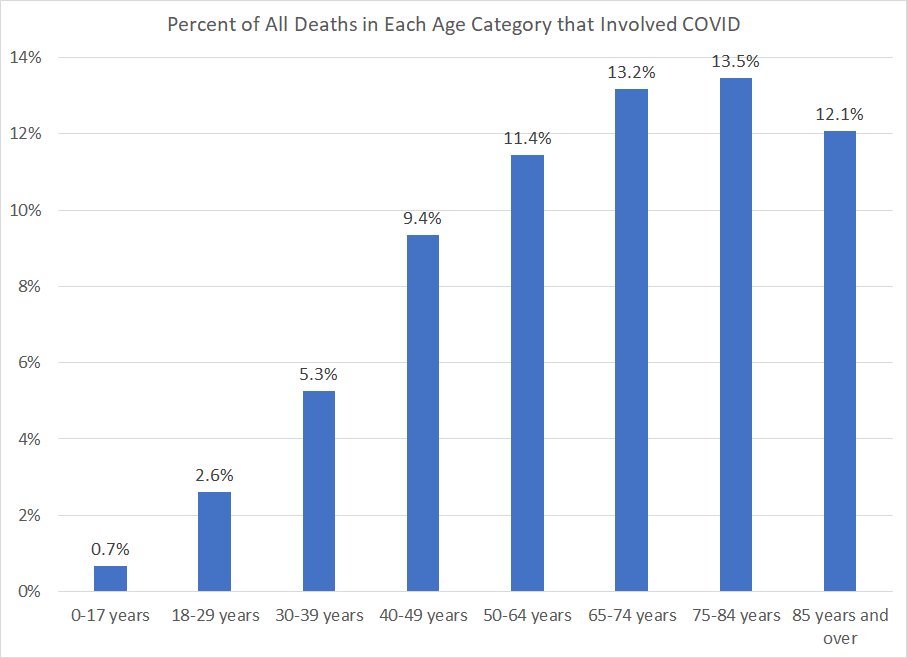
Here’s another way to think about: of all deaths in one age category, how many were COVID-involved deaths? The picture looks a lot different.
This data is for all of 2020 and the first half of 2021, so it includes several months at the beginning and end when the pandemic wasn’t raging. Still, I think it is instructive. Here we can see that it is only for the very young that COVID deaths are an insignificant portion of the total. For those middle age, such as 40-49, almost 10% of all deaths involved COVID, not much less than the elderly (if we start in March 2020, it’s slightly more than 10%). And hey, 40-49 is my age group, so don’t you dare call us elderly!
There is still an age gradient to this second chart, but it’s nowhere near as steep as the first. For anyone over the age of 30 that died in 2020-2021, COVID was a noticeable part of the total.
Let’s drill a little deeper into that 40-49 age group, to pick on me and my fellow young Gen Xers, to see just how important COVID was to mortality. I’ll focus on the 15-month period from March 2020 through May 2021 (there are no reported COVID deaths before March 2020 for this group, and May 2021 in the most recent monthly where the data is probably mostly complete).
For this 15-month time period, there were 171,612 total deaths from all causes for those aged 40-49. For comparison, using the same months in 2019 (double counting March-May to make it a comparable 15 months) there were just 135,139. In other words, there were 36,473 more deaths in this age group than we would have expected (yes, there is population growth every year, but there are also always healthcare improvements, so we should expect roughly the same number of deaths year-on-year, pandemics and wars aside — the same figure was 134,507 in 2018).
Now there are a couple of interesting things about the 36,000 excess deaths in this age group. First, it is a 27% increase in deaths, a massive jump in one year. It’s unusual for deaths rates to fluctuate more than a few percentage points from year-to-year.
Another curious thing about this 36,000 excess deaths number is that it is double the number officially recorded COVID deaths, which is 18,225 for this age group for the 15-month time period I’m focusing on. Even the 18,000 COVID deaths is a huge increase over what we would expect: about 13.5% greater. Still, what are we to make of the roughly 18,000 other excess deaths?
There are essentially two polar opposite possibilities. One is that these deaths were also caused by COVID, but the just weren’t recorded as such. The second is that these deaths were caused by the general social turmoil of society and the recession (I will leave aside for moment the important question of how much of this turmoil can be attributed to government policies vs. voluntary social behavior — I don’t think we have good enough data yet).
I suspect the truth is somewhere in between. There are some unreported COVID deaths, but during a recession we would expect some other deaths to go up as well. We don’t have good comprehensive cause-of-death data broken down by age yet. We have some suggestive data: suicides were down in 2020, but overdoses were way up. Exactly how these changes to suicides, overdoses, and other causes impacted the 40-49 age group are unknown at this point. Also unknown is how these deaths changed in the first half of 2021 (don’t forget: the pandemic isn’t over!), since over 1/3 of all reported COVID deaths occurred in 2021 already.
As one final point of reference, for the age group 40-49 there are about 1,000-2,000 influenza and pneumonia deaths every 12 months (average the past 10 years is about 1,300). So on a 15-month basis, there have been roughly at least 10 times as many COVID deaths as these other major respiratory diseases. And again, keep in mind this is not for the elderly! Here’s a big reason that comparisons to infection fatality rates to influenza are not especially helpful: last year there was no COVID vaccine, but we do have a seasonal flu vaccine (which isn’t even super effective, but at least we have had one for years). So even if the IFR of COVID was exactly identical to flu (again, hard to exactly calculate), COVID could be much more deadly because we didn’t have a vaccine in 2020.
While Boudreaux on Econtalk is correct that for children under 18 COVID is not very deadly (just a little over 300 deaths), for most adults COVID was a significant part of 2020-21 mortality. And not just the elderly: middle-aged folks like me saw massive increases in mortality compared to a normal year.
Addendum: Bonus Charts!
As I was thinking about this topic more, I thought of another way to visualize the data using the crude mortality rate. Going back through old US Vital Statistics Reports, I quickly realized it would be much easier to use the standard 35-44 age group than the 40-49 group that I used throughout this post. But that’s not a trick, since I’m actually now using a slightly younger age group. I’ll also just use 2020, not any months from 2021, because that simplifies the comparison (but never forget there will be a lot of COVID deaths in 2021 once we have the final data).
The first the crude mortality rate, just for the 35-44 age group (deaths per 100,000 people). We can see that the crude mortality rate spiked up to levels not seen since the mid-1970s.

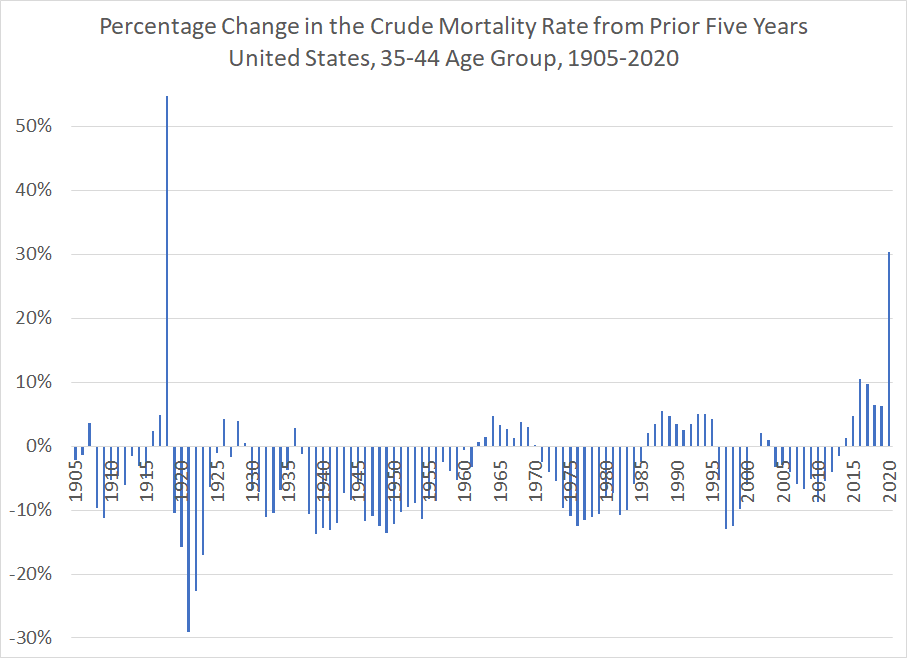
The second chart uses the same data to show the change in the crude mortality rate for this age group. I use the previous 5 years as the baseline. There’s not a particular reason to use 5 years, but whatever baseline you use you get the same result: the increase in mortality, even for those in “middle age,” is the largest single year increase since the 1918 pandemic: a 30% increase (1918 was 55%).

One thought on “COVID Deaths and Middle Age”