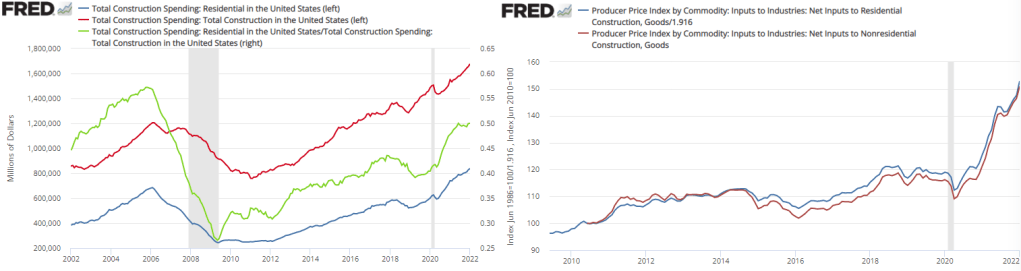
Total spending on real estate construction has been rising since 2011. By 2016 it had reached its previous 2006 peak. However, total spending on *residential* real estate construction didn’t reach its previous 2006 peak until November of 2020. The graph below also includes the proportion of residential construction spending (Green). It has been rising since 2009. In and of itself, nothing is good or bad about this figure. We might be spending less on non-residential construction because we are getting better at using less land per unit of good or service produced. Or, it could be that our real investment in future production is falling relative to our current residential consumption. Regardless, the share of residential construction hasn’t been at this level since 2003.
Importantly, the difference in spending has not been driven by different construction costs. Both residential and non-residential construction costs have moved in tandem since 2010. Therefore, the rise in residential construction spending is not merely nominal – a greater proportion of resources are being consumed by residential construction. Indeed, real residential construction is up about 25% from 2019. The figure below illustrates real residential and nonresidential construction.
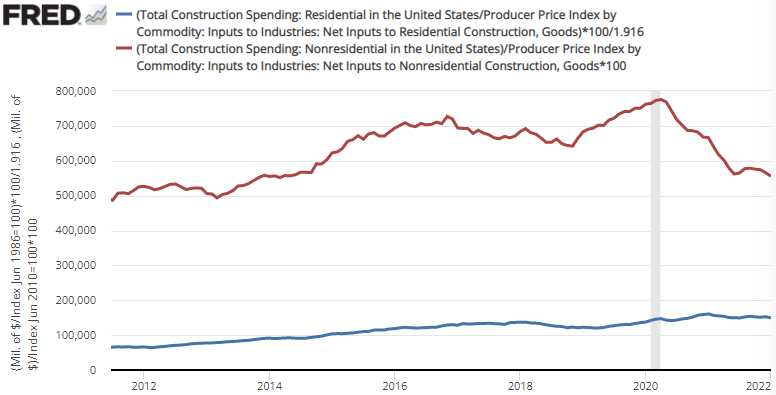
That figure requires a double-take.
Real nonresidential construction has been *falling* since April of 2020. In the span of less than 2 years, real non-residential construction has tanked to the tune of 28%. Does this reflect the lower demand for commercial space that remote work has wrought? Does it reflect the cannibalization of commercial construction by residential construction? Have stimulative policies protected the residential real estate market at the expense of the commercial real estate market? Is the cause demographic? Is it a problem for long-run output? I don’t know.
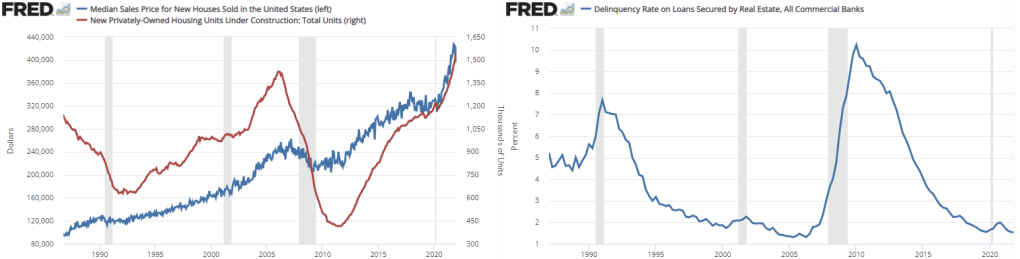
What I do know is that the median price of a new house is higher than ever. A new neighborhood in my town had been advertising new homes $200k-$600k. That sign has recently been replaced by a new sign that added $100k to both the lower and upper prices. Nationally, the median price of a new home is up 28.7% in the two years since January 2020. It’s true that some of the higher prices are due to higher construction costs. But the construction of new homes is *increasing* despite the greater costs of construction. That means that demand for homes is rising by even more than the supply. Demand is driving the increase in residential housing construction.
https://fred.stlouisfed.org/graph/?g=Mzxb
Are we in a bubble?
One can speculate. What kind of bubble do I mean? New units under construction has been convex for the past two years. When it began declining from its previous peak in January of 2006, new home prices didn’t begin falling until 15 months later in April of 2007. Regardless, we’re at neither a construction nor a price peak currently. Notice that units under construction declines and real estate-backed loan delinquency rise prior to recessions and median housing price declines.
The world can change quickly, of course. Anytime that I forecast high prices or volumes, Irving Fisher’s spirit reaches out and puts his cold hand on my shoulder, beckoning me to step away from the keyboard. Fisher had famously predicted the permanent plateau of the stock market – right before it crashed in 1929. All the same, from where I’m sitting, neither housing prices nor housing construction show any sign of decline….Yet.
