The answer to that question is, of course, “no.” No one number can alone tell us the whole story, whether we are talking about the economy, health, education, population, or any other social statistic. But when you look at other measures of the health of the labor market, you usually find that they tell a similar story to the unemployment rate.
My goal in this post is to dive a little deeper into the data on the labor market, but really the goal is broader: to give you a little insight about how to interpret data. Some rules of thumb, perhaps. But really there is One Big Rule: numbers need context. A number on its own doesn’t tell us much of anything. How does it compare to the past? How does it compare to other places?
With the unemployment rate at historic lows for both the US and many states, I’ve started to see many people saying that, not only doesn’t the unemployment rate give us the full story, but many other indicators point in the opposite direction. Is this true? Let’s dig into the data. Here’s one example of someone saying this for Arkansas. I’ll focus on Arkansas, since that’s where I live and I pay attention to the economic data here pretty closely, but I’ll also refer to national data where appropriate.
Unemployment Rate(s)
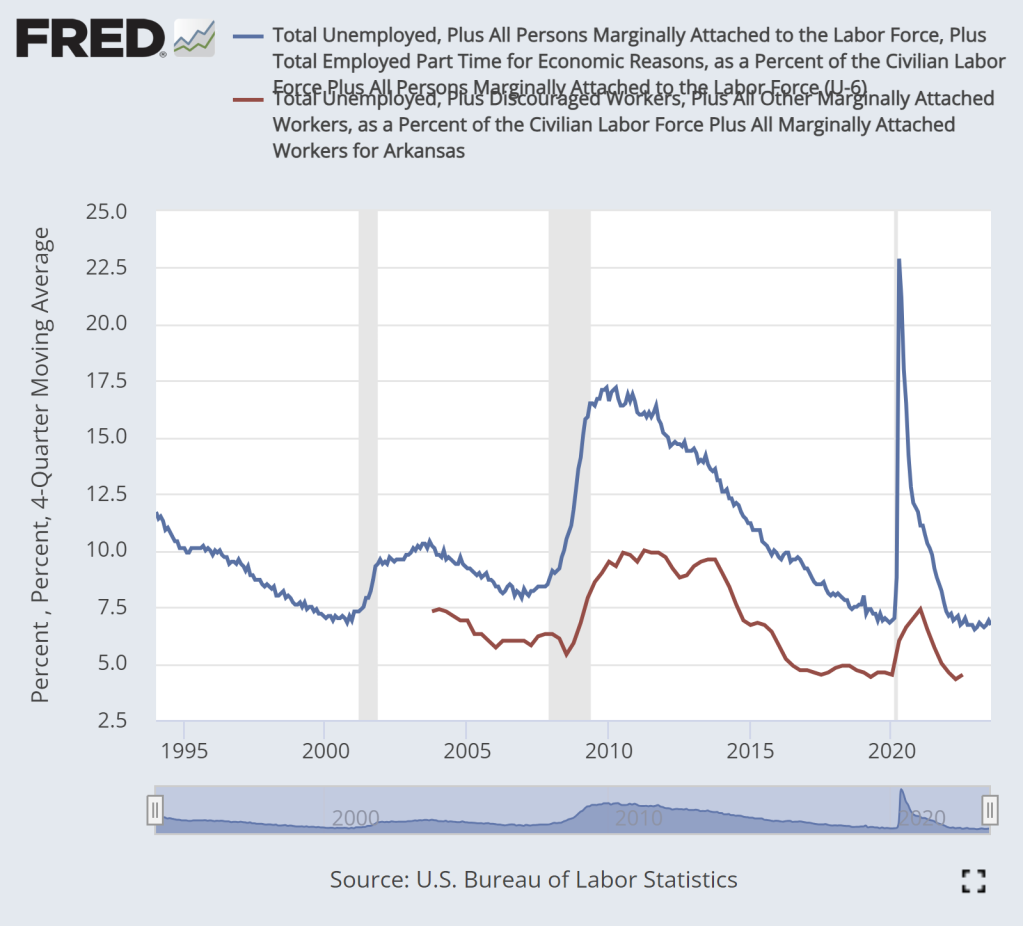
One common alternative measure of the labor force is produced by the Bureau of Labor Statistics alongside the unemployment rate. There are actually 5 “alternative measures of labor underutilization” that BLS produces in addition to the headline unemployment rate. Two of these are narrower than the official rate (which is called the U-3 rate in this data), and three are broader. The broadest is the U-6 rate, which includes people that are “marginally attached” to the labor force (such as “discouraged workers”) as well as those who are working part-time for “economic reasons.”
The U-6 rate for the US stands at 6.7% in July 2023, compared with 3.5% for the headline unemployment rate. In Arkansas, the headline rate was 2.6% in July 2023, while the latest U-6 rate is 6.0% (note: for states, BLS gives an average rate covering 4 quarters, since the sample size is so small, so this latest number is not directly comparable to the U-3 rate). For both the US and Arkansas, the U-6 rate is roughly double the headline unemployment rate.
Does that mean things “aren’t quite as good” as the unemployment rate suggests? Not really. Once you start including more things in the “kinda unemployed” category, of course the number will go up! But we need context. The context here is that for both the US and Arkansas, the U-6 rate is also at historic lows. Unfortunately this data doesn’t go back as far as the traditional unemployment rate, but given that it generally moves with the unemployment rate, it’s reasonable to say the U-6 rate is at or near the lowest it has ever been. (Note: that slight tick up in the rate for Arkansas appears to be an artifact of the way FRED imports this weird data, as it is clearly lower in the raw data from BLS.)

Labor Force Participation and Employment Rates
Another measure that we might use is the Labor Force Participation Rate. This tells us what percent of the adult population is currently “in the labor force,” which includes both those who are unemployed and employed. For both the US and Arkansas, this figure is still below pre-pandemic levels. But it’s even worse that that: the LFPR has been falling since the 1990s! Does this mean the labor market has been weakening? Is that the context that we need.
What we actually need is to contextualize this number. As we learned in the previous section, the definition of “unemployed,” and thus the “labor force,” is a little squishy. People can be out of work, of working age, and want work (or more work), but still not be counted as unemployed. A more concrete measure would be: how many people are employed.
Further, the denominator of this rate is a little funny and problematic. It’s a well-known demographic fact that the US population is aging: 17% of the US population was 65 or older in 2020. This is a big jump from 100 years ago, but it’s also a big jump from just 30 years ago. Given these demographic changes, it’s not surprising that the LFPR would fall.
Is there a way to cut through the noise of these issues? Yes. It’s sometimes called the “prime age employment rate.” What percent of the prime age working population is currently employed? If we define the “prime working age” as 25-54, then we see that we have surpassed the pre-pandemic levels. This number is not quite at its all-time high for the US, but it’s only off about 1 percentage point from the peak in April 2000. Contrast that with the LFPR, which is down almost 4 percentage points.
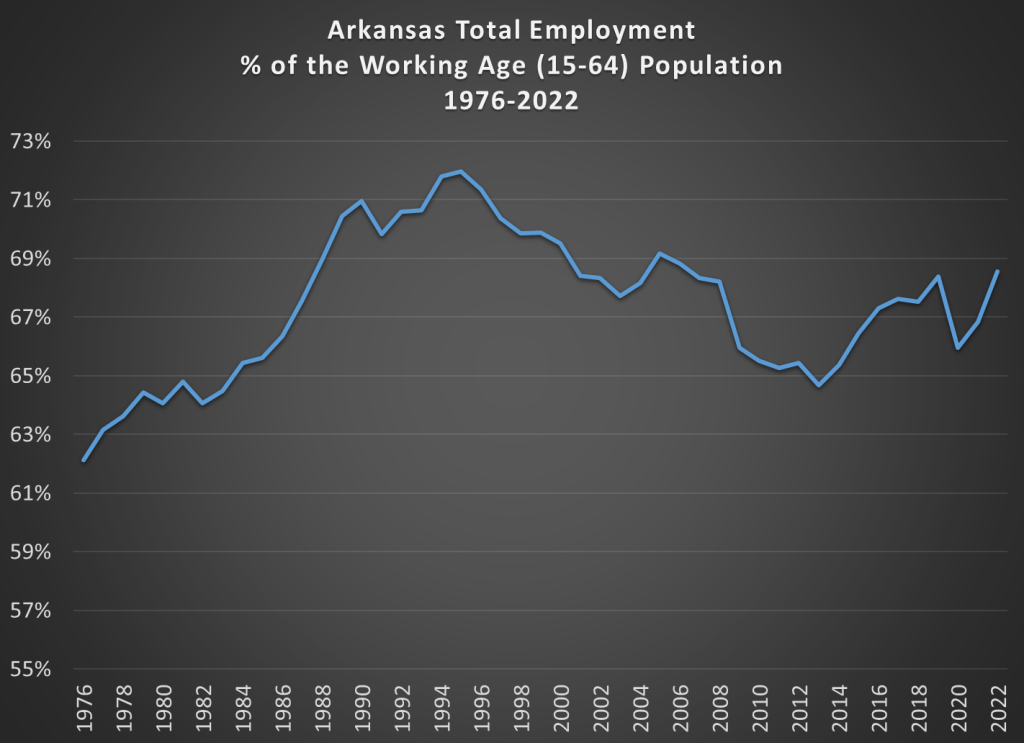
Do we have a similar measure for Arkansas? Unfortunately, I can’t find anything close to this in the publicly available data, so I created a measure which roughly approximates the same idea.

This measure is not perfect, since it includes all employment in Arkansas, regardless of age, and uses the population age 15-64 as the denominator. Certainly, there are employed Arkansans over the age of 64, and that number may be increasing. Nonetheless, this chart is a rough approximation of the fraction of the working age population that is employed, and it shows that 2022 was the highest level of employment in recent years, exceeding the pre-pandemic level, and only exceeded by the also very strong labor market of the 1990s. Not coincidentally, this coincides with the unemployment rate being at a historic low as well. Once again, the unemployment rate is not the full story, but it generally moves in the same direction as other indicators.
Unemployment Insurance Claims
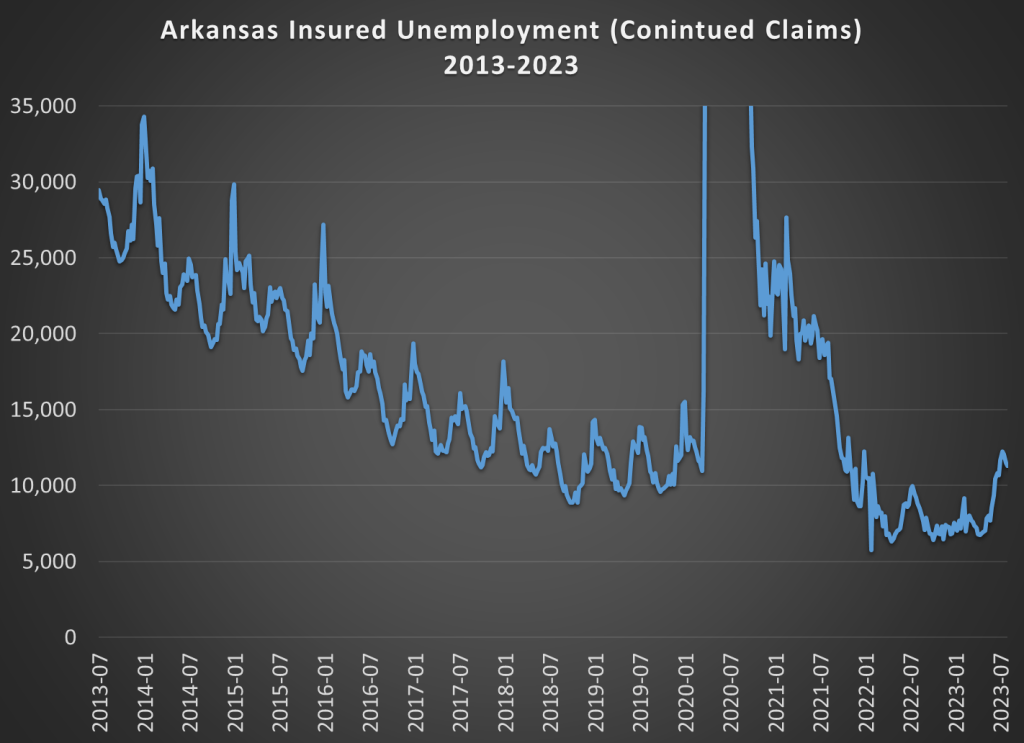
As a final measure of the health of the labor market, we can look at the number of individuals filing unemployment insurance claims. Here’s 10 years worth of claims data for Arkansas. I’ve truncated the y-axis, removing the worst peak of the pandemic (over 120,000 claims in Arkansas) so you can see the seasonal detail for the non-pandemic years.

If you only focus on the most recent months, things looks bad! Claims have been rising in the Summer of 2023, and were briefly over 12,000 claims in Arkansas, a figure we hadn’t seen regularly since late 2021. Seems like the labor market might be getting worse.
However, if you look at the pre-pandemic data (2013-2019 in this chart), you will notice a clear seasonal pattern. Claims tend to have two peaks per year, one in January and one in July. An increase in claims in the summer, peaking in July, is not only not unusual, it’s completely expected. In fact, the 12,000 UI claims that Arkansas saw in July 2023 is actually lower than all the pre-pandemic Julys in the chart above. It’s roughly equal to the annual average of claims during 2019. True, we didn’t see a peak of claims in July 2022, but that’s mostly due to the ending of pandemic-era UI extensions the prior summer. By Summer 2022, a lot of workers just wouldn’t have had the 4 quarters of wages necessary to get a decent-sized UI check.
So with the recent UI claims data, we see exactly the same thing we saw with all the other alternate labor market measures: in Arkansas, things are clearly better than pre-pandemic, or really any year in the past decade. For some measures, the best ever!
But importantly, we don’t know any of this without the proper context.
2 thoughts on “Does the Unemployment Rate Tell the Whole Story about the Labor Market?”