The Middle of the 20th Century was a Weird Time for Marriage

Yesterday on Twitter I shared a chart showing the age at first marriage for white men and women in the US, with data going back to 1880. I pointed out an interesting fact: at least for men, the age was essentially the same in 1890 and 1990 (27), though for women it was a bit higher in 1990 than in 1890 (by about 1 year).

This Tweet generated quite a bit of interest (over 800,000 impressions so far), and (of course!) a lot of skeptical responses. One skeptical response is that I cut off the data in 1990, when trends since then have shown continuously rising ages at first marriage, and by 2024 the comparable figures were much higher than in 1890 (by about 4 years for men and 6.5 years for women). In one sense, guilty as charged, though I only came across this data when looking through the Historical Statistics of the US, Millennial Edition, and that was the most current data available when it was printed. Here is a more updated chart from Census:

But there is another interesting fact about that data: the massive decline age of first marriage in the first half of the 20th century. Between 1890 and 1960, the median age at first marriage fell by about 3 years for men and 2 years for women. For men, most of the decline (about 2 years) had already happened by 1940. Thus, if we start from the low-point of the 1950s and 1960s (as many charts do, such as this one), it appears marriage is continuously getting less common in US history, while the fuller picture shows a U-shaped pattern.

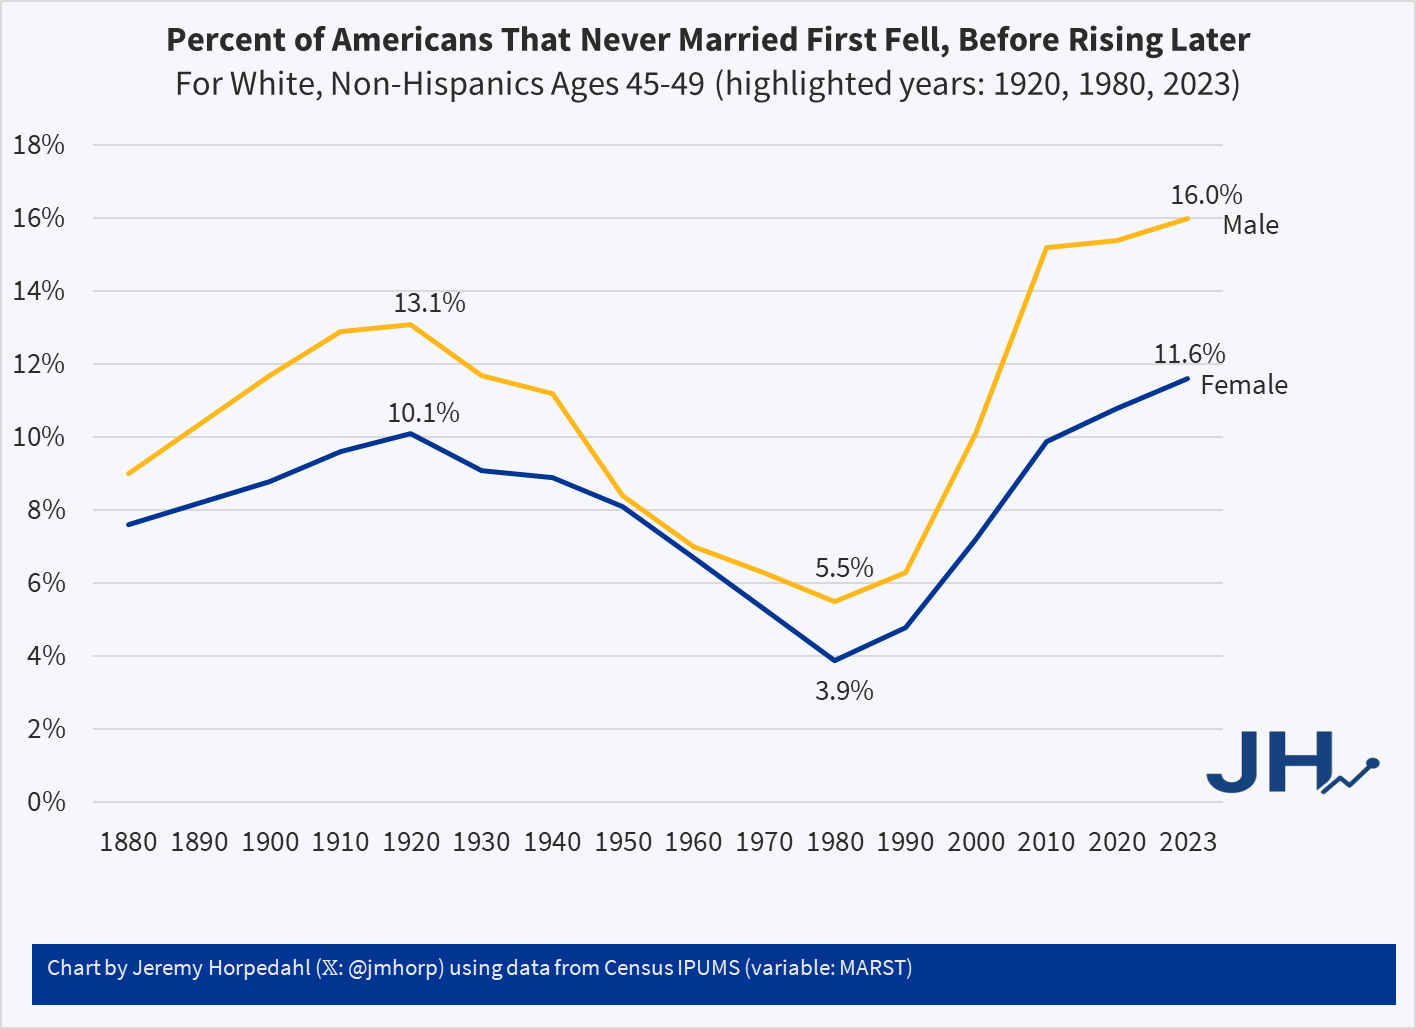
This same pattern shows up in another measure of marriage data: the percentage of people that never get married. If we look at White, Non-Hispanic Americans in their late 40s, the picture looks something like this (keen observers will note that the Hispanic distinction is a modern one dating from the 1970s, but Census IPUMS has conveniently imputed this classification back in time based on other demographic characteristics):

Looking at people in their late 40s is useful because, at least for women, they are past their childbearing years. And using, say, the late 50s age group doesn’t alter the picture much: even though some people get married for the first time in their 50s, it’s always been a small number.

Here we can see an even more dramatic pattern. 100 years ago, it was not super rare for people to never marry: over 1/10 of the population didn’t! But by 1980 (thus, for people born in the early 1930s), it was much rarer: less than 4% of women were never married (among White, Non-Hispanics). In fact, the peak in 1920 of 10% unmarried women wasn’t surpassed again until 2013! And it’s not substantially higher today than 1920 for women, especially when considering the full swing downward. Men are quite a bit higher today, though the 1920 peak of 13% wasn’t surpassed again until 2006.

For a measure that peaks in 1920, we might wonder if new immigrants are skewing the data in some way, given that this is right at the end of about 4 decades of mass immigration. But just the opposite: if we focus on native-born women, the 1920 level was even higher at 11.1%, which wasn’t surpassed until 2022, and even in the latest figures it is less than 1 percentage point higher than 1920.

Precisely why we observed this U-shaped pattern in marriage (both first age and ever married) is debated among scholars, though my sense among the general public is that it isn’t much thought about. Most people (from my casual observation) seem to assume that marriage rates and ages were always lower in the past, and that modern times are the outliers. But in reality, the middle part of the 20th century seems to be the outlier. The “Baby Boom” of roughly 1935-1965 is possibly better understood as a “Marriage Boom,” with more babies naturally following from more and younger marriages.

WW II Key Initiatives 1: FDR Prodded the Navy To Convert Cruisers to Carriers, Just in Time

This is the first of a series of occasional posts on observations of how some individual initiatives made strategic impacts on World War II.  Most major decisions were made by teams of qualified engineers or military staff or whatever. But there were cases where one person’s visionary action made a material difference. There were, of course, many thousands of individual acts of initiative and heroism that went into the outcome of any given battle. However, I will focus on actions that shifted the entire capabilities of their side.

In this regard, I recently read how the intervention of President Roosevelt helped to give the U.S. nine additional aircraft carriers in the Pacific at a time when they were critically needed. As of U.S. entry into WWII in December, 1941, America had a total of 7 carriers, while Japan had 11.

It had been clear for a while that the U.S. needed more carriers, but (pre-Pearl Harbor), the Navy was more focused on building battleships; for centuries, big ships carrying big cannons were the vessels that ruled the seas. Navy brass had run studies of carrier sizing, and decided they would rather have fewer, larger carriers, due to operational efficiencies. A problem was these large carriers took years to construct.

Thus, as of 1940 the projections were that the U.S. Navy would receive no new carriers before 1944. As a naval war with Japan looked more and more likely, the President got concerned. FDR had been Assistant Secretary of the Navy during World War I, and maintained an interest in naval affairs, so he had informed judgement here. In October, 1940, Roosevelt sent a letter to the Chief of Naval Operations,  expressing interest in converting merchant ships into carriers for secondary duties such as convoy escort, antisubmarine warfare, aircraft transport, and air support of landing beaches. The Navy’s response was lukewarm. In 1941, FDR proposed that some of the many cruisers under construction could be converted to small carriers. The Navy considered this, and on 13 October 1941, the General Board of the United States Navy replied that such a conversion showed too many compromises to be effective: such carriers would be less stable platforms than the big carriers, and carry less than half the number of planes per ship.

I think most presidents would have given up at this point, but not FDR. He immediately ordered another study (I assume with the implicit message, “…and this time give the boss the answer he wants”). Lo and behold, on 25 October 1941, the Navy’s Bureau of Ships reported that aircraft carriers could in fact be converted from cruiser hulls. They would be of lesser capability, but fast enough for fleet action, and available much sooner than large carriers.

The December 7, 1941 attack on Pearl Harbor changed everything. That ninety-minute raid showed that aircraft carriers were by far the most critical warships. A carrier could reach out a hundred miles and easily sink any battleship with torpedo bombers, as Japan showed on that “day of infamy” and further demonstrated by sinking British battleships near Singapore, and chasing the British navy largely out of both the Pacific and the eastern Indian Oceans. (If the brass had been paying attention, the British Navy had already used carrier-based torpedo bombers to cripple battleships at the Taranto raid and with sinking the Bismarck, well before Pearl Harbor).

The U.S. did end up converting some (slow) merchant ships to carriers, and built a huge number of small, slow, fragile “escort” carriers for transporting planes and for shore bombardment. But there was still an immediate need for better-protected small “fleet” carriers which were fast enough to keep up with the big carriers and which could survive being hit by a bomb. Japanese leaders knew they could not prevail in a long drawn-out war, so their strategy was to inflict so much damage on American military and territorial assets in the first year of conflict that the U.S. would sue for peace under Japanese terms. Japan, like Germany, was very successful at first. The Japanese overran nearly all of Southeast Asia, including the Philippines (an American possession), the Dutch East Indies (a source of rubber, petroleum, and minerals) and the British stronghold at Singapore. They came perilously close to invading Australia. So the first year or so was critical: the Allies needed to survive the onslaught from a better-prepared opponent until American mobilization took full effect.

The Navy settled on repurposing a suite of nine Cleveland class light cruisers which were under construction. These new “light carriers” could carry about 30 planes apiece, compared to a complement of around 60 planes on the full-sized ships. The smaller carriers carried fewer spares, rolled more in heavy seas, and had smaller flight decks which led to more accidents. Nevertheless, they provided a boost to U.S. naval air power at a critical time.

The U.S. entered the war with seven fleet carriers, of which six were assigned to the Pacific. In the course of 1942, four of those six fleet carriers were sunk, and the other two were severely damaged from bombs and torpedoes. Thus, there was a time in October, 1942 that the U.S. had not a single operational carrier in the Pacific, while Japan was fielding around six. That was dire.

No new U.S. carriers were commissioned until the last day of 1942 (U.S.S. Essex). That was a long dry spell. Finally, in the first six months of 1943 eight fleet carriers commissioned. Of these, three were full-sized ships, while five were the cruiser-based light carriers. That finally gave the U.S. some breathing room, which allowed it to defend its assets and pursue offensive operations. These “Independence-class” light carriers fought in many battles, sometimes providing around a quarter of the fleet airpower.

Thereafter, the astonishing mid-century American industrial capacity took over. From mid-1943 through mid-1945 another 17 fleet carriers (including four more Independence-class light carriers in the second half of 1943) poured out of U.S. shipyards, along with some 60 “escort” carriers. By late 1944, this gigantic fleet had utterly overwhelmed Japan’s navy.

But it was largely Roosevelt’s vision and repeated poking of the stodgy Navy staff that produced the first batch of light carriers which helped tipped the balance of forces during the critical first eighteen months of the war.

AI isn’t going to be what you expect

Perhaps a more accurate title would be “AI isn’t going to be what you want it to be or are afraid it will be.” And by “you” I mean specifically you. Whatever you have in your mind’s eye, that’s what you should correct your expectations against. Those rare times where we have the slow unveiling of a revolutionary technology, over the span of years or even decades, there is a window of time where we all form an expectation of that it will look like in it’s final form and we’re all wrong. Everyone of us. Except Neal Stephenson, but that is another story.

I think we come by this bias honestly. There’s this tendency to see a new technology and either try to will it into being exactly that thing that would be a optimal for you, or succumb to pessimistic paranoia that this is why you were always fated to lose. In the early 00’s, the start-up tech boom and, later, stock market bubble were driven, I think, but the irresistable optimism that “The Internet” was a way that someone could enter a new market via their garage and bootstrap their way to millions while skipping those less than fun decades of grinding your way to a customer base. If you had a clever concept, then millions of customers were a click away. It was “idea person” catnip. And by idea person I mean someone who has lots of ideas but rarely can be bothered to follow through with anything more a few days. Eventually enough vaporware was a bought and sold that people started to question what was real, Microstrategy got caught cooking the books, everyone had the “maybe this thing isn’t real” thought all at once, and the market tanked. Flash foward 15 years and the internet had radically changed everyone’s life, but how it did so was in hard to foresee ways, through firms that were painstakingly built by experts and/or exploded into market leadership through network effects they’ve been teaching in Econ 101 for at least 30 years.

I observed a similar effect in my own research career. In my early years I was obsessed with agent-based computatonal modeling (something I’ve written about before). For all the optimism I carried for the methodology, it always paled in comparison to expectations and claims made by other. There was an observable pattern, too. What I saw was a way to model things that weren’t tractable in other economic methods, be it classic analytics, game theory, or dynamic stochastic general equilibrium models. What they saw was a way to write and publish economic models without having to learn high level math. Its both a way in and a way around. A way to skip a stage that they wanted to believe was unnecessary to make a scholarly contribution and/or make a career in academic social science. For some it was also a way to retake scientific territory annexed by economists. In either case, their expectations were deeply biased.

What I hear within a lot of a commentators, particularly those most obsessed and optimistic for AI, is wishing into existence the tool that would best serve them. To reimagine the cliche of a hammer in a world full of nails, they are toolbox that is missing a screwdriver, but have no fear, AI will be the universal screwdriver. No need for screwdrivers anymore, everyone will have a near infinite supply of (near) zero marginal cost universal screwdrivers, ready at a moments notice. If you are a professional screwdriver, well, you are out of luck, but that’s how the fates work and bully for me because I can accomplish so much now that I have an infinite supply of the skill I lacked. I am neither constrained by my own personal deficiencies, nor am I constrained by resources insufficient to hire a team of screwdrivers. I am what I always I dreamed I would be: a specialist in what the world still needs that is no longer dependent or deferential to people with the skills I lack. If a prognosticator is predicting a specific future for AI that will greatly increase their relative status among a narrow strata of professionals or scholars, you should index their prediction accordingly.

The inverse of this, of course, is the people who imagine themselves to be the screwdrivers in the previous story. They have specialized in labor product that is soon to be available at zero marginal cost. They’re value will be decimated and thus there is no hope. The irony, of course, is that it is the exact same story but perhaps seems more likely now that it is put in a pessimistic light. Obsolescence happens, after all. They’re both almost guaranteed to be wrong, though. Both sets of expectations are being radically biased by the narcicissm of the imaginer.

My impulses are, of course, similar to everyone elses. I try to keep this in check through my experience with the tech bubble (N=1, I know). AI will change our lives, but it will probably take at least 5-7 years longer than expected, and at least that long before that change is successfully “monetized”. The changes will be significant, it will show up in almost all of our work lives. It will disappoint in many ways. I remember telling someone that our expectations for the internet were too high for it to ever meet them. Then the iPhone came out and suddenly its penetration into our lives was fully actualized.

I don’t know what you think AI will be, but you’re wrong. And that’s ok. We all are.

Everything Except Book Reviews

For the last few years the blog Astral Codex Ten has run contests for the best reader-submitted book reviews. This year Scott mixed things up and asked people to review anything except books.

You can review a movie, song, or video game. You can review a product, restaurant, or tourist attraction. But don’t let the usual categories limit you. Review comic books or blog posts. Review political parties – no, whole societies! Review animals or trees! Review an oddly-shaped pebble, or a passing cloud! Review abstract concepts! Mathematical proofs! Review love, death, or God Himself!

The 13 finalists have a couple of entries on the sorts of things that are typically reviewed: a play, a food, a specific school. But most are pretty abstract or unusual as reviews go: like the general idea of school, dating men in the Bay Area, and fighting in the Russo-Ukranian War.

“This is not like Iraq” the Ukrainian recruiting officer soberly told me with a thick accent. “You have 50% chance of dying.” That wasn’t actually true, but it was a lot closer to being true than almost anything you can voluntarily sign up for in an organized way. I decided it was worth it.

Recommended, I thought several of the essays were excellent, voting goes through October 13th.

James Webb Telescope Still Orbiting the Sun

Last week I took kids to an excellent show at Samford’s Christenberry Planetarium. If you live in Alabama, follow them on Instagram for updates on events (often free).

I have heard people say that the liberal project is doomed because people just want to war.
Well, did you know that the James Webb Space Telescope orbits the sun? (I was busy on Christmas 2021 when the rest of the world was alerted to this fact.)

You can keep up with the mission here https://science.nasa.gov/mission/webb/

You can see what is Webb observing

Make discoveries through international collaboration, not war.

For a small number of readers who have time and interest in cutting edge physics and speculation, I know Julian Gough through Emergent Ventures and he’s at : “man-made black holes, the hidden catastrophe at the heart of materialist science

Children Don’t Die Like They Used To

Academics generally agree on the changing patterns of mortality over time. Centuries ago, people died of many things. Most of those deaths were among children and they were often related to water-borne illness. A lot of that was resolved with sanitation infrastructure and water treatment. Then, communicable diseases were next. Vaccines, mostly introduced in the first half of the 20th century, prevented a lot of deaths.

Similarly, food borne illness killed a lot of people before refrigeration was popular. The milkman would deliver milk to a hatch on the side of your house and swap out the empty glass bottles with new ones full of milk. For clarity, it was not a refrigerated cavity. It was just a hole in the wall with a door on both the inside and outside of the house. A lot of babies died from drinking spoiled milk. 

Now, in higher income countries, we die of things that kill old people. These include cancer, falls that lead to infections, and the various diseases related to obesity. We’re able to die of these things because we won the battles against the big threats to children. 

What prompts such a dreary topic?

I was perusing the 1870 Census schedules and I stumbled upon some ‘Schedule 2s’. Most of us are familiar with schedule 1, which asks details about the residents living in a household. But schedule 2 asked about the deaths in the household over the past year.  Below is a scan from St. Paul, Minnesota.

Continue reading

What Counts As “In Shape”?

Given where we are starting from, the average American would probably be satisfied with a fairly low bar, like “not obese” or “can run a mile without stopping”. But the kind of person who writes about the topic a lot tends to be a fitness nut insisting on crazily high standards. So what makes for a reasonable middle-ground measure?

I think the US military’s standards do. They vary by branch and are changing, but here are some previous military fitness standards from the Air Force:

Pushups and sit-ups are how many can be done in one minute

Here’s what the Marines expect from recruits before they show up for training:

The Army has a complex points system that varies by age and gender, but their minimum standards for a 20-year-old Male include: hex bar deadlift 150 lbs for 3 reps, 15 hand-release pushups within 2 minutes, plank for a minute 30, and a 2 mile run in 19:57 (plus their own sprint/drag/carry test in 2:28).

I like that the standards all involve a mix of strength and speed, and that they might take some work but should be achievable in a reasonable amount of time for a healthy person. I also like that they give stretch goals for the over-achievers in addition to their minimums.

What about the real over-achievers, the ones who want to be not just “in shape” but “in great shape” or “in excellent shape”? For them, there are the special forces fitness tests. Here’s the Green Berets:

The Navy SEALs naturally add a swim:

I’m in no way an authority on any of this, but for what it’s worth, you have my permission to say you’re in shape if you can meet any branch’s minimum requirements.

Purchasing Power in 1868: Guinness Edition

When reading an old novel or watching a period drama movie or TV show, it is almost inevitable that some historical currency amounts will be mentioned. This is especially true when the work is dealing with money and wealth, for example the series “The Gilded Age” is about rich people in late 19th century America. So money comes up a lot. I wrote a post a few weeks ago trying to contextualize a figure of $300,000 from 1883 for that show.

A new Netflix series “The House of Guinness” is another period piece that spends a lot of time focusing on rich people (the family that produces the famous beer), as well as their interactions with poorer folks. So of course, there are plenty of historical currency values mentioned, this time denominated in British pounds (the series is primarily set in Ireland, where the pound was in use). On this series, though, they have taken the interesting approach of giving the viewers some idea of what historical currency values are worth today, by overlaying text on the screen (the same way they translate the Gaelic language into English).

For example, in Episode 4 of the first season, one of the Guinness brothers is attempting to negotiate his annual payment from the family fortune. He asks for 4,000 pounds per year. On the screen the text flashes “Six Hundred Thousand Today.”

The creators of the show are to be commended for giving viewers some context, rather than leaving them baffled or pausing the show to Google it. But is 600,000 pounds today a good estimate? Where did they get this number? As with the “Gilded Age” estimate, it’s complicated, but it is probably more than you think.

Continue reading

The “Lost World” of 2% Inflation

Here is a chart of the Core Personal Consumer Index for inflation (Core PCE), which is the Fed’s favorite measure on inflation, from 1970 through early 2024:

This chart is from an article by the Richmond Fed, The Origins of the 2 Percent Inflation Target. That article has a long discussion of how and why the Fed decided to name an explicit inflation target of 2% in 2012. Although controlling inflation has been formally part of the Fed’s “dual mandate” since the Federal Reserve Reform Act of 1977, it had traditionally not set a single numerical target. After years of discussions within the Fed, it was decided that the benefits of a clear single target outweighed the potential downsides. 2% was though to be about the lowest you could run, while still giving the Fed some room to cut short term rates in a recession without running up against the dreaded zero lower bound. It was understood that 2% was a loose target, with some years a little over or under to be allowed to balance each other out.

That Richmond Fed article was published in early 2024. At that point, inflation was falling quickly and steadily from its post-Covid high, as consumers finished spending down their gigantic stimulus package windfalls.

Unsurprisingly, this article concludes that “Even during this period, long-run inflation expectations have remained anchored, rising no higher than 2.5 percent, according to the Cleveland Fed.”

That was about 18 months ago. The actual path of inflation since then has not be a descent to 2-2.5%. Between gigantic peacetime deficits by two administrations, and the results of tariffs, inflation seems to have leveled out at around 3%:

Source

The sub-2% inflation that was normal for twenty years (2000-2020) may now be a lost world.   This puts the Fed in an awkward spot. Even ignoring the irresponsible squawking from some quarters of the government, it will not be an easy decision to keep cutting rates (to address soft employment) if inflation stays this high. The Fed’s mantra this time around is that the current inflation is just a transient response to tariffs and so can be largely discounted. But I recall similar verbiage in 2021, as the Fed dismissed the ramping inflation back then as merely a transitory effect of pandemic supply chain restrictions. They were wrong then, and I suspect it would be wrong now to be too complacent. The 1970s-80’s showed that once the inflation genie gets out of the bottle, it can be very costly to subdue it. Whether 2.0 % is still the right target, however, may be open to debate.

Updating how you update

An overlooked part of being a good Bayesian is revisiting your past failures of imagination, so that past stuggles with Knightian Uncertainty can be transformed into simple failures to accurately forecast probailities.

I posted earlier today about things getting weirder, but it’s worth considering the exercise proposed by Jonathan V. Last over at The Bulwark, where he goes through his own worst case scenario from November of 2024 and then compares it to the current observed reality.

JVL provides the following list of current events that he never even considered as possible. Going through the list below, which of these would you have considered as genuine possibilities? Not whether you predicted they would happen, but whether you would have even considered in your forecast that they could happen.

I think there are only two items, maybe three on that list I would have thought of as >1% chance of happening. That’s a failure of my imagination and I don’t think I am alone. If we’re good Bayesians, I think that means not just updating our priors, but updating how we update, and opening the door to the darker parts of our imagination when forecasting going forward. No, I’m not enjoying it either.