Perspective: This Stock Correction Fear, Too, Will Pass

For what it’s worth, I will pass along a couple of points from an optimistic take on the current stock market pullback, by Seeking Alpha author Dividend Sensei. The article is “History Says Shut Up And Buy: 12 Hyper-Growth Blue Chips To Buy Right Now”. His thesis is that corrections come and go as specific fears come and go, but tech stocks only keep going up, so now is a good time to buy.

History seems to be on his side. Below is a 25-year plot of the NASDAQ 100 fund QQQ. It is true that on a really long scale, any significant dip would have been a good buying opportunity. And the run-up since 2016 has been astonishing.  $10,000 invested then would be about $50,000 now. I find it sobering, however, that (just going by eyeball) it took about fourteen years for QQQ to regain its 2000 peak. That might be longer than most investors want to wait. And in the shorter term, these tech stocks lost some 80% of their market value between 2000 and 2002, and revisited that low in 2008. We can look back now from decades later and call this a “dip”, but at the time it felt like an endless investment nightmare.

(I should add that the 2000 peak pricing was not supported by appreciable cash earnings, but by breathless hype about this new thing called the “internet” that was going to change EVERYTHING. This past year has seen similar hyperventilation over AI, but in contrast to 2000, now the big tech firms make ginormous gobs of money, and gobs more each year. So maybe it really is different this time…)

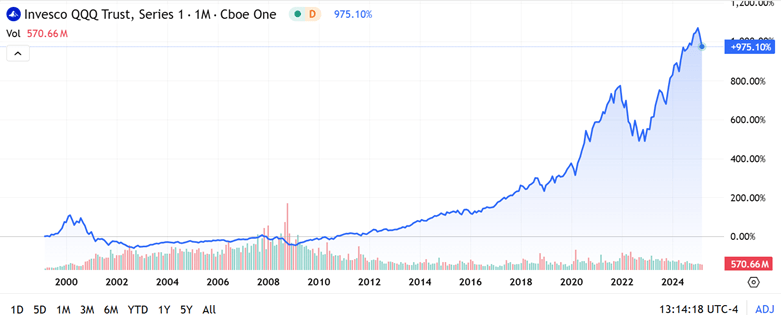
QQQ total return since March 1, 1999; % scale. From Seeking Alpha.

The Psychology of Market Corrections

The author pointed out that every correction is based on some deep fear, and eventually that fear dissipates. I thought this table he showed of the fear factors involved in the 30 or so stock market pullbacks since the March 2009 low was interesting and instructive:

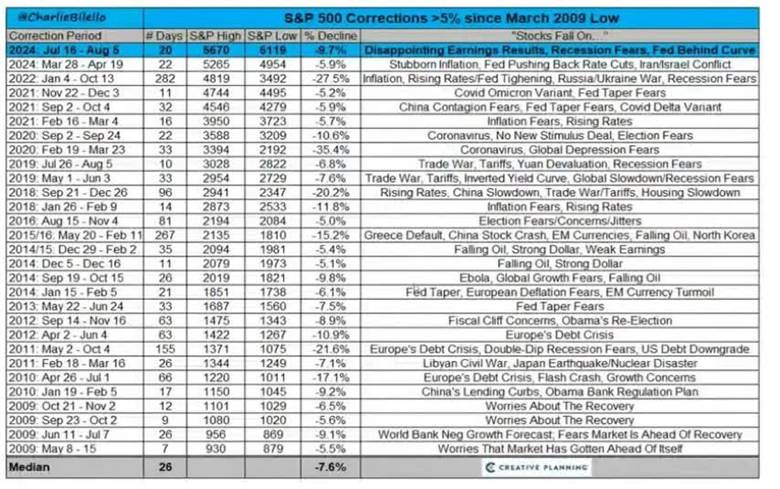
The type here may be hard to read, so I will repeat here the two most recent “fears” listed, both from 2024:

March 28-Apr 19 (5.9% drop): “Stubborn Inflation, Fed Pushing Back Rate Cuts, Iran/Israel Conflict”

July 16-Aug 8 (9.7% drop): “Disappointing earnings results, Recession Fears, Fed Behind Curve”

These are recent enough that any market-engaged reader here will resonate with these concerns which loomed so large at the time. And yet, the collective market shrugged them all off to post a robust 21% gain for all of 2024.

Where do we go from here? I have no idea. As of writing this Tuesday morning, we seem to be bumping along at a level 2-3% higher in QQQ than the lows last week, but still 10-11 % lower than a month ago. This has brought it to levels of about late September, 2024. If I look at a five-year log plot and draw an eyeball-fit straight line through it all, it seems like prices went above that line for Nov-early Feb, in a burst of post-election enthusiasm, but have now come back to the trendline. Barring some macro or geopolitical disaster, therefore, one might expect QQQ to trend 10-15 % higher in the next twelve months (with a standard deviation of another 10% or so around the trendline). But as old-time Yankees catcher Yogi Berra said, “It’s tough to make predictions, especially about the future.”

Disclaimer: Nothing here should be considered advice to buy or sell any security.

Solve for the Equilibrium, as They Say

Will they be subpoenaed? If yes, will they comply? If they comply will they be arrested? If arrested will they be tried and convicted? If convicted will they be pardoned? If pardoned will he be impeached? If at any point your deductive reasoning concludes with a “no”, then you can reason backwards inductively to why this is happening.

Homan: "We're not stopping. I don't care what the judges think. I don't care what the left thinks. We're coming."

Aaron Rupar (@atrupar.com) 2025-03-17T15:05:29.721Z

Information Regarding Russian Voting

Grok 3 beta (paid version) says this:

The Reality

  • Opposition: Genuine opposition is stifled. Prominent critics like Alexei Navalny (who died in prison in 2024) are barred from running, imprisoned, or sidelined. Parties like the Communist Party or LDPR exist but are often seen as “systemic opposition”—allowed to operate but not to seriously challenge the regime.
  • Media and Campaigning: State-controlled media heavily favors United Russia and Putin. Independent outlets face censorship, shutdowns, or exile (e.g., Meduza, TV Rain). Campaigning for opposition is restricted, with candidates disqualified on technicalities or facing harassment.
  • Voting Process: Reports of irregularities are common—ballot stuffing, coerced voting (especially among public sector workers), and inflated turnout figures. The Central Election Commission oversees it all, but it’s widely viewed as Kremlin-aligned. Electronic voting, introduced in recent years, has raised further transparency concerns.
  • Turnout and Results: Official turnout often hovers around 50-70%, though skepticism about these numbers persists. Putin’s 2024 victory, with 87% of the vote, came amid the Ukraine war and suppression of dissent, with no credible challengers.

Public Perception

Many Russians see elections as a formality—Putin’s approval, while fluctuating (per Levada Center polls, it dipped to 59% in 2018 but spiked to 80%+ after Crimea’s annexation), reflects a mix of genuine support, apathy, and resignation. Critics argue the system prioritizes stability over democracy; supporters say it’s what Russia needs given its history and external pressures.

Recent Example

The 2024 presidential election (March 15-17) was a case study: held over three days, including in occupied Ukrainian territories, with Navalny’s death fresh in memory. Three token candidates ran against Putin, none polling above single digits. Protests like “Noon Against Putin” (voters showing up at noon to signal dissent) were symbolic but powerless against the machine.

In short, Russian elections are predictable, heavily managed spectacles—less about choice, more about reinforcing the status quo. If you want specifics on a particular election or X posts about it, I can dig deeper. What angle are you curious about?

Click Read More to see the answer to my follow-up question “Explain coerced voting for public sector employees?”

Continue reading

A Forgotten Data Goldmine: Foreign Commerce and Navigation Reports

Economists rely on trade data. The historical Foreign Commerce and Navigation of the United States reports detailed monthly figures on imports, exports, and re-exports. This dataset spans decades, providing a crucial resource for researchers studying price movements, consumption patterns, and the effects of war on global trade.

The U.S. Department of Commerce compiled these reports to track the nation’s commercial activity. The data cover a vast range of commodities, including coffee, sugar, wheat, cotton, wool, and petroleum. Officials recorded trade flows at a granular level, enabling economists to analyze seasonal fluctuations, wartime distortions, and postwar recoveries. Their inclusion of re-export figures allows for precise estimates of domestic consumption. Researchers who ignore re-exports risk overstating demand by treating imports as goods consumed rather than goods in transit.

Continue reading

Michigan Consumer Surveys: Individual-Response Data

I’ve now posted individual-level responses to the 1978-2025 Michigan Consumer Surveys to Kaggle in CSV and Stata formats. The University of Michigan’s Consumer Surveys are a widely followed source for data on consumer confidence and inflation expectations:

Their official site is good if you just want summary tables or charts like this:

But what if you want detailed crosstabs to see how sentiment differs for different groups, or microdata so that you can run regressions? With enough clicks you can get this from what UMich calls their “cross-section archive“. But it is pretty hidden, my student looking into this thought they just didn’t offer individual-level data; and even once you get their data, it is in an unlabelled CSV file with hard-to-understand variable names and codes. So I wanted to make it clear that the full data with all responses for all years is available, and if you use my Stata version it is even reasonably easy to understand (the code I adapted for labelling it is on OSF). Then you can run your regressions, or make charts like this:

The College-Only Covid Recovery

If you’re new here, a reminder that you can find other cleaned-up versions of popular datasets on my data page.

US Federal Government Spending Hasn’t Decreased (Yet)

Despite DOGE and the President partially stopping some payments for some federal agencies, the changes so far aren’t visible at all in federal payments data. The Brookings Institution has put together a new tool that tracks daily spending data from the US Treasury. (My co-blogger Zach wrote about this tool last week too.) Here’s a chart from that tool showing total federal outlays by calendar year. Notice that 2025 is right on track with the past two years, or just slightly above (dollars are in nominal terms):

Of course, given the massive amount of US federal spending and the large number of agencies, we might expect it to take more than a few months to get spending under control or significantly alter its course. But this way of tracking the data is definitely picking up any changes made so far. For example, notice the flat lining of USAID funding after Trump comes into office at the end of January:

So while we don’t see any big changes yet in the aggregate spending, the few small agencies that DOGE has frozen are showing up in this data. That tells this will be a useful tool to follow going forward.

Is This a Stock Market Correction or a Bear Market?

As of the market open today, tech stocks (e.g. the NASDAQ 100 fund QQQ) are down more than 10% from their recent highs. The broader S&P 500 fund SPY is down about 8%. Hands are wringing…what does it all mean?

By applying standard definitions, we can know exactly what it means:

A pullback is a market drop of 5-10% and is very short term.  It is a dip from a recent high during an ongoing bull market while upward momentum is still intact, and is a normal adjustment to a market cycle.

The market is in correction phase” after a drop between 10-20% and can last a few months. These moves are typically met with higher volatility.  Corrections can be violent as investors’ fear levels rise and panic selling may hit the market.

Real time news and social media can intensify this fear as investors may follow the herd mentality.   The average market correction lasts anywhere between two and four months and is frequently accompanied by adverse market conditions.  However, corrections are often seen as ideal times to buy high-value stocks at discounted prices.

So, technically, the S&P has experienced a “pullback”, while the NASDAQ 100 has undergone a “correction”. Just to round out the infernal trinity of market moves with a definition of a “bear market”:

A bear market occurs after a drop of 20+% over at least a two-month time frame.  In a bear market, investor confidence has been shattered and many investors will sell their stocks for fear of further losses.  Trading activity tends to decrease as do dividend yields.

Bear markets tend to become vicious cycles when rallies are sold and not bought This happened in 2000 and 2007 and can typically be seen on charts as the market makes lower lows and lower highs.  Bear markets tend to occur in the contraction phase of the business cycle and last, on average, approximately 16 months.

You don’t know if you are really in a bear market until things get really bad, at which point it is probably too late to sell. (Amateurs get discouraged and sell AFTER stocks have dropped, which is why the average investor does appreciably worse than the accounts of dead people where stocks just sit there without being traded). When stocks recover at least 20% following a bear market over at least a two-month period, that is defined as the start of a new bull market regime.

Having a correction (i.e. 10-20% dip) in the middle of a bull market year is pretty normal. Although whole-year market returns have been positive for 34 out of the past 45 years, the typical year experiences a correction averaging 14%.

None of this vocabulary clarification answers the practical question of how bad will the current pullback/correction get? As usual, I read argument on both sides. The bears are saying (a) what they have been saying since 2018 or so, that the market is unrealistically overvalued, and (b) the macroeconomic world is about to fall apart, which they have also been saying for years. This time may be different, with the new administration’s erratic policies, but history shows that so far, the market is not much correlated to who is in the West Wing.

The bulls are saying (a) the market values did get run up unrealistically after the election and with AI hype, so the current pullback is just a healthy reset to a level for resuming further market growth, and (b) despite negative talking, the actual numbers show decent employment and GDP, so macro is OK (and it is very rare to have an actual bear market absent a serious bad macroeconomic driver).

If I really knew the answer here, I would be writing this from my private Caribbean island. But I’ll share how I am playing it. For the past 15 years or so, it has nearly always worked well to buy in after a say 10% correction. What seemed so gut-wrenching and scary at the time almost always turns into just a blip on the endlessly rising market charts in hindsight.

I had set aside some “dry powder” funds specifically to take advantage of buying opportunities like now. So, I am manfully mastering my fears and buying small amounts every couple days of 2X levered funds like SSO and QLD. (See here for discussion of such funds, they go up or down $2 for every $1 the underlying S&P or NASDAQ go up or down, so it’s kind of like being able to buy twice as much stock for the same dollar amount. But as usual, caveat emptor).

But I am not going all-in on any particular day. It is always frustrating to miss buying right at the bottom, but nobody rings a bell there, either. I have searing memories of March 2020 and of 2008 when just when you thought the bottom was in, it dropped out the next day or week.

Disclaimer: Nothing here should be considered advice to buy or sell any security.

Damage Control, today and tomorrow

Trade. Diplomacy. Aid. National Defense. Social Security. Medicaid. National Institute of Heatlh.

These are big things and they are under duress at best, out right attack at worst. It’s useful to when observers point out that bad policies are bad, that people are getting hurt, that there are consequences in play that have not been in play in since the early days of the Union. It’s useful, but what’s the next step? What is actionable?

I’m curious about the political incentives for damage control. Is there credit to be had for politicians who lay themselves on the tracks in front of an administration that seems to run on spite, to draw the kind of attention that will lead to retribution against their districts and states? Are we seeing so little action on the part of the opposition party because there is no political incentive to take action?

Put another way, how do you sell opposition to constituents as they begin the feel the pain of new policy regimes? Is it simply going on TV to lay the blame ex post or do you tell them the pain is coming in advance? Is it good politics to serve as the messenger of doom for someone else’s policies?

This isn’t building up to a big observation. I don’t know. These are just the questions I’m walking around with. There’s something about the current administration that makes political opposition feel like punching a cloud. No one is sure what the adminstration can and can’t get away with. What the courts will strike down or hold up. What the next hour’s executive order will be. How do you oppose chaos if chaos is the sole (governance) objective?

The simple answer may simply be to begin building institutions at the subnational level. That takes time, and tax dollars, to be sure, but sometimes you have to plant trees whose shade you will never sit in. It doesn’t just have to be single states, either. Why can’t New York, California, and Massachusetts have their own health consortium to prepare flu vaccines and fund research? Why can’t Texas, Oklahoma, New Mexico, and Arizona set aside resources to grow solar power generation? I don’t know how you escape federal tariffs legally, but such considerations don’t seem to be slowing down the executive branch. Why can’t California or Michigan play the same game?

I don’t know where this is going, and the entire political landscape may shift the first time Social Security checks go out a week late, but at some point the opposition will have to pivot from anger and resistance to building for a new and different governance landscape, and that will include rebuilding newer, perhaps more resilient or even redundant institutions. It’s all pie in the sky until it isn’t.

How Americans Can Thank the World

Dear World,

Thank you for the heritage of philosophical and scientific ideas, preserved through an international effort over thousands of years. Thank you for coming to study at American universities in this century, and for staying to teach.

Thank you all for buying into our heroes. What is Star Wars without a global audience? Your enthusiasm transforms our characters into shared legends. Thank you for cheering on Harrison Ford and Will Smith. Thank you for feeling the joys and heartbreaks of Taylor Swift, Luke Combs and Beyoncé. Thank you for sending us Lord of the Rings, Howl’s Moving Castle, and Squid Game.

Video games unite us all. Thanks for Elden Ring from Japan, and Minecraft, which started in Sweden before it was acquired by Microsoft. It helps us be more creative when the world buys U.S.-made games like Call of Duty and Fortnite.

Merci France, for helping us in our war of independence and giving us the Statue of Liberty. (And for printing my cartoon.)

Thank you to England, for the inheritance of a system of limited government, whose principles of common law, parliamentary tradition, and constitutional rights became the foundation upon which we built our republic.

Thank you, world, for listening to our national anthem at the Olympics. For training with us and competing against us in feats of endurance and collectively celebrating as humans have recently broken so many records of performance. Congrats to Eliud Kipchoge and Katie Ledecky.

Thank you for believing in the American Dream. The wealth enjoyed by average Americans today would not be possible without globalization.

Thank you for seeing good in us and trusting our soldiers and businesses.

Thank you for trading with us. Thanks for keeping the modern F-150 truck affordable.  Quality is better today, because it’s more powerful with stronger engines and still gets better gas mileage while being safer. Part of what keeps the price down is getting so many component parts through imports from places like Mexico and Asia.

Thank you for sharing your genuine thoughts on our social media platforms. Thank you for making the World Wide Web worldwide, starting with http://info.cern.ch.

Thailand, thank you for welcoming my college friends who do not speak your language. You gave them a break from the monotony of their local landscapes. What would our Instagram be without you, and Iceland and Ecuador? The generosity with which you welcome travelers enriches not just our photo albums, but our perspectives.

We are who we are because of you.

Trump Cutting & Spending: Day 45

It’s hard to keep up with all of the Trump administration’s activities. There is such a flurry of activity related to funding, regulations, and executive actions that no one can keep up with everything. Individuals and news outlets have scarce resources and attention. There’s the added typical challenge of filtering out fact from analysis. If only there was way to summarize the administration’s activities in an objective and meaningful sense.

Luckily, numbers don’t lie – and the federal government publishes a lot of numbers. Specifically, they publish the Daily Treasury Statement which identifies each day’s various categories of outlays. We can look at the raw number of spending to get a sense for where and whether Trump is changing spending within the federal government.

Lauren Bauer at The Hamilton Project noticed that the US Treasury has an API for those daily statements.  She created a nice online tool at Brookings that is relatively user friendly. Individuals can visit and see each day’s spending or the cumulative spending throughout the year. Below is the cumulative federal spending for 2024 and 2025. As of March 5th, the US has spent a total of 5.2% more in 2025 than in the year prior (that’s on track with the growth rate of GDP). Importantly, she makes all of the data available for download so that individuals can conduct their own analysis. I lean on her data here.

Where have the cuts been happening? The below graph includes the 5 spending areas that have been most deeply cut relative to the same day in 2024.* The red line denotes inauguration day. The USAID cuts made big news, and it seems like they knew something was happening around the time of inauguration. It looks like they were trying to get spending out the door before the taps were shut off. The FCC and the Library of Congress were also affected by the funding freeze that was announced in late January.

President Trump claims to have made cutting waste a priority. With Elon Musk in tow, the administration has made waves by disrupting USAID, the NSF, and federal payroll. We’re 45 days into the administration. We can use the data provided by the Treasury and made accessible by Bauer to evaluate how the Trump administrations has been spending and cutting according to the numbers.

One way to evaluate spending is to compare the cumulative spending over the course of 2024 and 2025. That is, spending on the 45th day of the year should be more or less comparable in 2024 vs 2025. It’s still early in the year and since various payments can be quite irregular, there’s a lot of noise in the data so far. But we should be able to see big changes. Smaller changes will be easier to see as the year goes on.

The 5 areas of greatest cumulative spending growth relative to 2024 are graphed below.* It does look like some funding was trying to get out of the door prior to Trump taking office, but that’s just speculation on my part.   FEMA spending was up, likely due to the fires in California.  Much more US Treasury spending is happening, specifically for Claims, Judgments, & Relief. We might see that remain elevated as the new administration keeps ‘trying’ things and then being stopped by injunctions, being the subject of lawsuits, and owing compensation.

While big percent changes in outlays can have massive implications for individual programs, Musk and Trump will need to cut huge amounts in order to claim any kind of victory over profligate spending. (Just so we’re all on the same page, they will fail if they refuse to touch old-age entitlements.) Where have the biggest spending cuts happened as measured by actually dollars? See below.*** The deepest and most consistent cuts are coming from the reductions in federal employee insurance payments. Similarly, the USAID and FCC cuts amount to a $2 billion cut from this time last year. Department of Education spending and the hospital insurance trust fund are down, but are also more volatile in their expenditures. Those one-time spikes in the data are due to pay dates between 2024 and 2025 being offset by a day or two.

Continue reading