This is an update to a previous post that I did on per-capita real consumption in 1990 vs 2021. As of 2021, we still weren’t sure after the pandemic what was transitory vs structural, and it was unclear whether incomes would keep up with inflation. We now have three more years of data through 2024. News flash: We’re even richer.
I like to use the BEA real quantity indices. Those track what is actually consumed in volumes rather than by deflating total spending by price indices. Divided by population, we can calculate the real quantities of goods and services that people actually consumed per capita.
Even after the pandemic policies have settled down, we are still SO MUCH RICHER – and even richer than we were with all of the pandemic-related stimulus. The worst consumption category since the pandemic has been food and beverage for off-premise consumption, and that is *up* 4.6% since 2020, increasing 31% since 1990. So, while I understand that people can’t enjoy the the low prices of yesteryear, we are still better off in that category than pre-pandemic. In the other categories, everything is awesome.
Since 1990, our consumption of communication services has risen 332%, our houses are 254% better furnished, and we have 118% greater quality-adjusted clothing consumption. All of this is already adjusted for inflation and is per-capita. Since the pandemic, these numbers are still up by 20.4%, 9.8%, and 31.1% respectively. People didn’t like the post-pandemic inflation. I get that. But these improvements in average consumption are mind boggling.
“One of the closest guarded secrets in American higher education is the average teaching loads of faculty.” -Richard Vedder
I saw this quote in a recent piece arguing that US professors should teach more. I thought it sounded extreme, but as I look into it, it is surprisingly difficult to find data on this compared to other things like salaries:
Since 1996, for instance, the University of Delaware has administered the annual National Study of Instructional Costs and Productivity, surveying faculty and teaching assistants about course loads and enrollment. The data, though, are “only available to four-year, non-profit institutions of higher education.”[7] This secrecy, needless to say, is not the norm for surveys collected by publicly supported institutions. Tellingly, this study is being discontinued because the number of participating institutions “has slowly declined to unsustainable levels.”[8] *
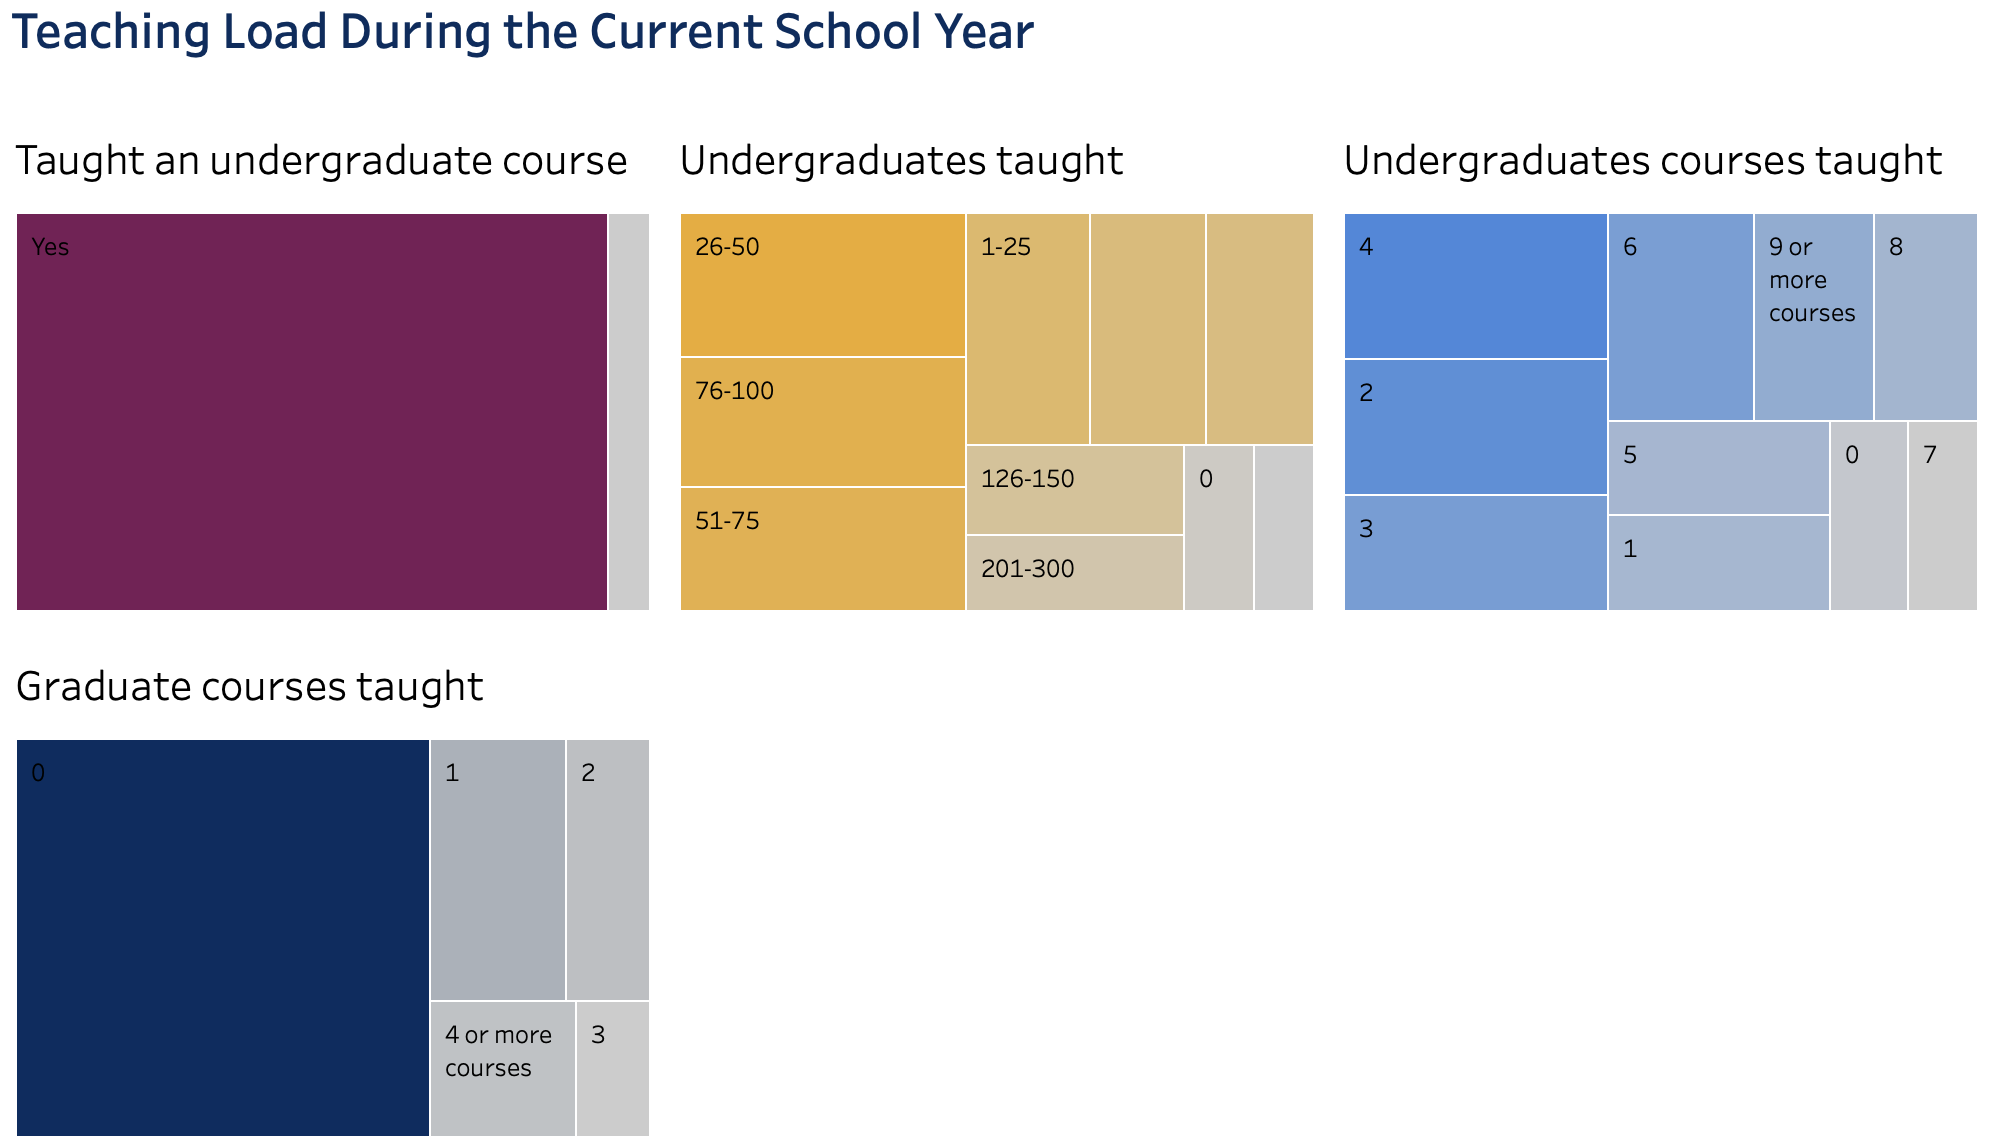
There are some decent older studies that are public, like this 2005 survey of top liberal arts colleges showing that almost all have teaching loads between 4 and 6 courses per year. But in terms of recent data that is publicly available, the best I’ve found is the Faculty Survey of Student Engagement. It still isn’t great, since their 2024 survey only covers 54 of the 2000+ bachelor’s degree granting colleges in the US, and their tables show that these 54 aren’t especially representative. They make nice graphics though:
The graphics show exact percentages if you hover over them on the original Tableau site. Doing this shows that the median professor teaches 4 undergraduate courses per year. Knowing the full distribution would require the underlying data they don’t share, but from these graphics we can at least compute a rough average (rounding 4+ graduate courses to 4 and 9+ undergraduate courses to 9).
This shows that the average professor teaches 4.43 undergraduate courses and 0.75 graduate courses, for a total of 5.18 courses per academic year. If I restrict the data to full-time tenured or tenure-track professors, they teach an average of 4.72 undergraduate courses and 0.91 graduate courses, for a total of 5.63 courses per academic year.
Overall these loads are higher than I expected, especially since the survey sample is skewed towards research schools. But its still lower than the standard 3-3 load at my own institution, and low enough that it makes for a great job, especially compared to teaching K-12.
Overall though I don’t know why we need to rely on one-off surveys to get data on teaching loads, it seems like data the US Department of Education should collect from all accredited schools and share publicly.
*The Delaware Cost study is not just discontinuing new surveys, they plan to pull down existing data by December 15th 2025. Only schools that participate in their survey get access, so I can’t get the data, but perhaps some of you can.
We all know that homicides spiked in the US in 2020 and we all (hopefully) know that homicides have been falling across most of the country dramatically since the end of 2021. But have homicides started to get back to, or even below, pre-pandemic levels? Or is it merely reversing the 2020 increases?
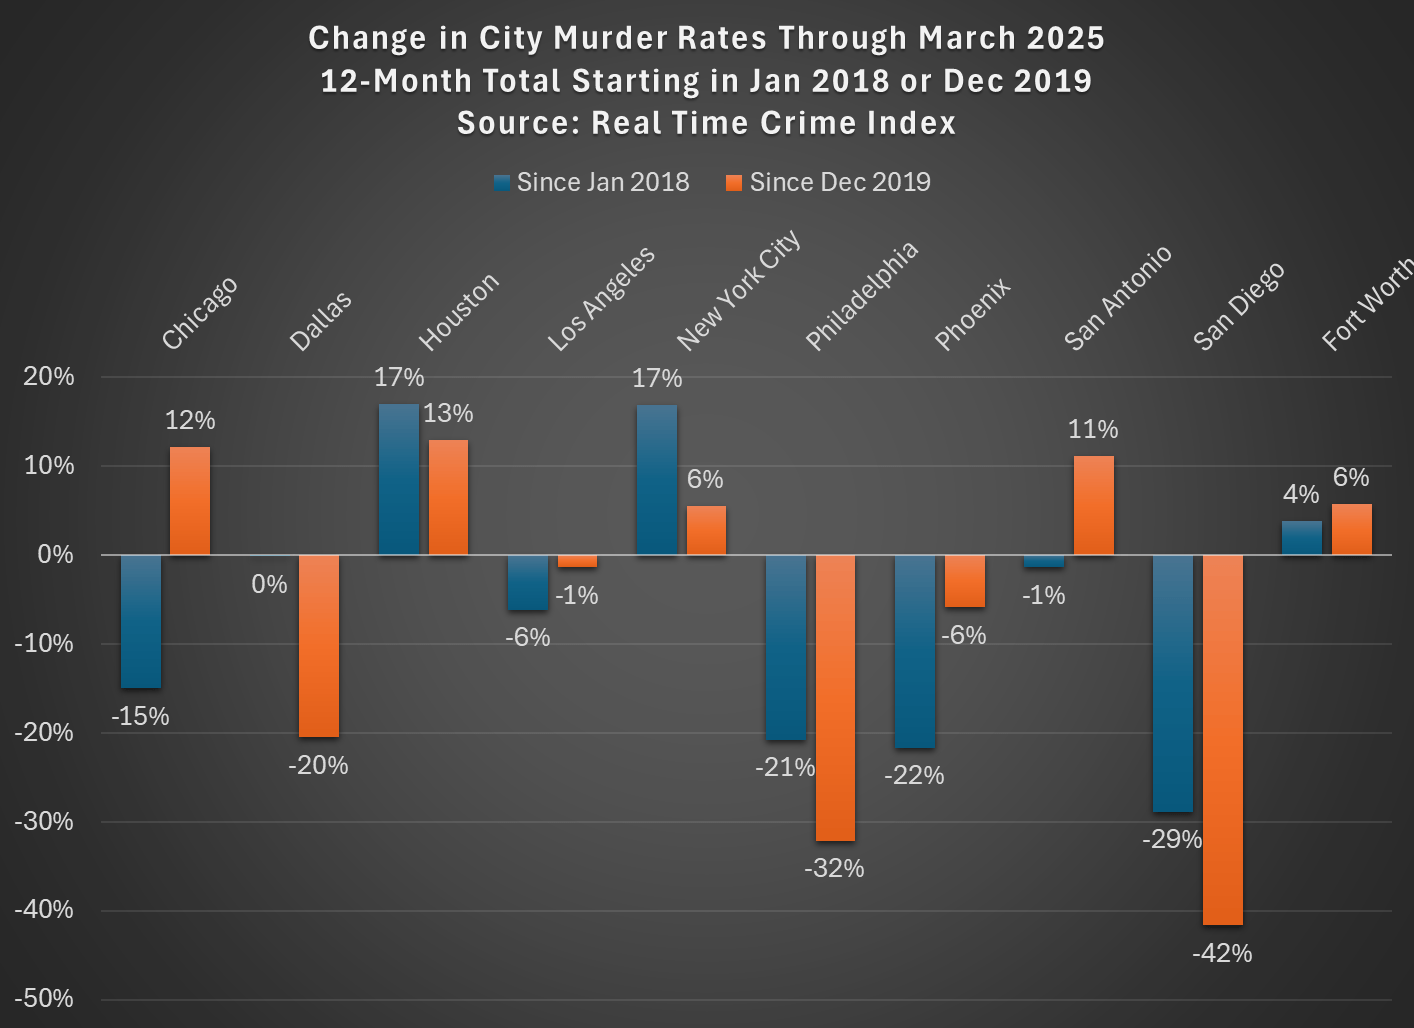
The answer depends on the city and the pre-pandemic baseline! The chart below shows the 10 largest cities (with Fort Worth instead of Jacksonville, because the Real-Time Crime Index doesn’t include the latter) in the US, using a base of either January 2018 (the first month in the RTCI) or December 2019 (just before the pandemic, and murders had fallen nationally between these two dates):
The murder data comes from the Real-Time Crime Index, and it is a 12-month total so we shouldn’t have to worry about seasonality even though the months are different. I use Census annual city population estimates to calculate the rates (and estimate 2025 based on the growth from 2023-24).
As you can see, depending on the base timeframe used, about half of the cities saw declines, a few were roughly flat, and some definitely saw increases. New York, Houston, and Fort Worth are definitely still elevated. Los Angeles, Philly, Phoenix, and San Diego are definitely down. The others are either close to even or mixed depending on your baseline.
Keep in mind these data are only through March 2025. As both Billy Binion at Reason and Jeff Asher have both recently emphasized, if we use the most recent data for many cities, it’s entirely possible that 2025 will end up having some of the lowest homicide rates ever recorded for many US cities. The declines in early 2025 have definitely been big, but mostly they are just a continuation of the post-2021 decline.
Again, for clarification, all of these cities are down from their 2020-21 peaks: using September 2021 as the base (when the national murder rate roughly peaked), these 10 cities are down between 31% and 58%. Big improvements!
Yesterday I got a scary-sounding text message, claiming that I have an outstanding traffic ticket in a certain state, and threatening me with the following if I did not pay within two days:
We will take the following actions:
1. Report to the DMV Breach Database
2. Suspend your vehicle registration starting June 2
3. Suspension of driving privileges for 30 days…
4. You may be sued and your credit score will suffer
Please pay immediately before execution to avoid license suspension and further legal disputes.
Oh, my!
A link (which I did NOT click on) was provided for “payment”.
I also got an almost (not quite) identical text a few days earlier. I was almost sure these were scams, but it was comforting to confirm that by going to the web and reading that, yes, these sorts of texts are the flavor of the month in remote rip-offs; as a rule, states do not send out threatening texts with payment links in them.
These texts are examples of “smishing”, which is phishing (to collect identity or bank/credit card information) via SMS text messaging. It must be a lucrative practice. According to spam blocker Robokiller, Americans received 19.2 billion spam robo texts in May 2025. That’s nearly 63 spam texts for every person in the U.S.
Beside these traffic ticket scams, I often get texts asking me to click to track delivery of some package, or to prevent the misuse of my credit card, etc. I have been spared text messages from the Nigerian prince who needs my help to claim his rightful inheritance; I did get an email from him some years back.
The FTC keeps a database called Sentinel on fraud complaints made to the FTC and to law enforcement agencies. People reported losing a total of $12 billion to fraud in 2024, an increase of $2 billion over the previous year. That is a LOT of money (and a commentary on how wealthy Americans are, if that much can get skimmed off with little net impact on society). The biggest single category for dollar loss was investment; the number of victims was smaller than for other categories, but the loss per victim ($9,200) was quite high. Other areas with high median losses per capita were Business and Job Opportunities ($2,250) and Mortgage Foreclosure Relief and Debt Management ($1,500).
Imposter scams like the texts I have gotten (sender pretending to be from state DMV, post office, bank, credit card company, etc.) were by far the largest category by number reported (845,806 in 2024). Of those imposter reports, 22% involved actual losses ($800 median loss), totaling a hefty $2,952 million. That is a juicy enough haul to keep those robo frauds coming.
How to not get scammed: Be suspicious of every email or text, especially ones that prey on emotions like fear or greed or curiosity and try to engage you to payments or for prying information out of you. If it purports to come from some known entity like Bank of America or your state DMV, contact said entity directly to check it out. If you don’t click on anything (or reply in any way to the text, like responding with Y or N), it can’t hurt you.
I’m not sure how much they can do, considering the bad guys tend to hijack legit phone numbers for their dirty work, but you can mark these texts as spam to help your phone carrier improve their spam detection algorithm. Also, reporting scam texts to the U.S. Federal Trade Commission and/or the FBI’s Internet Crime Complaint Center can help build their data set, and perhaps lead to law enforcement actions.
Later add: According to EZPass, here is how to report text scams:
You can report smishing messages to your cell carrier by following this FCC guidance. This service is provided by most cell carriers.
Hold down the spam TXT/SMS message with your finger
Select the “Forward” option
Enter 7726 as the recipient and press “Send”
Additionally, to report the message to the FBI, visit the FBI’s Internet Crime Complaint Center (ic3.gov) and select ‘File a Complaint’ to do so. When completing the complaint, include the phone number where the smishing text originated, and the website link listed within the text.
Which isn’t to say that there aren’t monsters who have found their way into and adjacent to power, but they are always limited by the beliefs held by the people on the ground doing the dirty work. The revelation in the quote below is that for all the cruelty and uncertainty being imposed by ICE, USBP, and the agents deputized from local law enforcement, it isn’t meeting the ambitions of those who want more than terror and lib-owning headlines. They know their days are limited and that to make the America, at the margin, as Whiter as is possible, and to do so they need the broadest possible net cast based on little more than racial/ethnic density:
The Washington Examiner (the conservative news outlet) reports that Stephen Miller screamed at ICE officials: "What do you mean you're going after criminals? Why aren't you at Home Depot? Why aren't you at 7-Eleven?" Kinda blows up the narrative that they care about public safety.
What’s limiting them is that for as much selection as there is on politics, information sources, and social networks into the individual agents on the ground, their aren’t enough who actually want to maximize thecruelty and racial homogeneity. Most, I strongly suspect, just want to do their jobs. Many, I hope, no doubt do buy the false narratives of immigrant criminality, but those who mirror the darkest ambitions are probably (hopefully) too few in number to produce the outcomes desired by the architects of the current national travesty that shames us all.
So keep doing to the little things that keep the false narrives from becoming folk wisdom. The conversations across weak social ties that run counter to the fear-mongering and deception. Every agent and field officer who, consciously or unconsciously, finds themselves doubting the wholesale slandering of immigrants and racial groups is more sand in the gears slowing a machine that is on borrowed political time. Every day lost is a day won. Every TACO a month. Every court case a quarter. Just keep slowing it down.
Ms. Armas Perez has written a current summary of the fast fashion landscape, including quotes from professors like me and industry executives.
Here’s one quote about me:
Joy Buchanan, an associate professor of Quantitative Analysis and Economics at Samford University, expanded on this idea: “Fast fashion is partly just a sign of a richer world. We can all have more of everything, including customized clothes.” In a world where clothing is cheaper than ever, the desire to reinvent oneself through fashion isn’t just encouraged—it’s expected. “Now that T-shirts are so cheap to make, it’s not surprising that people print them up for a single club event with little thought about the financial or environmental cost. Financially speaking, shirts are almost as disposable as plastic forks,” said Buchanan.
About the publication: The Politic is Yale’s undergraduate journal of politics and culture since 1947. The way people end up finding me to comment on this issue is my original piece for Cato from 2023.
The widespread availability and easy user interface of artificial intelligence (AI) has put great power at everyone’s fingertips. We can do magical things.
Before the internet existed we would use books to help us better interpret the world. Communication among humans is hard. Expressing logic and even phenomena is complex. This is why social skills matter. Among other things, they help us to communicate. The most obvious example of a communication barrier is language. I remember having a pocket-sized English-Spanish dictionary that I used to help me memorize or query Spanish words. The book helped me communicate with others and to translate ideas from one language to another.
Math books do something similar but the translation is English-Math. We can get broader and say that all textbooks are translation devices. They define field-specific terms and ideas to help a person translate among topic domains, usually with a base-language that reaches a targeted generalizability. We can get extreme and say that all books are translators, communicating the content of one person’s head to another.
But sometimes the field-to-general language translation doesn’t work because readers don’t have an adequate grasp of either language. It isn’t necessarily that readers are generally illiterate. It may be that the level of generality and degree of focus of the translation isn’t right for the reader. Anyone who has ever tried to teach anything with math has encountered this. Students say that the book doesn’t translate clearly, and the communication fails. The book gets the reader’s numeracy or understood definitions wrong. Therefore, there is diversity among readers about how ‘good’ a textbook is.
Search engines are so useful because you can enter some keywords and find your destination, even if you don’t know the proper nouns or domain-specific terms. People used to memorize URLs and that’s becoming less common. Wikipedia is so great because if you want to learn about an idea, they usually explain it in 5 different ways. They tell the story of who created something and who they interacted with. They describe the motivation, the math, the logic, the developments, and usually include examples. Wikipedia translates domain-specific ideas to multiple general languages of different cognitive aptitudes or interests. It scatters links along the way to help users level-up their domain-specific understanding so that they can contextualize and translate the part that they care about.
Historical translation technology was largely for the audience. More recently, translation technology has empowered the transmitters.
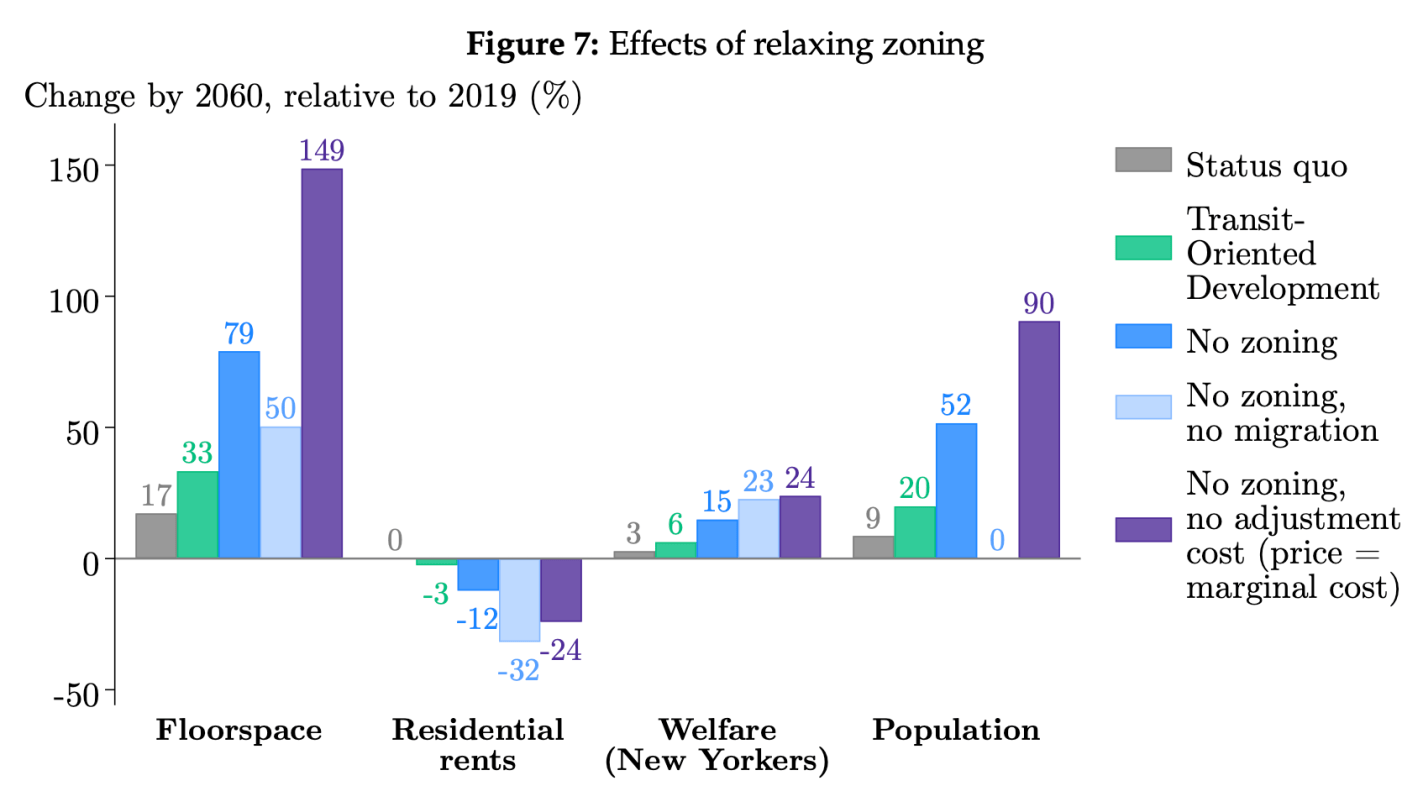
Most US cities make it hard for housing supply to meet demand because of rules that prevent large apartment buildings. Usually cities do this with zoning rules that limit the number of homes per parcel, often to as low as 1. New York City relies more on rules about Floor Area Ratio (the ratio of the floor area to the area of the parcel). But how binding are these rules? If we relaxed or repealed them, how much new construction would we see, and where would we see it?
I build a dynamic general equilibrium model of the supply and demand of floorspace in a city , which I estimate using a novel parcel-level panel dataset of land use and zoning in New York City. I validate the model using quasi-experimental variation from recent zoning reforms and use it to simulate the effects of zoning changes on construction and prices.
He finds that eliminating these rules in NYC would lead to a construction boom, with a 79% increase in the amount of floor space available by 2060. This would allow many more people to live in New York, with a 52% increase in population; but many of the benefits would go to existing NYC residents, with more floor space per person and modestly lower rents leading to higher wellbeing:
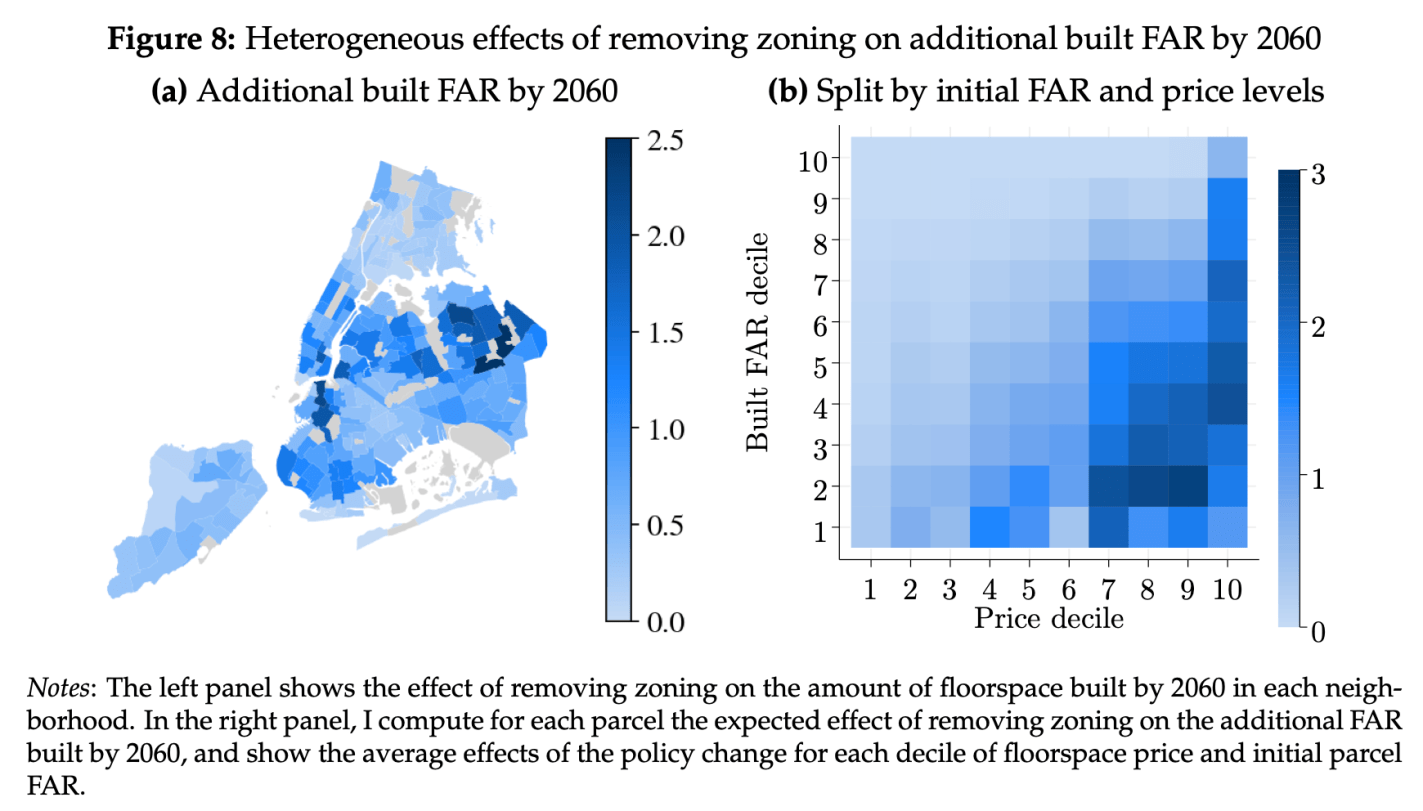
Where exactly would we see the building boom? Not Manhattan, but Brooklyn and Queens. The intuition is that zoning is most binding in places where housing prices are currently high but where the buildings are currently small; this is where there is the biggest incentive to tear down existing buildings and build taller if you are allowed to.
According to the U.S. Department of Agriculture, feral hogs cause approximately $2.5 billion in agricultural damages each year…Nearly 300 native plant and animal species in the U.S. are in rapid decline because of feral swine, and many of the species are already at risk, according to Animal and Plant Health Inspection Service. The swine also carry at least 40 parasites, 30 bacterial and viral illnesses, and can infect humans, livestock and other animals with diseases like brucellosis and tuberculosis.
…They will also feed on tree seeds and seedlings, causing significant damage in forests, groves and plantations… Rooting — digging for foods below the surface of the ground — destabilizes the soil surface, uprooting or weakening native vegetation, damaging lawns and causing erosion. Their wallowing behavior destroys small ponds and stream banks, which may affect water quality. They also prey upon ground-nesting wildlife, including sea turtles. Wild hogs compete for food with other game animals such as deer, turkeys and squirrels, and they may consume the nests and young of many reptiles, ground-nesting birds and mammals.
Pigs are smart (ahead of dogs and horses), tough, and adaptable, and they breed very quickly. The protected, overfed, calm hogs you see on farms quickly turn lean and mean if they have to fend for themselves in the wild. You pretty much only see female pigs or castrated males on the farm, since whole males (boars) are intrinsically aggressive and destructive. But vigorous 200-pound boars, with their 3 inch-long, razor-sharp tusks, are well-represented in feral swine.
This is a growing problem. The population of wild pigs in the southern third of the U.S. has increased significantly in the past few decades. There have historically been some wild pigs in spots like Florida and Texas, escapees from Spanish settlers long ago. But they seem to be spreading northward, largely because hunters transplant them:
From 1982 to 2016, the wild pig population in the United States increased from 2.4 million to an estimated 6.9 million, with 2.6 million estimated to be residing in Texas alone. The population in the United States continues to grow rapidly due to their high reproduction rate, generalist diet, and lack of natural predators. Wild pigs have expanded their range in the United States from 18 States in 1982 to 35 States in 2016. It was recently estimated that the rate of northward range expansion by wild pigs accelerated from approximately 4 miles to 7.8 miles per year from 1982 to 2012 (12). This rapid range expansion can be attributed to an estimated 18-21% annual population growth and an ability to thrive across various environments, however, one of the leading causes is the human-mediated transportation of wild pigs for hunting purposes.
As for pigs attacking and killing humans, a definitive study was recently made in 2023 by Mayer, et al., covering 2000-2019. This report includes informative tables and charts, such as:
and
Comparison of mean annual number of human fatalities from attacks by various wild animals for time periods ranging between 2000 and 2019. From Mayer, et al.
About half of these fatalities occurred in rural regions of India. Government policies there prohibit farmers from killing marauding pigs, so farmers try to chase them away from their fields with rakes and stones. Sometimes that provokes the pig to attack, slashing at thigh level and often lacerating the femoral artery. But a disturbing 39% of deadly attacks were unprovoked, including a horrific case with an elderly woman in Texas. So danger to humans is an issue, though for perspective, far more people are killed each year by snakes (100,000), rabid dogs (30,000), and crocodiles (1000). In the U.S., over 100 people are killed a year, and 30,000 injured, by collisions with deer (see here for a market-based solution for this problem).
What to do? Hunters in many states are free to blast away at feral pigs year-round, since they are considered a harmful, invasive (non-native) species. Paradoxically, however, allowing hunting of pigs can be counterproductive: amateur hunting does not eliminate enough pigs to stop their spread, and it incentivizes hunters to transport pigs to new regions to make for more targets. For instance, Arkansas allows hunting and even transport of pigs, and has seen swine populations skyrocket. The state of Missouri, next door, took the enlightened approach of banning hunting and transport, leaving population control to wildlife professionals. By removing the sport-hunting incentive, Missouri removed the incentive to transport them, which stymied their spread.
To control pig populations, the pros mainly set up baited large corrals, and monitor them remotely with webcams. After several weeks, the local pigs get comfortable coming there to feed. When the cameras show that every single pig in the herd is in the corral, the gate is sprung shut remotely. Then the pros drive out to, er, euthanize the pigs. The goal is to wipe out the entire herd, and leave no sadder-but-wiser survivors who will be harder to catch next time. Once a hog population has become established in an area, it typically takes ongoing eradication efforts to keep the numbers down.
If you want to do your own part to reduce the surplus swine population, the following notable opportunity came to my attention: for a largish fee the Helibacon company will train you in firing automatic weapons and take you up in a chopper where you can mow down a marauding herd in the low Texas scrubland. It sounds like a guy thing, but Helibacon reminds us that full auto is for ladies, too. See also PorkChoppersAviation for similar service.
This is actually a fine example of a free market solution to a problem: wild hogs were such a problem for landowners that they were paying expensive professional helo hunters to take out herds, but in Texas, “All that changed in 2011, when the state legislature passed the so-called pork chopper law, which allowed hunters to pay to shoot feral hogs out of helicopters – and a new business model was born.” Hunters are happy to pay to hunt, helo companies are happy to take their money, and landowners are happy to have pigs reduced for free. Voila, voluntary exchange creates value…