Here I will draw on a recent article Leads And Lags: Timing A Recession by Seeking Alpha author Eric Basmajian. His overall points are (1) that some indicators are associated with leading segments of the economy (which have historically turned down well before the rest), while others are more lagging, and (2) the leading indicators are strongly flashing recession. Direct quotes from his article are in italics.
Leading Economy, Cyclical Economy & Total Economy
When economic data is released, the information should be contextualized based on where the data point falls in the economic cycle sequence.
We can separate the economy into three buckets: the Leading Economy, the Cyclical Economy, and the Total Economy.
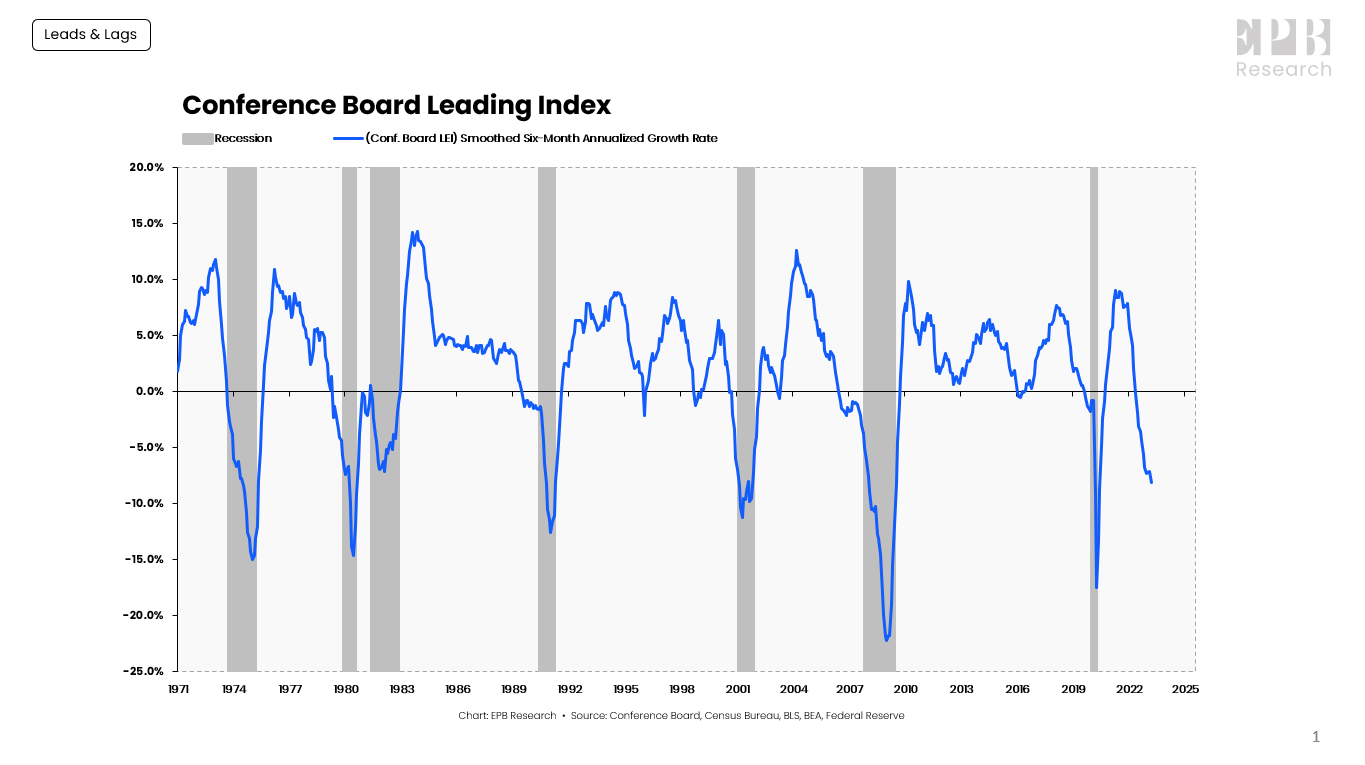
The Leading Economy is defined by the Conference Board Leading Index, which is a basket of ten leading economic variables such as building permits, new orders, and stock prices.
The Leading Index has turned negative before every recession, without exception.

Conference Board, Census Bureau, BLS, BEA, Federal Reserve
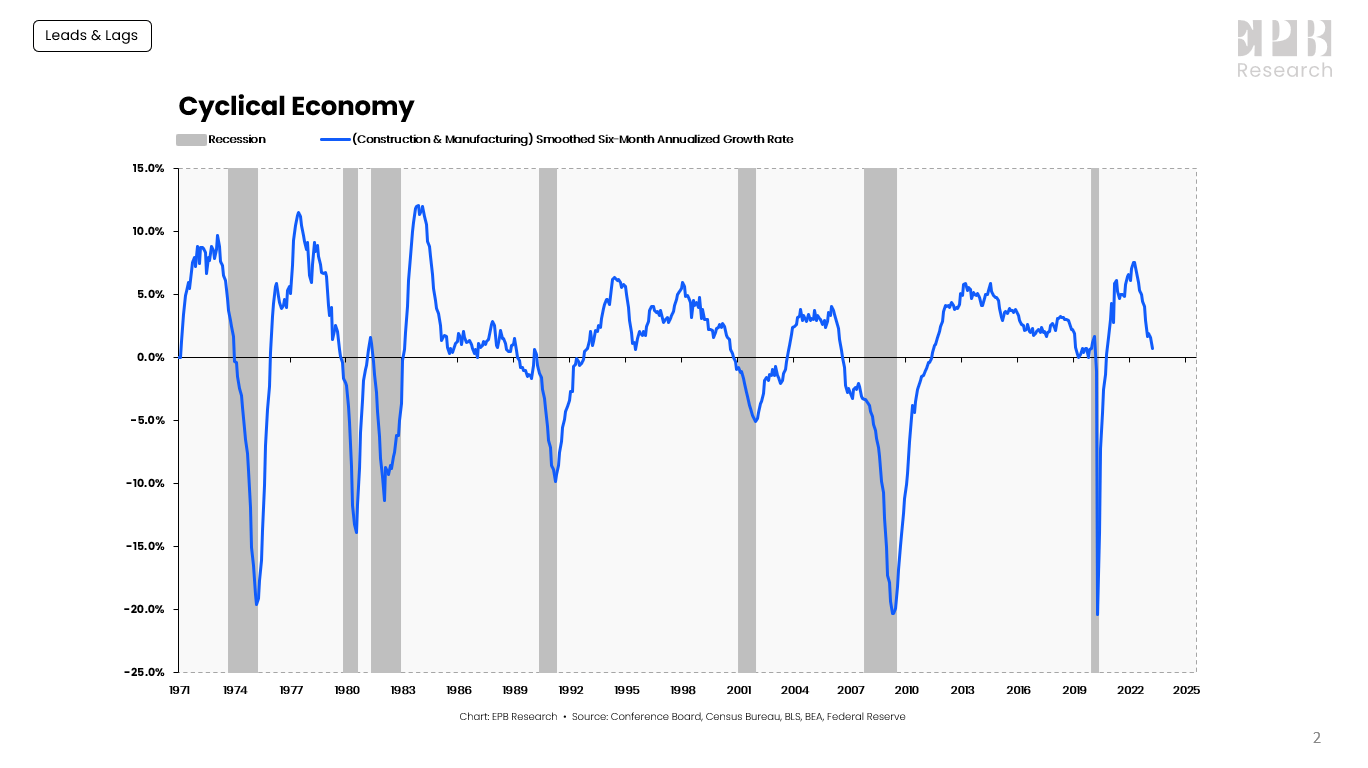
The Cyclical Economy represents the construction and manufacturing sectors. The Cyclical Economy is the driving force behind recessions, always turning negative before the Total Economy, and never giving a false signal; when the Cyclical Economy turns negative, the Total Economy turns negative several months later.

Conference Board, Census Bureau, BLS, BEA, Federal Reserve
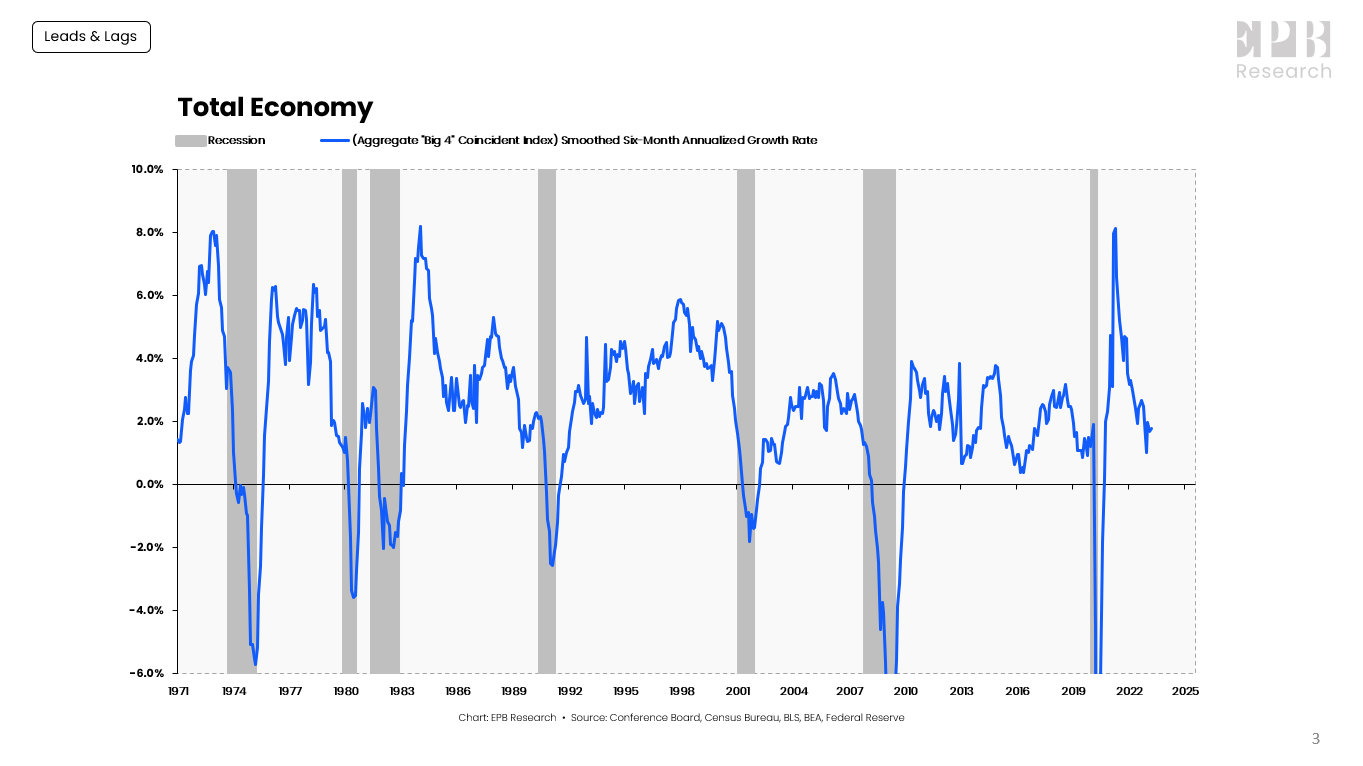
The Total Economy is defined by the “Big-4” Coincident Indicators of economic activity. Nonfarm payrolls, real personal income less transfer payments, real personal consumption, and industrial production are four major economic indicators that the NBER uses as the core of their recession dating procedure.

Conference Board, Census Bureau, BLS, BEA, Federal Reserve
A sustained contraction in the “Big-4” Coincident Indicators is the definition of a recession.
The Total Economy starts showing contracting growth rates about four months into the recession.
Could This Time Be Different?
If we do finally get a recession, it will be probably the most long-expected recession ever. Pundits have been warning for over a year that the Fed’s well-telegraphed program of rate hikes will crater the economy, as the only way to tame inflation.
According to Basmajian, When the Leading Economy and Cyclical Economy are both lower than -1%, a recession, as dated by the NBER, occurred an average of 5 months later, with a range of a 4-month lag to a 14-month lead.
His Leading indicator went negative about 11 months ago (June, 2022). However, it looks like the economy is still humming along and employment remains robust. His Cyclic Economy is on track to go negative right about now, but that has an unusually long lag between Leading and Cyclical:
The Cyclical Economy will likely turn negative with April data and potentially below -1% by May data should the current downward slope remain.
That would push the lag between the Leading Economy and the Cyclical Economy to 11 months, the longest on record.
And the lag before we finally get a bona fide recession in the Total Economy may keep dragging out longer yet. There is even a possible Soft Landing scenario where the rate hikes manage to cool the economy down without causing a severe recession at all.
It seems to me that we collectively are still spending down our excess pandemic benefits, and no recession will come till we finish running through those monies.


