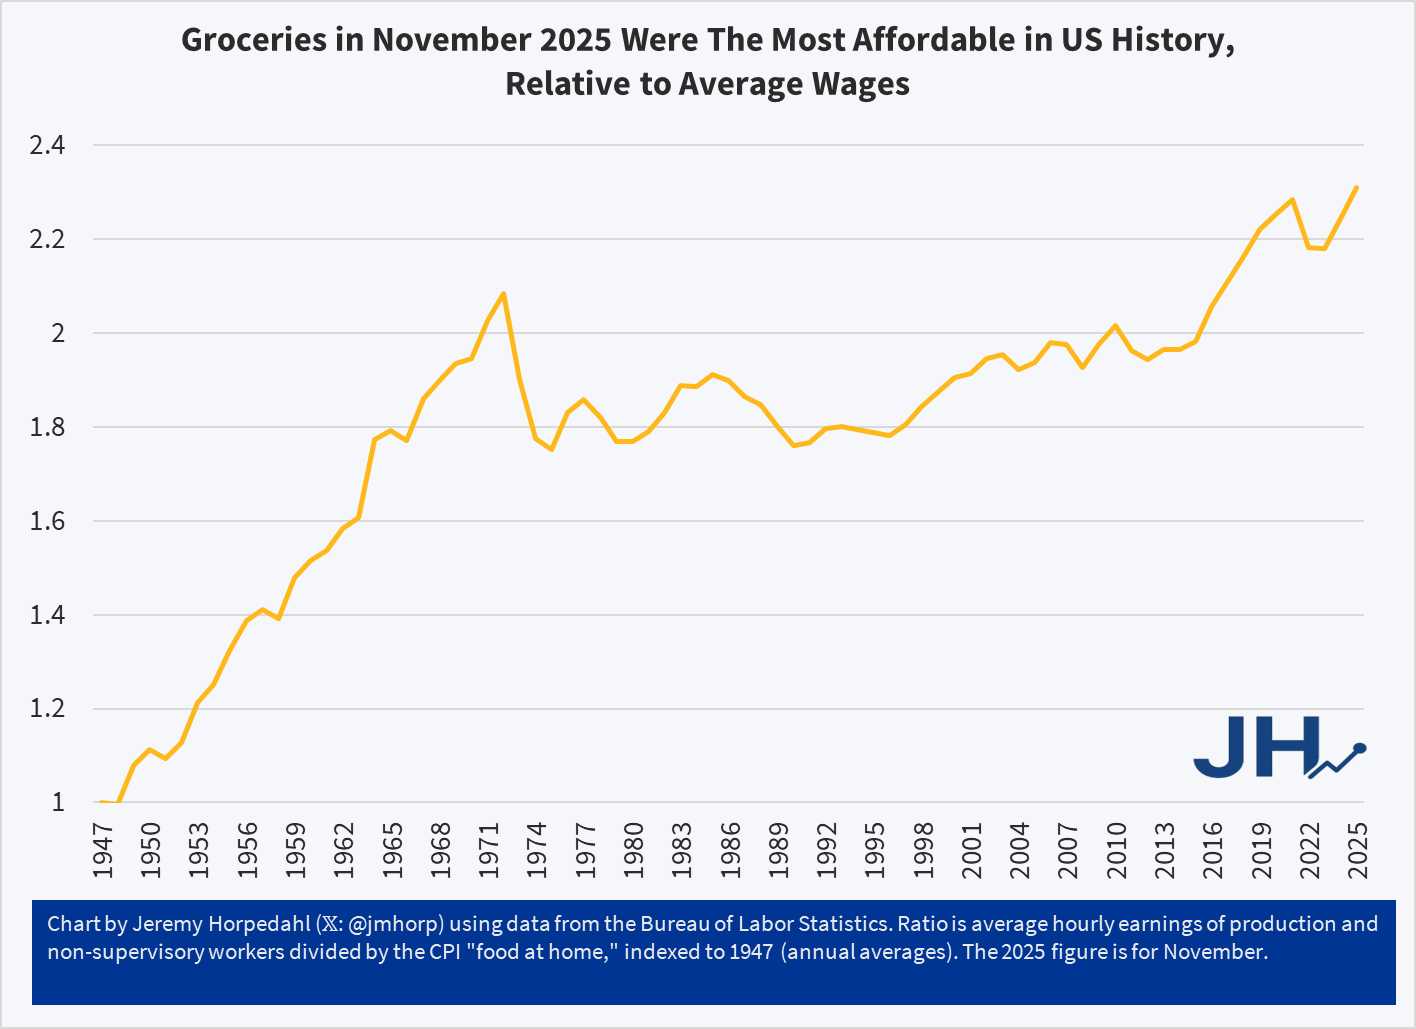
The chart shows a simple measure of relative grocery affordability. Starting with the levels of wages and grocery prices in 1947, if in any year wages increase more than prices, the line goes up (it can also go down, as it does in some years). Cumulatively, you can see that today groceries are over twice as affordable as in 1947.
You could reasonably complain that there hasn’t been much progress since the early 1970s. Fair enough. But there has been significant progress since the 1990s. Even if the progress is less than we would have liked, groceries are still, right now, the most affordable they have ever been in the US relative to average wages. And since US consumers spend by far the lowest share of their income on groceries in the world, we might be tempted to say that right now groceries in the US are the most affordable they have ever been in human history. Period.
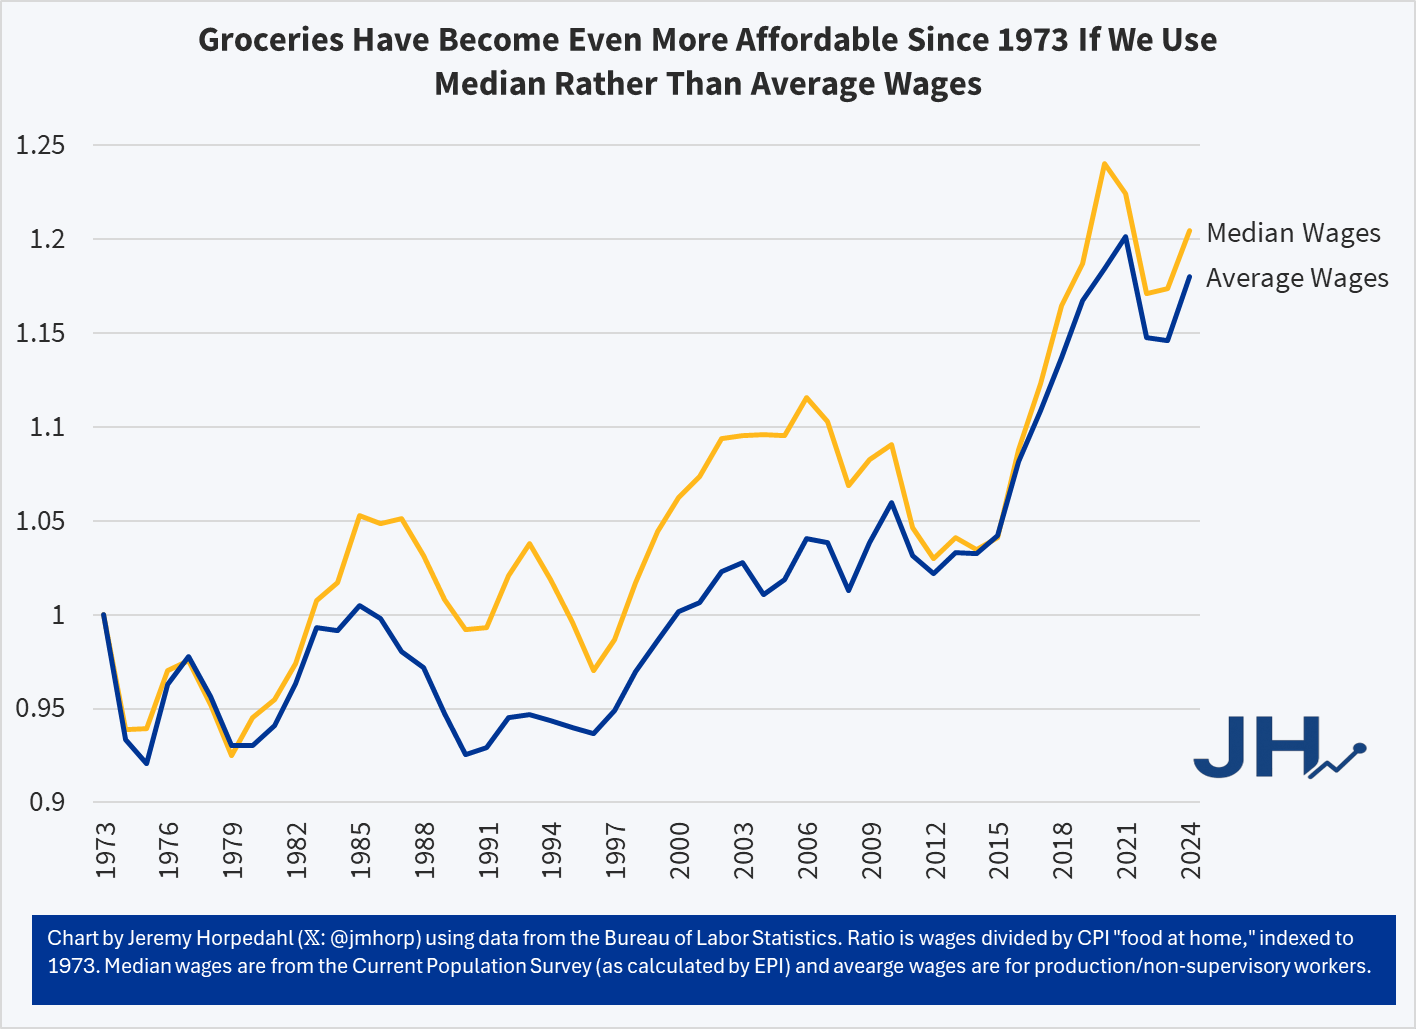
This is not just a trick of using average wages, which can be distorted by outliers. First, we are already using an average wage series that strips out the highest earners (supervisors, managers, etc.). But we can show this more clearly by using a median-wage series, such as the CPS series (calculated by EPI) starting in 1973. Notice this affordability trend gets slightly better if we use median wages from 1973-2024:
It’s true that using the median wage series, 2020 and 2021 look more affordable than 2024 — but that’s because the compositional effects of the job losses in the pandemic really throw off the median wage. But the growth rate since 1973 is slightly better for median rather than average wages — it’s not a trick! And when we have the median wage data for 2025, it will also likely be the most affordable measure on this chart.
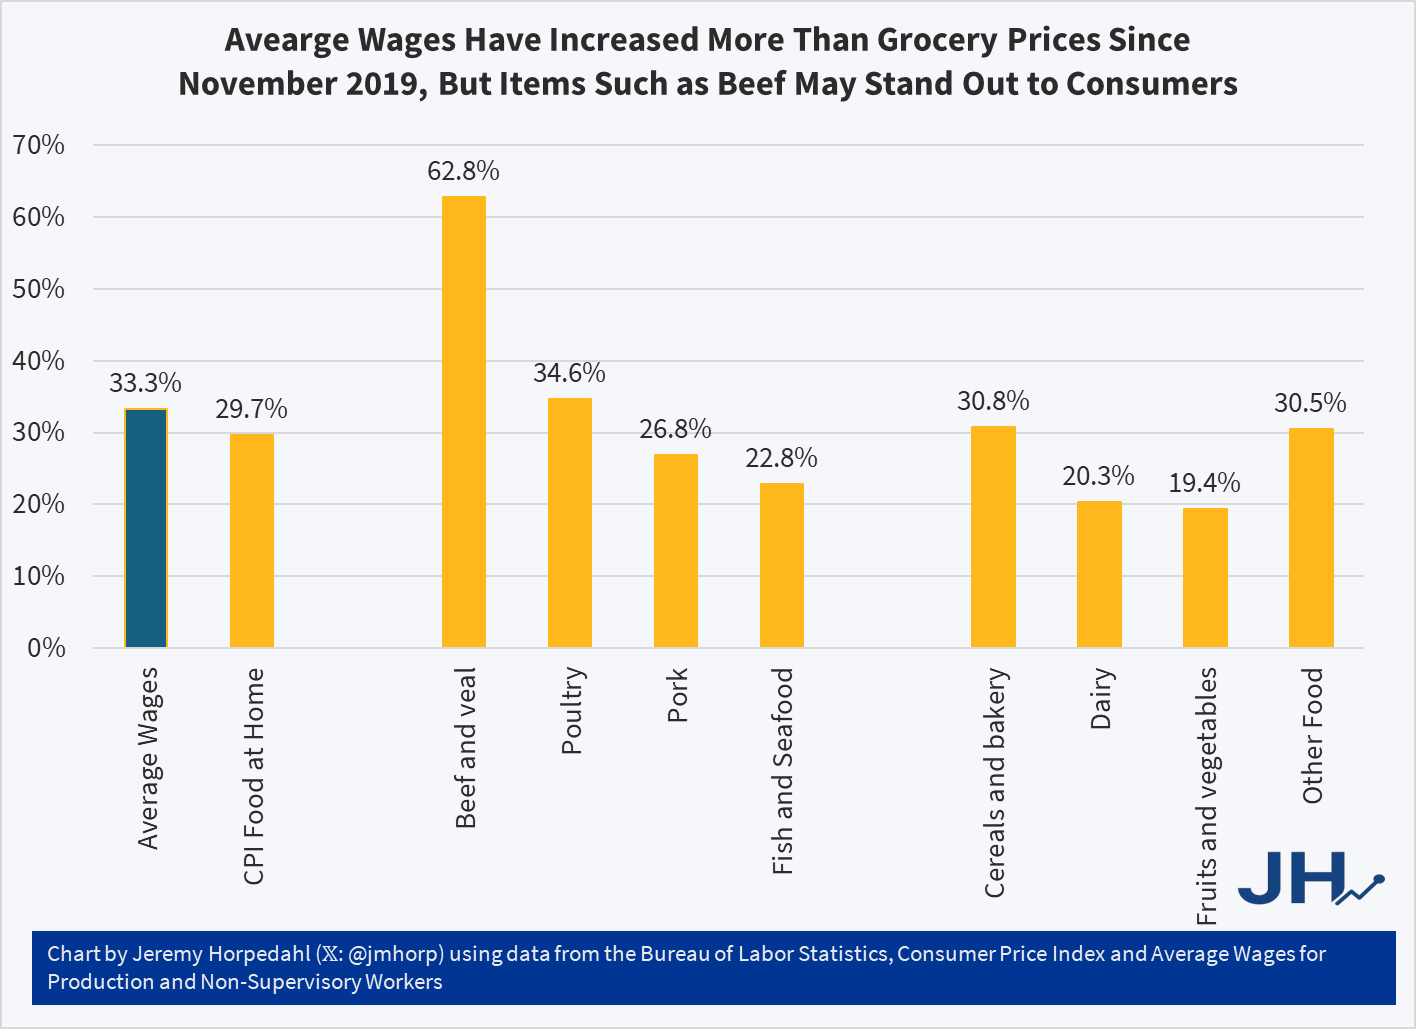
So why are people so pessimistic if wages have been rising faster than grocery prices? One theory: availability bias. People focus on the prices where they notice goods becoming less affordable, but ignore the ones that are more affordable. Many consumers could probably tell you that a dozen eggs increased from $1.40 per dozen in November 2019 to $2.86 today, and at times was much higher, topping $6 briefly in early 2025. Likewise they could tell you that a pound of ground beef soared from $3.81 in late 2019 to $6.54 today. Both of these prices increases vastly exceed wage increases over the same timeframe (about 33 percent for wages), but most consumers probably couldn’t tell you that these were outliers and most major categories of food increased by less than average wages since late 2019:
While the “beef and veal” category has clearly outpaced wages — by almost twice as much! — nearly every other category of meat and as well as other food product prices increased less than wages. Poultry is the one exception, though here it is almost equal to wage increases. But if we are talking about pork or fish, or the non-meat categories, most food is more affordable than in late 2019 relative to wages. Consumers won’t as easily identify these more affordable categories, and they probably have no idea how much average wages increased.
Grocery prices are definitely up a lot in the past few years. I’ve wrote about thisseveral times before. But lately there has been a trend on social media to “post your receipts” and show how much your grocery prices have gone up. Unfortunately, very few people actually post the full receipts, often just showing the total, which leads to wild claims like prices being up 250% in just the past 2 years! That’s a huge contrast to BLS “food at home” category of the CPI, which shows an increase of 4.7% from July 2022 to July 2024 (it’s also unclear in the video what the exact date of the receipt is, he just says “2 years”). Depending on the exact base month, you’re going to be in the 20-25% compared with pre-pandemic or early pandemic using BLS data.
What if we actually looked at receipts? I tried such an exercise in November 2023, when there was another round of social media videos claiming prices had doubled in just a single year. My own personal receipt matched the corresponding BLS data pretty closely, but that was just one receipt with only eight items from Sam’s Club (which might not match grocery stores, for various reasons). At the time, I couldn’t find any good receipts from 2019 or 2020 (Kroger and Walmart drop old receipts in your account after about 2 years), but after scouring an old email account, I discovered two more receipts to compare. These are both from Walmart, in 2019 and 2020, and they contain a larger number of items than my Sam’s Club receipt (each with about a dozen and half items that are fairly typical grocery purchases, and I was able to find matching products today).
Many people have nostalgia for nominal prices of the past. I’ve written about this topic in various contexts before, but the primary error in doing this is that you must also look at nominal wages from the past. Prices in isolation give us little context of how affordable they were.
One area with a lot of nostalgia is food prices of the past, specifically grocery prices (I’ve also written about fast food prices). While I have addressed grocery price inflation since 2021 in another post (it’s bad, but probably not as bad as social media leads you to believe), there is another version of grocery price nostalgia that goes back even further. For example, this image shows up on social media frequently with nostalgia for 1980 prices:
(Note that the image also mentions housing prices, but the clear focus of the image is on groceries. I won’t dig into housing in this post, but it’s something I have written a lot about before, and I would recommend you start with this post on housing prices from February 2024. But she sure looks happy! As models often do in promotional photos.)
Could you buy all those groceries for $20 in 1980? And how should we think about comparing that to grocery prices today?
One approach to grocery affordability is to look at how much a family spends as a share of their budget on food and other items. In the past I’ve used this approach to show that food spending has fallen dramatically over time as a share of a household’s budget, including since the early 1980s. But perhaps that approach is flawed. Maybe housing has got more expensive, so families are cutting back on food spending to accommodate for that fact, but they are getting less or lower quality food.
For another approach, I will use Average Price Data for grocery items from the BLS CPI series. Note that I am using actual average retail price data, not prices series data, which means there are not adjustments for quality changes or substitutions. No funny stuff, just the raw price data (the only adjustment is if product sizes changes, which of course we want them to do, so we aren’t fooled by shrinkflation — so BLS uses a constant package size, such as 1 pound for many items or a dozen eggs, etc.).
The items I have chosen out of the 150-plus price series are the 24 items which are available in both 1980 and 2024. There may be some biases by doing this, but in general BLS is continuing to collect data on things that people continue buying. So it’s the best apples-to-apples comparison we can do (note that there are no apples in this list! Apples are tracked in the CPI, but there is no continuous price series from 1980 to 2024 for one apple variety).
How best to compare prices over time? Rather than “adjusting for inflation,” as is common in the popular press and by some economists, a better approach that I and other economists use is called “time prices.” Time prices show the number of hours or minutes it would take to purchase the good in two different years, using some measure of wages or income (I will use both average and median wages in this post). By looking at prices compared with wages for individual items, we can see whether each items as well as the entire basket has become more or less affordable.
Here is what time prices for these 24 items look like if we use average wages (I use a series that covers about 80% of the workforce, but excludes supervisors and managers). For this chart, I use prices in April 1980 and April 2024, since there is some seasonality to some prices (and April 2024 is the most recent price and wage data available, so it’s as current as I can get).
The chart shows that for 23 out of the 24 items, it takes fewer minutes of work to buy the items in April 2024 than it did in April 1980. For many items, it is a huge decrease: 13 items decrease by 30 percent or more (30 percent is also the average decrease). And while we once again might be concerned by selection bias of the goods, we have a nice variety here of proteins, grains, baking items, vegetables, fruits, snacks, and drinks. Unfortunately for the bacon lovers out there it is the one product going in the other direction, but there are still a variety of other proteins that have become much more affordable (pork chops are much cheaper!).
Here’s one way in which the image of the lady shopping wasn’t wrong: you could get a basket of groceries for about $20 in 1980. The basket I’ve put together (which is obviously different from the woman’s basket, but you work with the data you have) would cost $27 if you bought the package sizes BLS tracks (e.g., one pound for most of the meats and produce). In 2024, that same basket would cost $84. That’s 3 times as much! But since wages are over 4 times higher, the family is better off and groceries are, in a real sense, more affordable.
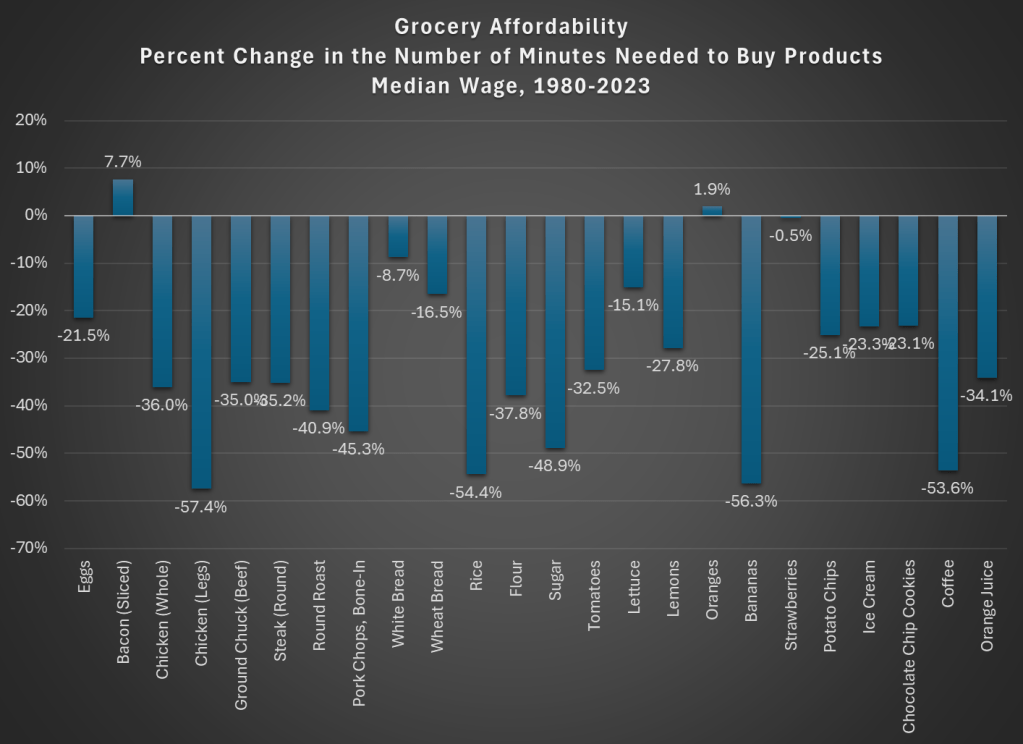
Speaking of wages though, is my chart perhaps biased because I’m using the average wage? What if we used another measure, such as the median wage? For that, I can use the EPI’s median wage series (which comes from the CPS), and I also converted it to a nominal wage for 2023. This wage data is only available annually, with the most recent being 2023, so I will also use 2023 price data for this chart (note: for oranges and strawberries, I use the second quarter average price, since they weren’t available year round in 1980 — another subtle example of growing abundance and prosperity today).
The immediate thing you will notice is that there isn’t much difference between the average wage chart. Bacon is still less affordable. We know have oranges being slightly less affordable and strawberries being basically the same, though keep in mind as I mentioned above the chart that these weren’t available year-round in 1980.
But other than bacon and those seasonal fruits, everything is more affordable in 2023 than 1980. The average decrease is the same as the prior chart: 30 percent fewer minutes of work at the median wage to purchase this basket of goods, with 13 of the 24 items decreasing by more than that 30 percent average. The reason for this similarity is that both the average and median wages as measured by these series are more than 4 times higher than 1980.
But are these 24 items representative of other grocery items that we don’t have complete price data in the public BLS series? They are probably pretty close. The unweighted percent change in the items from April 1980 to April 2024 was 201%. If we use the CPI Food at Home component, which includes many more items but also changes in composition as buying habits change, we see a slightly larger 255% increase. But that is still less than wages have increased since 1980 (by over 300% for both average and median wages). As our incomes rise, we will naturally switch to better and more expensive foods, which can explain the 255% vs 201% difference in price increases, but it also shows the BLS isn’t engaging in any funny business with the indexes: if they kept the basket of goods constant, price increases would be smaller.
While the rise in prices since 2021 might rightly make us nostalgic for the pre-pandemic era of prices, let’s not be nostalgic for 1980 grocery prices.
Food prices are up a lot in the past few years. I’ve written about this several times in the past few months. In the US, we’ve seen grocery prices go up 20% on average in just 3 years. That’s much higher than we are used to: in the decade before the pandemic, the average 3-year increase was just 4%. In fact, the 3-year increase was negative for much of 2017 and 2018. To find increases this big, you have to go back to the late 1970s and early 1980s (when sometimes the 3-year grocery inflation rate was almost 50%).
But if it’s any consolation, this is not a problem that is unique to the US: food prices are up around the globe. That’s a relevant insight when we come to a recent viral video from Tucker Carlson’s visit to a Russian grocery store. Carlson says that the inflation and cost of groceries will “radicalize you against our leaders.”
So what has food price inflation looked like in Russia, the US, and the other G7 countries? (What used to be called the G8, until Russia invaded Crimea in 2014.) Here’s the chart:
Cumulatively since January 2021, when our current “leaders” came into power in the US, food prices are up 20% in the US, as I said above. But notice that this is on the low end for this group of countries. Japan, with consistently low inflation and occasionally deflation over the past few decades, has been the lowest over this timeframe (though even in Japan, food prices are up about 7 percent in the past year).
But notice who is the highest: Russia, where grocery prices are up 32% in the past 3 years. Certainly, their invasion of Ukraine and the resulting global sanctions plays a role in this, but even if we look at early 2022, the cumulative 15% food inflation was much higher than any G7 country.
So blaming our leaders for rampant inflation is probably not a good idea, especially if you are trying to portray Russia in a positive light.
Perhaps the more charitable interpretation of Tucker Carlson is that the nominal price of groceries is lower, rather than the rate of inflation (even though he does mention inflation in the video). The basket of food they purchase in the video comes out to the equivalent of about $100 at current exchange rates. Everyone on his crew guessed it would be around $400.
I can’t say whether their guess of $400 was accurate, but it would not be totally surprising if the prices of non-tradable goods were lower. This is what would expect in a country with lower wages. While we normally think of services as non-tradable, it’s also reasonable to assume that a lot of fresh food, such as produce, bread, and dairy, is also non-tradable (at least not without high transaction costs).
Carlson’s claim that people “literally can’t buy the groceries they want” is a much more apt statement of the state of affairs in Russia (and other poor countries) than it is in the US and Western Europe.
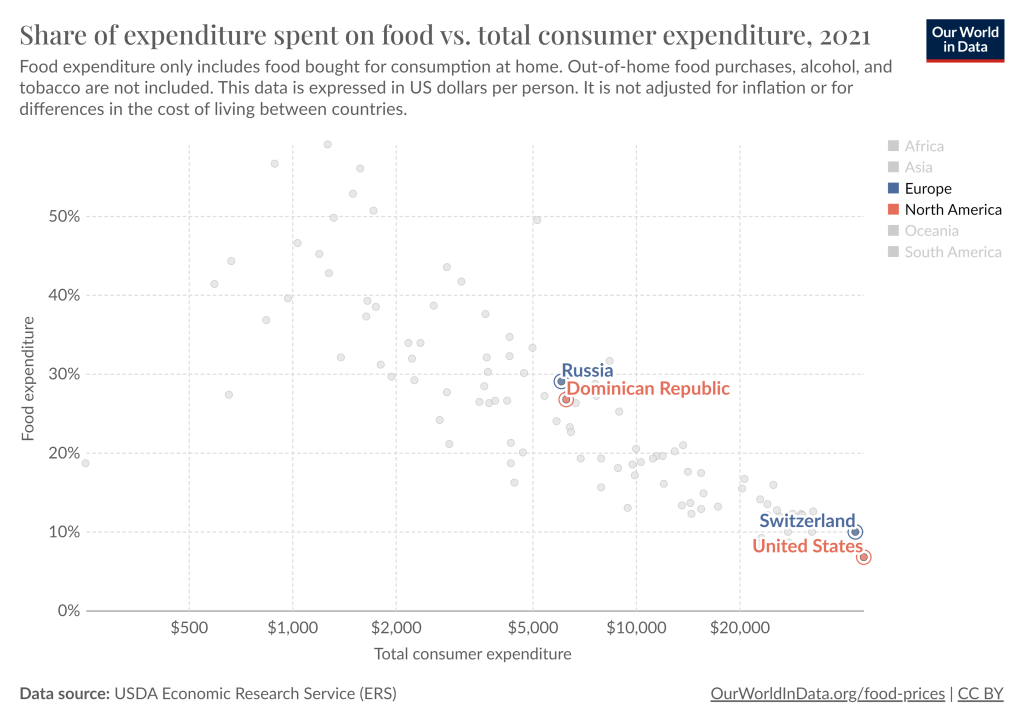
The average Russian allocates about 30% of their spending to groceries, similar to the Dominican Republic. And this data is from 2021, just before the massive spike in food prices in Russia. Meanwhile, the US is by far the lowest, at just under 7%. The UK, Canada, and Switzerland are the closest to the US, but they are in the 9-10% range. Food in the US is cheap.
The food inflation we’ve experienced in the US has been bad, the worst in a generation. But it’s not exactly clear that our “leaders” are to blame. And it’s also pretty clear that it’s much worse in the rest of the world, especially in Russia.
Last week I gave some advice on how to save money on food. Food prices are up a lot in the past 4 years, but especially since the beginning of 2021. Over the 32 months since January 2021, grocery prices (according to the CPI) are up 20 percent (keep that number in mind). To give you an idea of how unusual that is, in the 32 months before the pandemic (up to January 2020), grocery prices only rose 2 percent. Perhaps even more astonishingly, if we look at October 2019 grocery prices, they were slightly lower on average than 4 years earlier in October 2015. From a flat 4 years to a 25 percent increase over the next 4 years. That’s a huge change for consumers.
But we also shouldn’t overstate the price increases. As you might guess, the best place for overstatements is social media. You can find plenty of them. For example, this very viral video claims that her family’s grocery prices doubled (in fact, almost exactly doubled, to the penny, which is suspicious) in just one single year, from August 2021 to August 2022. According to the CPI data, grocery prices were up 13.5 percent over that period — which, don’t get me wrong, is a lot! But it’s not 100 percent. I’ll focus on this one example, but I’m sure you will believe me that you can find dozens of examples like this on social media every single day (for example, yesterday someone claimed bread prices had tripled since 2019).
Let’s leave aside for a moment that in that viral video she claims to spend $1,500 per month on groceries. This would be a massive outlier for 2022. A family in the middle income quintile spent $460 per month on groceries in 2022, and $713 on all food including restaurants. So even if this family eats every single meal at home, they are still spending twice as much as a middle income family. Even a family with 5 or more people (the largest bucket BLS uses in that report) spent $755 per month on groceries ($1,232 on all food). According to the Consumer Expenditure survey, the middle quintile grocery spending went up 16%, and the five-person household went up 19% from 2021 to 2022. Big increases, no doubt! But not 100%.
So who are we to believe? Have prices roughly doubled since 2021? Or are they up about 20 percent? People are sometimes skeptical of the consumer price index, so let’s look at the actual price data that goes into the index. BLS has data on hundreds of individual food items, but here’s a summary chart with eight common food items. Here’s the change in the prices of those items since January 2021:
From the recent CPI inflation report, one of the biggest challenges for most households is the continuing increase in the price of food, especially “food at home” or what we usually call groceries. Prices of Groceries are up 13.5% in the past 12 months, an eye-popping number that we haven’t seen since briefly in 1979 was only clearly worse in 1973-74. Grocery prices are now over 20% greater than at the beginning of the pandemic in 2020. Any relief consumers feel at the pump from lower gas prices is being offset in other areas, notably grocery inflation.
The very steep recent increase in grocery prices is especially challenging for consumers because, not only are they basic necessities, if we look over the past 10 years we clearly see that consumer had gotten used to stable grocery prices.
The chart above shows the CPI component for groceries. Notice that from January 2015 to January 2020, there was no increase in grocery prices on average. Even going back to January 2012, the increase over the following 8 years was minimal. Keep in mind these nominal prices. I haven’t made any adjustment for wages or income! (If you know me, you know that’s coming next.) Almost a decade of flat grocery prices, and then boom!, double digit inflation.
But what if we compare grocery prices to wages? That trend becomes even more stark. I use the average wage for non-supervisory workers, as well as an annual grocery cost from the Consumer Expenditure Survey (for the middle quintile of income), to estimate how many hours a typical worker would need to work to purchase a family’s annual groceries. (I’ve truncated the y-axis to show more detail, not to trick you: it doesn’t start at zero.)
In grad school, I learned about the overlapping-generations model. The idea is that we simplify people down to the fundamental parts of their life-cycle. Each person lives for 2 periods. In the first period, they can produce only. In the second period, they can consume only. A popular conclusion of the model pertains to old-age benefit programs such as Social Security.
The first beneficiaries receive a gift that is free to them, then each subsequent generation accepts the debt, pays it off, and then passes on new debt to the proceeding generation. In this manner, the program benefit of the current generation is limited by the income of the following generation. Therefore, every single generation can consume as if they lived a generation later – and a generation richer – in time. That’s exciting.
But this model is not unique to governments. With a little bit of finance, we can model every person as their own self-encapsulated overlapping-generations model – with two similarly exciting conclusions. Let’s consider a person who has monthly consumption expenditures of $1k per month and let’s assume a discount rate of half a percent per month.
Life is pretty good for this person. They earn income each month and they spend $1k of it during the same period. Now let’s give the person a credit card. It doesn’t matter what the interest rate is – they’re going to pay it off each subsequent month. Now let’s see what’s possible.
What’s going on here? The difference in the consumption pattern is that the first month with a credit card can enjoy twice the consumption. How’s that? $1k of that January consumption is just the typical monthly spending. The other $1k is running up a month’s worth of spending on the credit card. So long one pays-off the card in the following month, there are no interest charges. But wait – if one pays-off the credit card in February, then how does one consume in February? By borrowing from March’s income, of course! And so the pattern repeats ad-infinitum. With a credit card one can borrow against next month’s spending. You too can borrow from your future self. And your future self won’t mind because they’ll do the same thing.
Conclusion #1: Having a credit card entitles you to one free month of double consumption.
The above example includes identical income over time. But, what if your income grows? Let’s assume that your income and commensurate consumption grow at a rate of one quarter percent per month. Our consumption without a credit card is tabulated below.
Obviously, having income and consumption that grow is more enjoyable than ones that are constant each period. Now let’s observe below what happens when we again introduce a credit card that one pays-off each month.
What’s going on here? Just as happened previously with a credit card, one can enjoy an extra boost to consumption in the first period. But what does growing income do for us besides greater complication? Just as previously, one can pay their debt each period and consume by borrowing against the next month’s income. But with growing income, having a credit card means that one can enjoy the next month’s level of consumption today. That is, next month’s higher consumption is shifted sooner in time by one month. Notice that, with growing income, consumption for July without a credit card ($1,018) is the same as the consumption in June with a credit card. Even without the first-month-gift, credit cards increase the present value of one’s consumption by making next month’s greater income available today – and the same is true for every single month.
Conclusion #2: Having a credit card today entitles you to next month’s greater income.
How big a deal is this? Obviously, it will differ with the discount rate and the rate of income growth. Using the numbers above, having a credit card permits one to consume with a present value that is 10.5% higher. Let that sink in. People who have access to credit consume as if they are 10.5% percent richer. Access to credit can make the difference between a pleasant Christmas, having quality internet, paying for car repairs, and so on. Being poorer is one thing. Being poorer and lacking access to credit is like taking an instant haircut to one’s quality of life. On the flip side, people can be made better-off without additional improvements to their productivity. Increasing access to credit may be a less costly improvement to the value lifetime consumption than many of the other less politically feasible improvements to labor productivity.
Recently, I’ve been buying a lot more non-durable goods when they are on sale. Whereas previously I might have purchased the normal amount plus one or two units, now I’m buying like 3x or 4x the normal amount.
What initially led me here was the nagging thought that a 50%-off sale is a superb investment – especially if I was going to purchase a bunch eventually anyway. I like to think that I’m relatively dispassionate about investing and finances. But I realized that I wasn’t thinking that way about my groceries. The implication is that I’ve been living sub-optimally. And I can’t have that!
If someone told me that I could pay 50% more on my mortgage this month and get a full credit on my mortgage payment next month, then I would jump at the opportunity. That would be a 100% monthly return. Why not with groceries? Obviously, some groceries go bad. Produce will wilt, dairy will spoil, and the fridge space is limited. But what about non-perishables? This includes pantry items, toiletries, cleaning supplies, etc.
Typically, there are two challenges for investing in inventory: 1) Will the discount now be adequate to compensate for the opportunity cost of resources over time? 2) Is there are opportunity cost to the storage space?
For the moment, I will ignore challenge 2). On the relevant margins, my shelf will be full or empty. I’ve got excess capacity in my house that I can’t easily adjust it nor lend out. That leaves challenge 1) only.