Will Growth Stocks Continue to Trounce Value Stocks?
It’s no secret that growth stocks, mainly big tech companies like Apple and Microsoft, have massively out-performed so-called value stocks in the past fifteen years. Value stocks tend to have lower price/earnings and steady earnings and low price/earnings. They include sectors such as petroleum, utilities, traditional banks, and consumer products. These companies often pay substantial dividends from their cash flow.
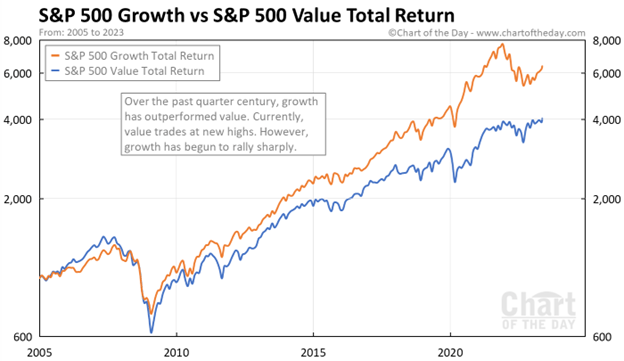
Here are some charts which make the point. This 2005-early 2023 chart shows value stocks (blue curve) having a small edge 2005-2008, then the growth stocks (orange curve) keep ripping higher and higher. Financial stocks, which mainly fall in the value category, were hit particularly hard in the 2008-2009 downturn.
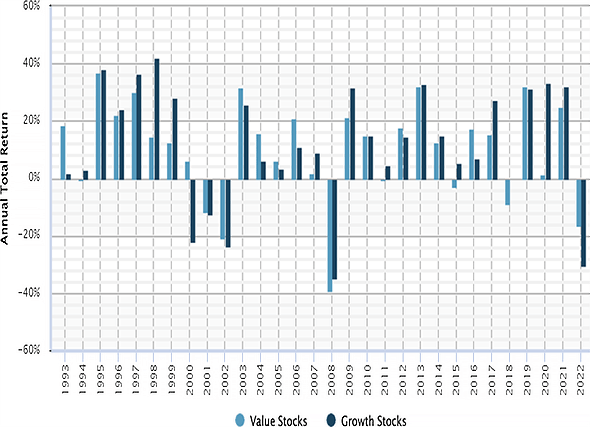
Here is a bar chart display of annual returns of value stocks (blue bars) and of growth stocks for the years 1993-2022. In 1997-1999 growth stocks outperformed. This was the great tech bubble – I remember it well, investors were shoveling money into any enterprise with a customer-facing website, whether or not there was any reasonable path to profitability. Reality caught up in 2000 (“What was I thinking??”), tech stock prices crashed and then tech was hated for a couple of years. But by 2009 or so, today’s big tech firms had emerged and established their quasi-monopolies, and started actually making money and even more money.
So, is the answer to just allocate all your equity portfolio to big tech and walk away? This is a question I have been asking myself. Even as growth stocks dominate year after year, there have continued to be voices warning that this is anomaly; historically, value stocks have performed better. So, with the sky-high valuations of today’s big tech, there is due to be a big mean reversion where the “Magnificent 7” get crushed, and Big Banks and Big Oil and Proctor & Gamble and even humble utilities finally get to shine.
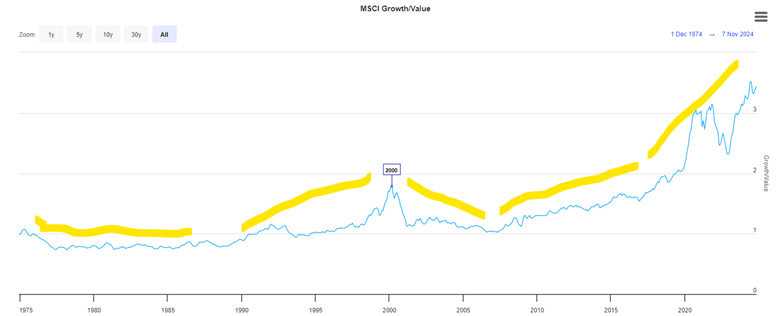
I don’t have a chart that goes that far back, but I have read that over the past 100 years, value has usually beat “growth”. Here is a hard-to-read plot of value vs growth for 1975-2024. I have added yellow highlighter lines to mark major trend periods. Growth underperformed 1975-1990, then growth picked up steam and culminated in the peak in the middle of the chart at 2000. Growth then underperformed 2000-2008, as noted earlier, as the excesses of the tech bubble were unwound, and people made paper fortunes in the real estate bubble of 2001-2007.
Growth has dominated since 2009, excerpt for 2022. That was the year the Fed raised interest rates, which tends to punish growth stocks. However, with their unstoppable increases in earnings (accounting for the vast majority of the earnings in the whole S&P 500), big tech has come roaring back. Yes, they sport high P/E ratios, but they have the earnings and the growth to largely justify their high valuations.
I have been influenced by the continual cautions about growth stocks becoming overvalued. Many an expert has advocated for value stocks. In June of this year, Bank of America head of US equity strategy Savita Subramanian told an audience at the Morningstar Investment Conference: “I have one message to you: Buy large-cap value.” So, for the past couple of years, I have gone relatively light on big tech and have over-allocated to “safer” investments like fixed income and value stocks. Silly me.
In the last few months, I finally decided to give up fighting the dominant trend, and so I put some funds into SCHG, which is specifically large cap growth, and in other growth-heavy funds. As you may imagine, these funds are loaded with Nvidia and Meta and other big tech. They have done very well since then.
How about going forward? Will the growth dominance continue, or will the dreaded mean reversion strike at last? At some point, I suspect that big tech earnings will slow down to where their high valuations can no longer be supported. But I don’t know when that will be, so I will just stay diversified.
Boilerplate disclaimer: Nothing here should be taken as advice to buy or sell any security.


