Change in Homicide Rates from Pre-Pandemic in Large US Cities

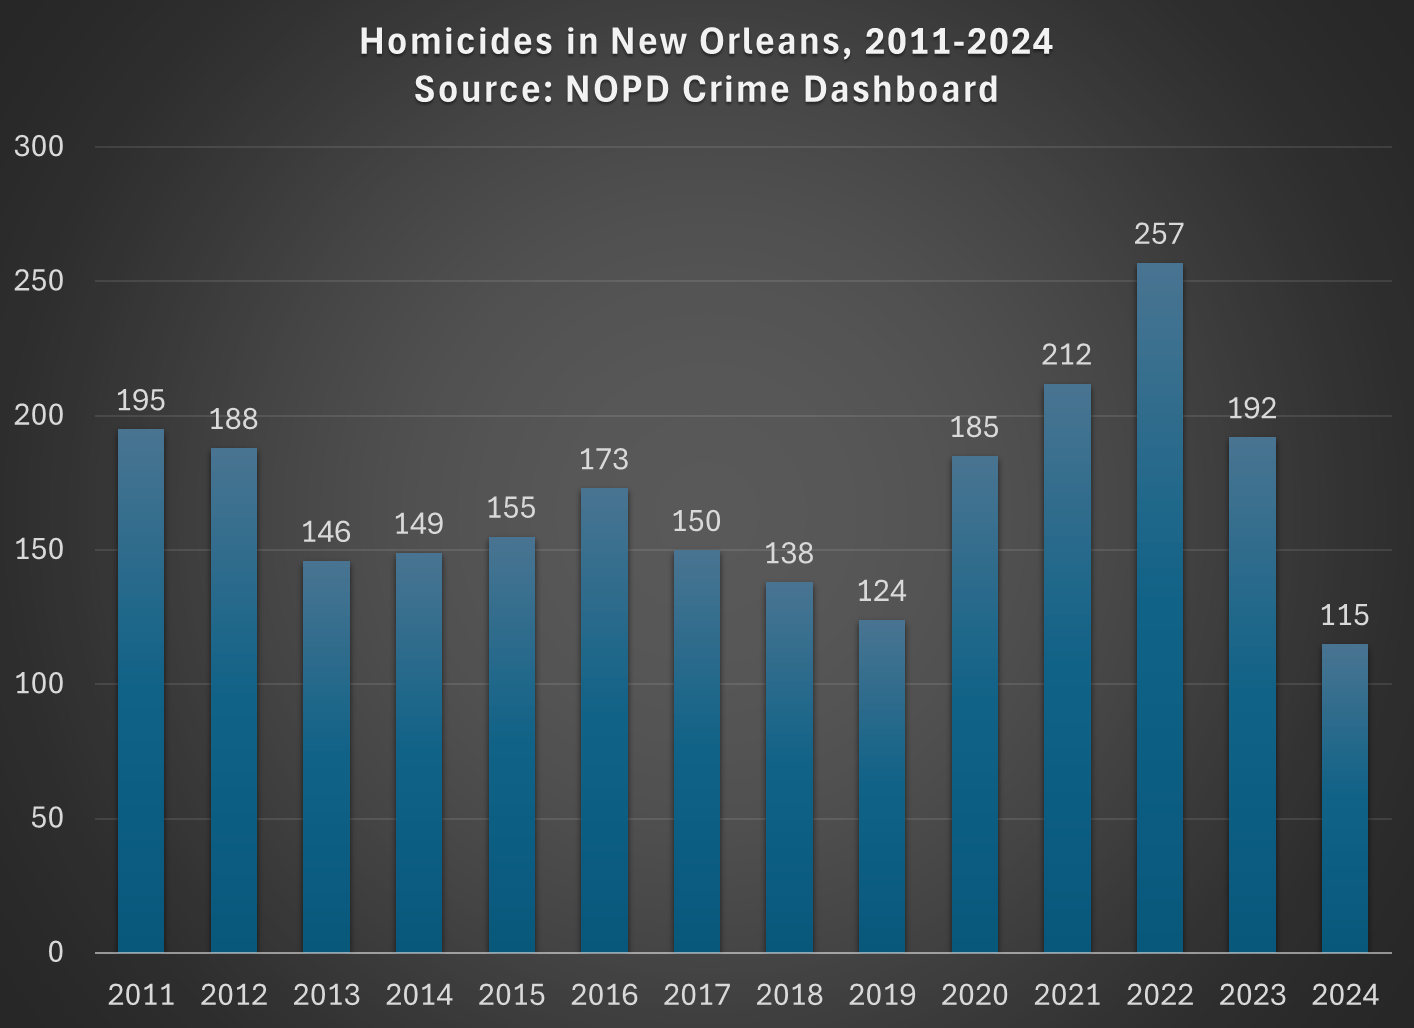
We all know that homicides spiked in the US in 2020 and we all (hopefully) know that homicides have been falling across most of the country dramatically since the end of 2021. But have homicides started to get back to, or even below, pre-pandemic levels? Or is it merely reversing the 2020 increases?

The answer depends on the city and the pre-pandemic baseline! The chart below shows the 10 largest cities (with Fort Worth instead of Jacksonville, because the Real-Time Crime Index doesn’t include the latter) in the US, using a base of either January 2018 (the first month in the RTCI) or December 2019 (just before the pandemic, and murders had fallen nationally between these two dates):

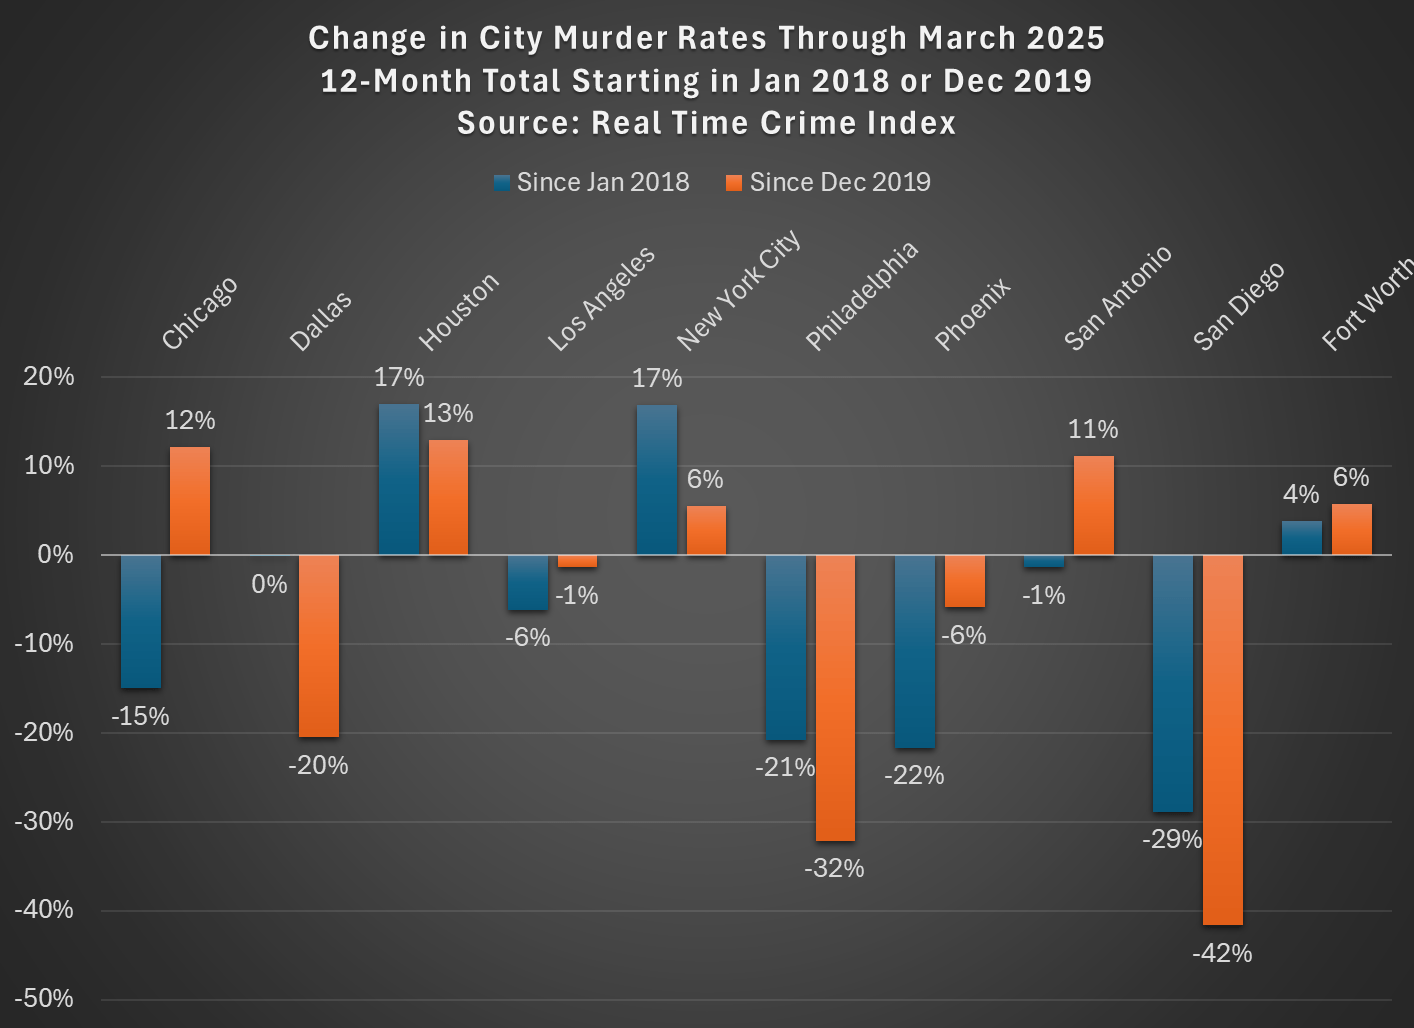
The murder data comes from the Real-Time Crime Index, and it is a 12-month total so we shouldn’t have to worry about seasonality even though the months are different. I use Census annual city population estimates to calculate the rates (and estimate 2025 based on the growth from 2023-24).

As you can see, depending on the base timeframe used, about half of the cities saw declines, a few were roughly flat, and some definitely saw increases. New York, Houston, and Fort Worth are definitely still elevated. Los Angeles, Philly, Phoenix, and San Diego are definitely down. The others are either close to even or mixed depending on your baseline.

Keep in mind these data are only through March 2025. As both Billy Binion at Reason and Jeff Asher have both recently emphasized, if we use the most recent data for many cities, it’s entirely possible that 2025 will end up having some of the lowest homicide rates ever recorded for many US cities. The declines in early 2025 have definitely been big, but mostly they are just a continuation of the post-2021 decline.

Again, for clarification, all of these cities are down from their 2020-21 peaks: using September 2021 as the base (when the national murder rate roughly peaked), these 10 cities are down between 31% and 58%. Big improvements!

Homicides in 2024 Were Down Significantly

The tragic act of terrorism in New Orleans early on New Year’s Day might seem like confirmation to many that crime, especially in big cities, is still at elevated levels from before the pandemic. But we have to be very careful with anecdotes, no matter how deadly and visible.

Using data from the New Orleans Police Department dashboard, which has been updated through December 31, 2024, we see that 2024 had the lowest number of homicides going back to 2011, which likely makes it one of the safest years on record in New Orleans:

New Orleans is not alone.

Using data from the Real Time Crime Index, we see that among the 10 largest cities in the US in their index, through the first 10 months of the 2024 (the most recent available for all these cities), homicides are down 16.9% compared to 2023.

Murders in these 10 largest cities are still about 5.6% above the first 10 months of 2019, but three of the 10 cities (Dallas, Philadelphia, and San Diego) are already below the first 10 months of 2019, by fairly significant margins (-13.7%, -26.2%, and -21.6%). Once we have all 12 months of data for these cities, I suspect that a few more will be back to 2019 levels.

Crime is indeed still a major social problem in much of the US, but we are getting back to 2019 levels of social problems — which is still bad, but violent crime is not high and rising, as many seem to believe based on very notable and horrific events.

(The 10 largest cities in the RT Crime Index are Chicago, Dallas, Houston, Las Vegas, Los Angeles, New York, Philadelphia, Phoenix, San Antonio, and San Diego.)

Alabama’s Homicide Rate is More than Double New York City

A lot of people think New York City is an especially high-crime city. Including some US Senators. Here’s senior Senator from Alabama:

Ignore the weird obsession with Biden’s ice cream habit. The Senator is concerned that NYC is not safe.

But what’s the reality? Here’s a map showing the homicide rate in each state, and its relative position to NYC (data is from the CDC for 2022, the most recent complete year available right now).

The light-colored states have a lower homicide rate than NYC (5.2 deaths per 100,000). There’s 18 of those states. But most states have higher homicide rates than NYC. Some are a lot higher, even triple NYC in a few states (colored purple). Alabama’s homicide rate of 13.9 deaths per 100,000 people is about 2.5 times as high as New York City.

But perhaps the homicide rates in these states are being driven by high homicide rates in cities in those states? Comparing a city to a state is perhaps a little strange to do, but I also often hear this retort: well, it’s those cities, especially “Democrat-controlled” cities, that are driving the high homicide rate in Alabama and elsewhere. And while this is true to a certain extent, comparing rural counties to New York City doesn’t make Alabama and the South look much better:

For this map I combined 2021 and 2022 data, because the CDC doesn’t report very small numbers (usually under 10 deaths), so grouping two years is needed to get more data. Even so, there are still a handful of states that don’t have enough homicides for CDC to report them over that two-year period, and they are shown in gray on the map (as well as states that have no rural counties: Delaware, Rhode Island, and New Jersey).

Notice that even focusing on just the rural counties, there are almost 20 states with higher murder rates than New York City. Again, some are double or even triple. Rural Alabama, at 11 deaths per 100,000 people, is exactly double NYC. Notably, the entirety of the rural South is higher than NYC.

If this is all true, why might New York City feel less safe? There are a number of possible explanations, but I’ll offer a few. First, homicide isn’t the only kind of crime. While it does correlate with other crimes, it’s not a 1:1 relationship, so it’s likely that some places with higher homicide rates than NYC have lower levels of assault, rape, or property crimes. These are even more challenging to compare across jurisdictions, but it’s a possible explanation. Related, NYC is a relatively safe big city! Other big cities wouldn’t compare as favorably to Alabama. But folks just seem to love NYC as a punching bag.

The other explanation is just the sheer number of people, and therefore homicides. According to the CDC, NYC had 434 homicides in 2022, that’s an average of more than one per day. You could literally turn on the news every single day and hear about a murder, and perhaps you had even been in the neighborhood where it happened recently. Contrast rural Alabama, which had 65 homicides in 2022. That’s only about one per week. And it might be happening in a completely different part of the state from you, so you either don’t hear about it or think “that’s somewhere else.”

But rural Alabama only has about 600,000 people. NYC has fourteen times as many people. So if we are trying to answer the question “What are the odds that a random person is murdered in a given year?”, we need to take population into account. That’s the logic of reporting homicide rates. Indeed it may feel like NYC is less safe, and that’s a natural human reaction. But that’s why the data is so important, to give us a sense of proportion.

The Leading Causes of Death Among Elementary-Age Children

You might have seen this chart recently. It comes from a letter published in the New England Journal of Medicine in April 2022. The data comes directly from the CDC. It shows the leading causes of death for children in the US. You will notice that firearm-related deaths have been rising for much of the past decade, and in 2020 eclipsed car accidents as the leading cause.

Many are sharing this chart in response to the recent elementary school shooting in Nashville. It’s natural to want to study these problems more in the wake of tragedies. After the Uvalde shooting last year, I tried to read as much as I could about the history of homicide and gun violence in the US, and to look at the research on what might work to reduce gun violence, which is summarized in a post I wrote last June.

That being said, I don’t think the chart above accurately characterizes the problem of elementary school shootings. It might accurately describe some broader problem, but it’s misleading with respect to the shooting we all just witnessed. The most important reason is that the definition of “children” here extends to 18- and 19-year-olds. Much of the gun-related homicides for “children” shown here are gang-related violence, not random school shootings at elementary schools. It’s not that we shouldn’t care about these deaths too — we very much should care — but the causes and solutions are entirely different from elementary school mass shootings.

Continue reading

Violence, Guns, and Policy in the United States

The United States is a uniquely violent country among high-income democracies. And by the best available data on homicides, the US has always been more violent. Homicides are useful to look at because we generally have the best data on these (murders are the most likely crime to be reported) and it’s the most serious of all violent crimes.

Just how much more violent is the US than other high-income democracies? As measured by the homicide rate, about 6-7 times as violent. We can see this first by comparing the US to several European countries (and a few groupings of similar countries).

Let me make a few things clear about this chart. First, this is data for homicides, which are typically defined as interpersonal violence. Thus, it excludes deaths on the battlefield, genocides, acts of terrorism (generally speaking), and other deaths of this nature. That’s how it is defined. If we plotted a chart of battlefield deaths, it would look quite different, but there’s not much good reason to combine these different forms of violent death.

On the specifics of the chart, prior to 1990 these data are averages from multiple observations over multi-year timespans (generally 25 or 50 years). The data on European countries comes from a paper by Eisner on long-term crime trends (Table 1). The countries chosen are from this paper, as are the years chosen. Remember that historical data is always imperfect, but these are some of the best estimates available. For the US, I used Figure 5 from this paper by Tcherni-Buzzeo, and did my best to make the timeframes comparable to the Eisner data. The data are not perfect, but I think they are about as close as we can get to long-run comparisons. For the data from 1990 forward, I use the IHME Global Burden of Disease study, and the death rates from interpersonal violence (to match Eisner, I average across grouped countries).

When we average across all the European countries in the first chart and compare the US to Europe, we can see that the US has always been more violent, though the 20th century onwards does seem to show even more violence in the US relative to Europe. (These charts are slightly different from some that I posted on Twitter recently, especially the pre-1990 data as I tried to more carefully use the same periods for the averages — still only take this a rough guide).

And what is the main form by which this violence is carried out? In the US, it is undeniably clear: firearms. Between 1999 and 2020, there were almost 400,000 homicides in the US (using CDC data). Over 275,000 of these, or about 70%, were carried out with firearms. The next largest category is murder with a knife or other sharp object, with about 10% of murders. And homicides have become even more gun-focused in recent years: about 80% of murders in 2020-21 were committed with guns.

So, there’s the data. But the important social scientific question is: Can we do anything about it? Are there any public policies, either about guns or other things, that will reduce gun violence? Could restrictions on gun use actually increase homicides, since no doubt guns are also used defensively?

Continue reading