Job Market Still Red-Hot; Inflation and High Rates Not Going Away Soon

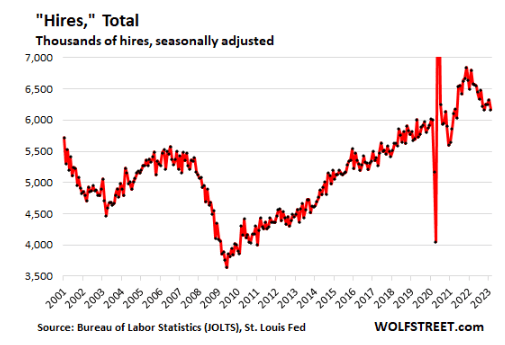
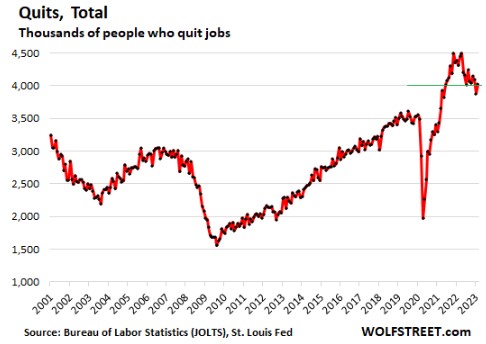
As noted earlier, the main driver in inflation since 2021 has not been supply chain issues, but ongoing wage increases in (mainly) the service industry, fueled by a tight labor market. Some headlines note recent decreases in job openings, etc., suggesting that the end of inflation is near. The point of this post is that measures of labor market tightness remain at very high levels, and so it will be a while yet before the Fed can claim victory over inflation and start meaningfully reducing interest rates.

Below I will post a set of charts (courtesy of Seeking Alpha article by Wolf Richter) which make the following point: most measure of labor tightness remain at least as high as they were in late 2019, just before the pandemic hit. It is true that things have loosened up in the past few months, but that just means the labor market has gone from white-hot to merely red-hot. Let the data speak:

We hold that the current  tightness of the labor market is largely a result of pandemic policies which incentivized a whole tranche of experienced workers to take early retirement and also put lots of cash in our pockets which we are spending generously on services .  Those workers are not coming back, but at some point in the next 1-2 years the excess Covid cash will run out and we may finally get the long-expected recession. But if the government rushes in with enhanced unemployment benefits to ease the recession pain, we would expect inflation to remain well above the nominal 2% target

The Decline of Working Hours, in the Long Run and Recently

If you look at the long-run trends in labor markets, one of the most obvious changes is the decline in working hours. The chart from Our World in Data shows the long-run trend for some countries going back to 1870.

Hours of work declined in the US by 43% since 1870. In some countries like Germany, they fell a lot more (59%). But the decline was substantial across the board. One thing to notice in the chart above is that for the very recent years, the US is somewhat of an outlier in two ways. First, there hasn’t been much further decline after about the mid-20th century. Second, average hours of work in the US are quite a bit higher than many of developed countries (though similar to Australia).

But the labor market in the US (and in other countries) is in a very unusual spot at the present moment after the pandemic. So what has happened really recently. Many economists are looking into this question of hours and other questions about the labor market, and a new working paper titled “Where Are the Workers? From Great Resignation to Quiet Quitting” presents a lot of fascinating data about the current state of work in the US. The paper is short (just 14 pages) and readable for non-experts, so I encourage you to read it all yourself.

Here is one table and one chart from the paper that I will highlight, which shows that hours of work have been falling, but in a very specific set of workers: those who work lots of hours, and those with high incomes. For workers at the high end of hours worked, the 90th percentile, they have dropped from 50 hours to 45 hours of work per week just from 2019 to 2022. But workers at the median? Unchanged at 40 hours per week. (The data comes from the CPS.)

The figure below is only for male workers, and it shows a similar decline in hours worked for those at the high end of the earnings distribution. For those at the bottom, hours of work at mostly unchanged.