The third quarter ‘All Transaction’ housing price data was just released this week. These numbers are interesting for a few of reasons. One reason is that home prices are a big component of our cost of living. Higher home prices are relevant to housing affordability. This week’s release is especially interesting because it’s starting to look like the Fed might be pausing its year 18-month streak of interest rates hikes. In case you don’t know, higher interest rates increase the cost of borrowing and decrease the price that buyers are willing to pay for a home. Nationally, we only had one quarter of falling home prices in late 2022, but the recent national growth rate in home prices is much slower than it was in 2021 through mid-2022.
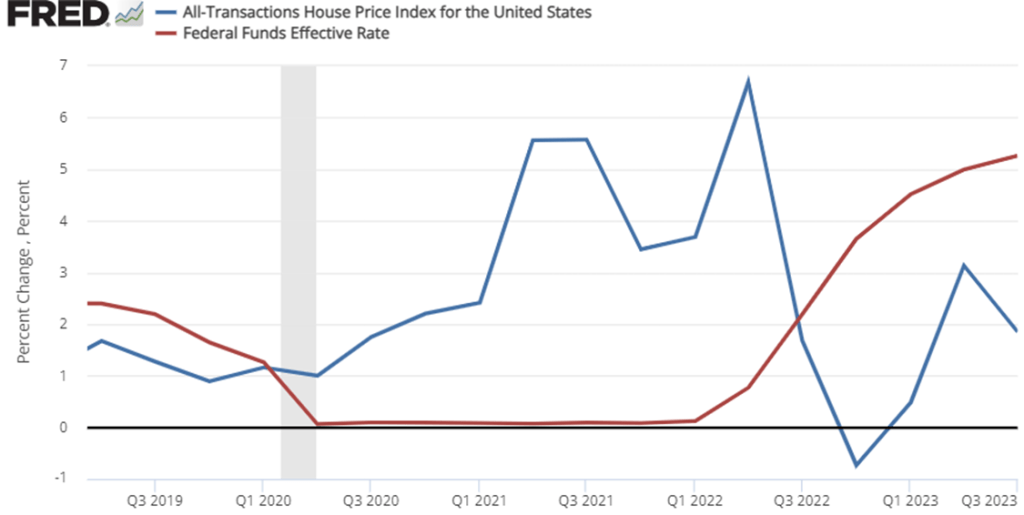
Do you remember when there were a bunch of stories about remote workers and early retirees fleeing urban centers in the wake of Covid? We stopped hearing that story so much once interest rates started rising. The inflection point in the data was in Q2 of 2022. After that, price growth started slowing with the national average home price up 6.5%. But the national average masks some geographic diversity.
Below is the heat map and the top/bottom five prices changes by state.
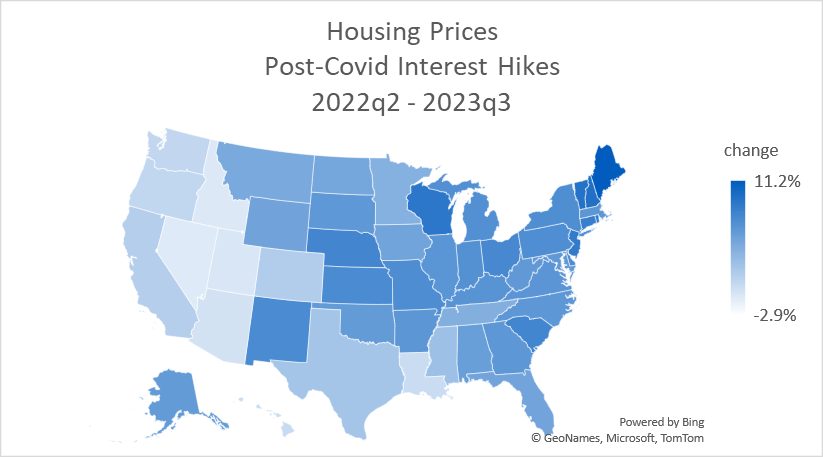

What do we see? Housing prices have risen in all but five states since 2022q2. Except for the District of Columbia, all of states with falling prices are western states. While prices have risen everywhere else, the gains are especially noticeable in the northeast, the east coast, the rust belt, and the parts of the Midwest. The most severe increases are in the northeastern corner states. People have plenty of opinions about real estate. But, if you’re thinking about purchasing a home or an investment property right now, then you might intuit that the best deals are in the south and out west (by historical standards anyway). On the other hand, if you are a property owner, then owning anywhere else has been good for your property value since interest rates started rising – but especially if you live in the Northeast (Maine, New Hampshire, & Vermont).
But before we get too excited about potential buying and selling opportunities, we should consider the context. How did prices change in the *low* interest rate period prior to 2022q2? Below is the same map from 2020q1 – 2022q2 and the top & bottom states.

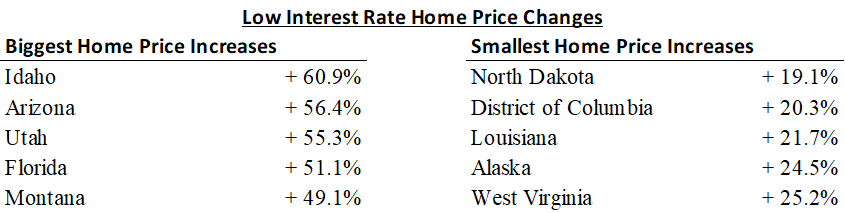
Notice anything? There is a lot of overlap among the states that experienced the biggest price declines in the high interest rate environment and those those that experienced the biggest increases in the low interest rate environment. Idaho, Nevada, and Utah are dark blue, whereas the rust belt is pretty placid. Having said that, home prices grew a lot more than they fell. The top five cumulative gains are Florida (+65.3%), Maine (+64.9%), Idaho (59.2%), Montana (+58.9%), and North Carolina (+58.6%). The bottom five are District of Columbia (+15.6%), Louisiana(+22.7%), North Dakota (+26.8), Alaska (+33.2%), and Minnesota (+34.9%).
How does your state measure up? Below are the complete lists.

