During the peak of the Covid inflation in 2022 I speculated that food inflation was worst for the cheapest products:
a typical McDouble now costs well over $2 in most of the US, while a typical Big Mac is still well under $6. You used to be able to get 4-5 McDoubles for the price of a Big Mac; now you typically get less than 3 and sometimes, as in Keene, less than 2.
What’s going on here? First, the McDouble was always absurdly cheap. Second, prices rise most quickly where demand is inelastic, and demand is less elastic for goods that are cheaper and goods that are more like “necessities” than “luxuries”.
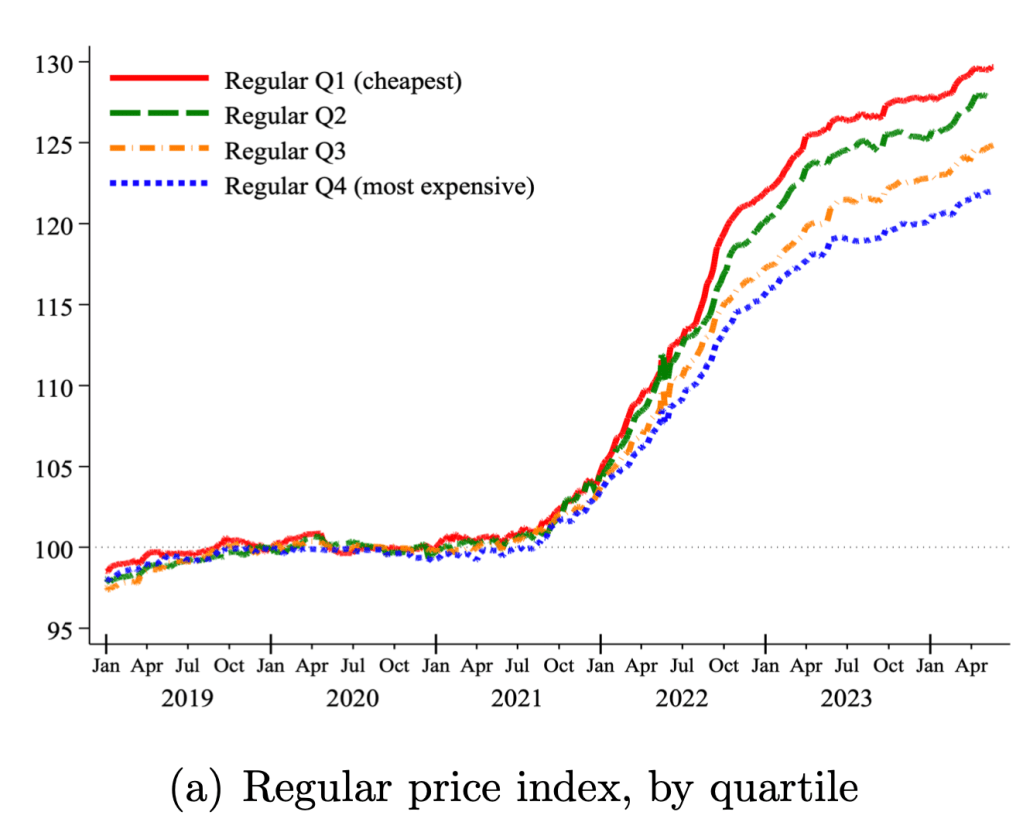
We use micro price data for food products sold by 91 large multi-channel retailers in ten countries between 2018 and 2024. Measuring unit prices within narrowly defined product categories, we analyze two key sources of variation in prices within a store: temporary price discounts and differences across similar products. Price changes associated with discounts grew at a much lower average rate than regular prices, helping to mitigate the inflation burden. By contrast, cheapflation—a faster rise in prices of cheaper goods relative to prices of more expensive varieties of the same good—exacerbated it. Using Canadian Homescan Panel Data, we estimate that spending on discounts reduced the change in the average unit price by 4.1 percentage points, but expenditure switching to cheaper brands raised it by 2.8 percentage points….
The prices of cheaper brands grew between 1.3 to 1.9 times faster than the prices of more expensive brands—and only when inflation surged, not before or after.
Last Friday the Supreme Court overturned the doctrine of Chevron deference as part of its ruling in Loper Bright Enterprises v Raimondo. This might not have even been their most discussed ruling of the past week, but in my (non-lawyerly) opinion, there is a good chance it will be their most economically impactful ruling of the past decade. SCOTUSblog explains the basics:
the Supreme Court on Friday cut back sharply on the power of federal agencies to interpret the laws they administer and ruled that courts should rely on their own interpretation of ambiguous laws. The decision will likely have far-reaching effects across the country, from environmental regulation to healthcare costs.
By a vote of 6-3, the justices overruled their landmark 1984 decision in Chevron v. Natural Resources Defense Council, which gave rise to the doctrine known as the Chevron doctrine. Under that doctrine, if Congress has not directly addressed the question at the center of a dispute, a court was required to uphold the agency’s interpretation of the statute as long as it was reasonable. But in a 35-page ruling by Chief Justice John Roberts, the justices rejected that doctrine, calling it “fundamentally misguided.”
Justice Elena Kagan dissented, in an opinion joined by Justices Sonia Sotomayor and Ketanji Brown Jackson. Kagan predicted that Friday’s ruling “will cause a massive shock to the legal system.”
When the Supreme Court first issued its decision in the Chevron case more than 40 years ago, the decision was not necessarily regarded as a particularly consequential one. But in the years since then, it became one of the most important rulings on federal administrative law, cited by federal courts more than 18,000 times.
The most common reaction I’ve seen is that people expect this to reduce the power of executive branch agencies, both in general and relative to courts and businesses, likely resulting in deregulation. Thus those on the economic left have been mostly decrying the decisions, while free–marketers and businesspeoplehave mostly beencelebrating:
The Fed has now almost landed the plane, bringing us down from 9% inflation during the Covid era to something approaching their 2% target today. But it is not yet clear how hard the landing will be. Back in March I thought recurrent inflation was still the big risk; now I see the risk of inflation and recession as balanced. This is because inflation risks are slightly down, while recession risk is up.
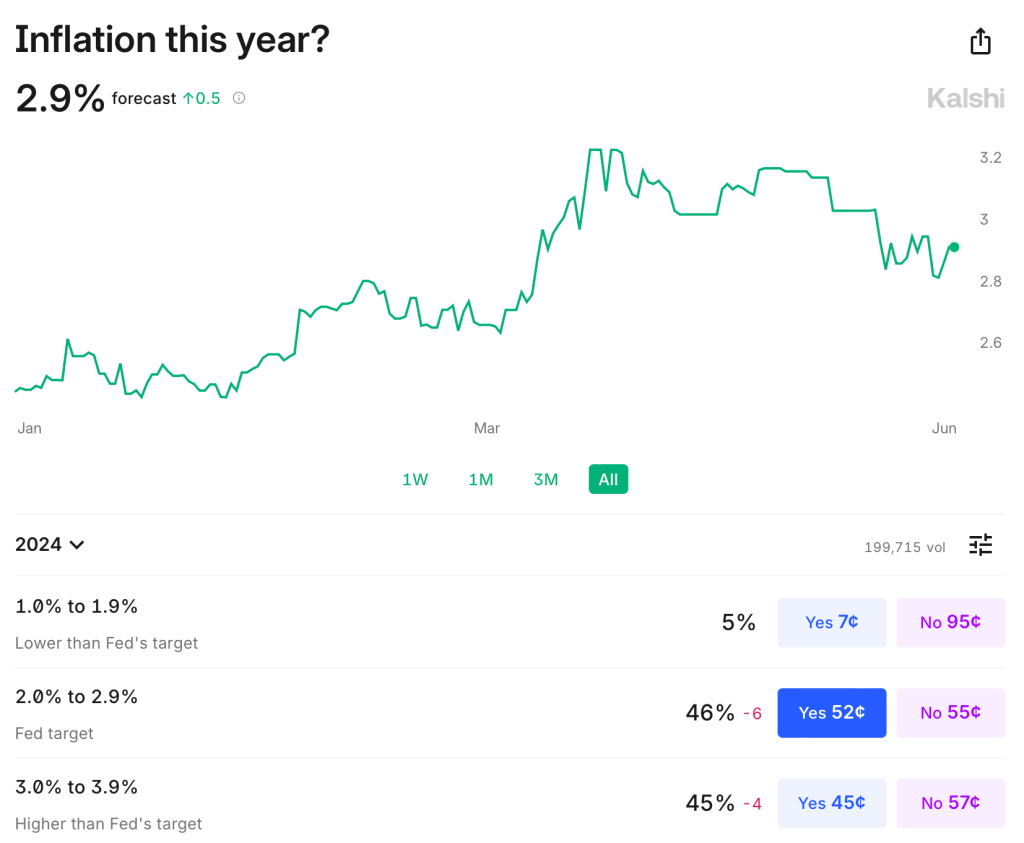
Inflation remains somewhat above target: over the last year it was 3.3% using CPI, 2.7% by PCE, and 2.8% by core PCE. It is predicted to stay slightly above target: Kalshi estimates CPI will finish the year up 2.9%; the TIPS spread implies 2.2% average inflation over the next 5 years; the Fed’s own projections say that PCE will finish the year up 2.6%, not falling to 2.0% until 2026. The labels on Kalshi imply that markets are starting to think the Fed’s real target isn’t 2.0%, but instead 2.0-2.9%:
The Fed’s own projections suggest this to be the somewhat the case- they plan to start cutting over a year before they expect inflation to hit 2.0%, though they still expect a long run rate of 2.0%. In short, I think there is a strong “risk” that inflation stays a bit elevated the next year or two, but the risk that it goes back over 4% is low and falling. M2 is basically flat over the last year, though still above the pre-Covid trend. PPI is also flat. The further we get from the big price hikes of ’21-’22 with no more signs of acceleration, the better.
But I would no longer say the labor market is “quite tight”. Payrolls remain strong but unemployment is up to 4.0%. This is still low in absolute terms, but it’s the highest since January 2022, and the increase is close to triggering the Sahm rule (which would predict a recession). Prime-age EPOP remains strong though. The yield curve remains inverted, which is supposed to predict recessions, but it has been inverted for so long now without one that the rule may no longer hold.
Looking through this data I think the Fed is close to on target, though if I had to pick I’d say the bigger risk is still that things are too hot/inflationary given the state of fiscal policy. But things are getting close enough to balanced that it will be easy for anyone to find data to argue for the side that they prefer based on their temperament or politics.
To me the big wild card is the stock market. The S&P500 is up 25% over the past year, driven by the AI boom, and to some extent it pulls the economy along with it. The Conference Board’s leading economic indicators are negative but improving overall this year; recently their financial indicators are flat while non-financial indicators are worsening.
Overall things remind me a lot of the late ’90s: the real economy running a bit hot with inflation around 3% and unemployment around 4%; the Fed Funds rate around 5%; and a booming stock market driven by new computing technologies. Naturally I wonder if things will end the same way: irrational exuberance in the stock market giving way to a tech-driven stock market crash, which in turn pushes the real economy into a mild recession.
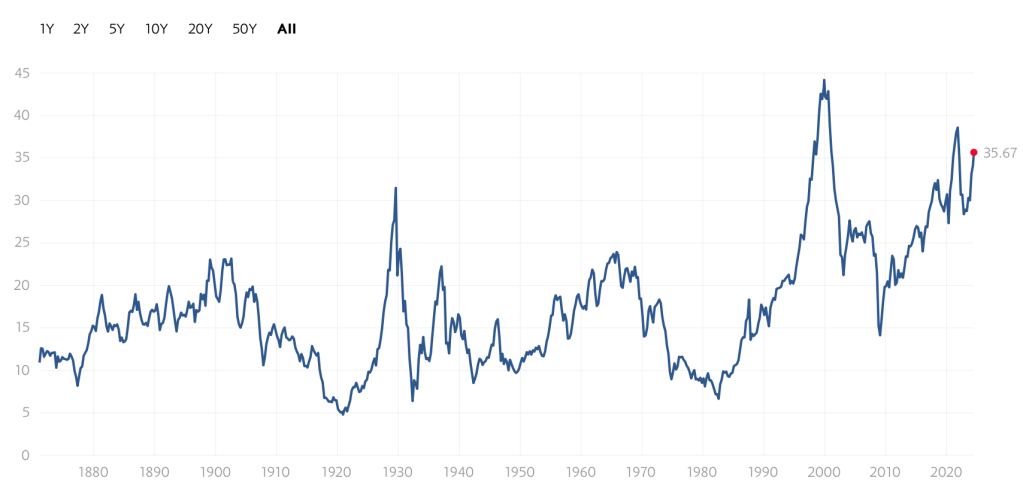
Of course there is no reason this AI boom has to end the same way as the late-90’s internet boom/bubble. There are certainly differences: the Federal government is running a big deficit instead of a surplus; there are barely a tenth as many companies doing IPOs; many unprofitable tech stocks already got shaken out in 2022, while the big AI stocks are soaring on real profits today, not just expectations. Still, to the extent that there are any rules in predicting stock crashes, the signs are worrying. Today’s Shiller CAPE is below only the internet and Covid meme-stock bubble peaks:
Again, this doesn’t mean that stocks have to crash, or especially that they have to do it soon; the CAPE reached current levels in early 1998, but then stocks kept booming for almost two years. I’m not short the market. But the macro risk it poses is real.
Morgan Housel’s Psychology of Money is not much like other personal finance books. Rather than making recommendations about exactly what to do and how to do it, Housel tells stories about how people’s different attitudes toward money serve them well or poorly. His stance is that most people already know what they should do, so he doesn’t need to explain that, but instead needs to explain why people so often don’t do what they know they should (e.g. save more). The book is not only pleasant to read, but at least for me exerts a calming effect I definitely do not normally associate with the finance genre, as if the subtext of “just be chill, be patient, follow the plan and everything will be alright” is continually seeping into my brain. Some highlights:
The idea of retirement is fairly new. Labor force participation for men over 65 is only about 20% today, but was well over 50% prior to the introduction of Social Security. Even once it started, Social Security paid in real terms about a quarter of what it does today. Plus pensions weren’t as common as people think; as of 1975 only a quarter of those over 65 had pensions, and most of those didn’t pay much. The 401k didn’t exist until 1978; the Roth IRA until 1998. “It should surprise no one that many of us are bad at saving and investing for retirement. We’re not crazy. We’re all just newbies.”
If you are disappointed whenever the price of your stocks goes down, you are in for a bad time, though you will do well if you can just ignore it:
“Netflix stock returned more than 35,000% from 2002 to 2018, but traded below its previous all-time high on 94% of days. Monster Beverage returned 319,000% from 1995 to 2018- among the highest returns in history- but traded below its previous high 95% of the time during that period…. this is the price of market returns.”
Housel isn’t very prescriptive because he recognizes how much people differ: “I can’t tell you what to do with your money, because I don’t know you. I don’t know what you want. I don’t know when you want it. I don’t know why you want it.”
At the end explains what he does with his own money: “Effectively all of our net worth is a house, a checking account, and some Vanguard index funds.” He convincingly argues that his way isn’t for everyone; he paid off his house early but “I don’t try to defend this decision to those pointing out its flaws, or to those who would never do the same. On paper it’s defenseless. But it works for us. We like it. That’s what matters.”
The closest he gets to specific recommendation is “for most investors, dollar-cost averaging into a low-cost index fund will provide the highest odds of long-term success.” There are lots of more general recommendations about good mindsets to take, for instance:
The few people who know the details of our finances ask, ‘What are you saving for? A house? A boat? A new car?’ No, none of those. I’m saving for a world where curveballs are more common than we expect.
Overall this is an easy book to recommend- it is both pleasant and easy to read, and gives good advice. My main complaint is that it is short on the nuts and bolts of how you actually do this stuff; for someone who doesn’t already know, it would pair well with a book that is stronger on that front, like I Will Teach You to Be Rich.
I’m back from Manifest, a conference on prediction markets, forecasting, and the future. It was an incredible chance to hear from many of my favorite writers on the internet, along with the CEOs of most major prediction markets; in Steve Hsu’s words, Woodstock for Nerds. Some highlights:
Robin Hanson took over my session on academic research on prediction markets (in a good way; once he was there everyone just wanted to ask him questions). He thinks the biggest current question for the field is to figure out why is the demand for prediction markets so low. What are the different types of demand, and which is most likely to scale? In a different talk, Robin says that we need to either turn the ship of world culture, or get off in lifeboats, before falling fertility in a global monoculture wrecks it.
Play-money prediction markets were surprisingly effective relative to real-money ones in the 2022 midterms. Stephen Grugett, co-founder of Manifold (the play-money prediction market that put on the conference), admitted that success in one election could simply be a coincidence. He himself was surprised by how well they did in the 2022 midterms, and said he lost a bunch of mana on bets assuming that Polymarket was more accurate.
Substack CEO Chris Best: No one wants to pay money for internet writing in the abstract, but everyone wants to pay their favorite writer. For me, that was Scott Alexander. We are trying to copy Twitter a bit. Wants to move into improving scientific publishing. I asked about the prospects of ending the feud with Elon; Best says Substack links aren’t treated much worse than any other links on X anymore.
Razib Khan explained the strings he had to pull for his son to be the first to get a whole genome sequence in utero back in 2014- ask the hospital to do a regular genetic test, ask them for the sample, get a journalist to tweet at them when they say no, get his PI’s lab to run the sample. He thinks crispr companies could be at the nadir of the hype cycle (good time to invest?).
Kalshi cofounder Luana Lopes Lara says they are considering paying interest on long term markets, and offering margin. There is enough money in it now that their top 10 or so traders are full time (earning enough that they don’t need a job). The CFTC has approved everything we send them except for once (elections). We don’t think their current rule banning contest markets will go through, but if it does we would have to take down Oscar and Grammy markets. When we get tired of the CFTC, we joke that we should self certify shallot futures markets (toeing the line of the forbidden onion futures). Planning to expand to Europe via brokerages. Added bounty program to find rules problems. Launching 30-50 markets per week now (seems like a good opportunity, these can’t all be efficient right?).
There was lots else of interest, but to keep things short I’ll just say it was way more fun and informative doing yet another academic conference, where I’ve hit diminishing returns. More highlights from Theo Jaffee here; I also loved economist Scott Sumner’s take on a similar conference at the same venue in Berkeley:
If you spend a fair bit of time surrounded by people in this sector, you begin to think that San Francisco is the only city that matters; everywhere else is just a backwater. There’s a sense that the world we live in today will soon come to an end, replaced by either a better world or human extinction. It’s the Bay Area’s world, we just live in it.
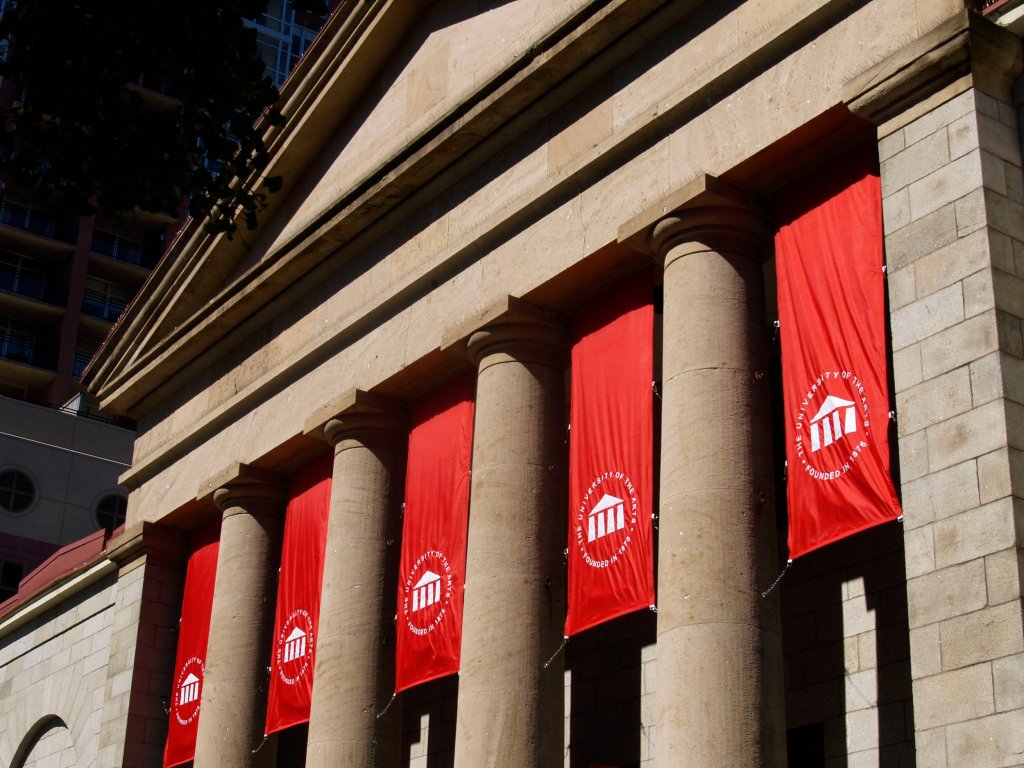
This week the University of the Arts in Philadelphia announced they were closing effective immediately, leaving students scrambling to transfer and faculty desperate for jobs. U Arts now joins Cabrini University and Birmingham-Southern as some the 20 US colleges closing or being forced to merge so far this year. This trend of closures is likely to accelerate given falling birth rates that mean the number of college-age Americans is set to decline for decades; short-term issues like the FAFSA snafu and rising interest rates aren’t helping either.
All this makes it more important for potential students and employees to consider the financial health of colleges they might join, lest they find themselves in a UArts type situation. But how do you predict which colleges are at significant risk of closing? One thing that jumps out from this year’s list of closures is that essentially every one is a very small (fewer than 2000 undergrad) private school. Rural schools seem especially vulnerable, though this year has also seen plenty of closures in major cities.
There appear to be a number of sourcestracking the financial health of colleges, though most are not kept up to date well. Forbes seems to be the best, with 2023 ratings here; UArts, Cabrini, and Birmingham-Southern all had “C” grades. If you have access to them, credit ratings would also be good to check out; Fitch offers a generally negative take on higher ed here.
In a 2020 Brookings paper, Robert Kelchen identified several statistically significant predictors of college closures:
I used publicly available data compiled by the federal government to examine factors associated with college closures within the following two to four years. I found several factors, such as sharp declines in enrollment and total revenue, that were reasonably strong predictors of closure. Poor performances on federal accountability measures, such as the cohort default rate, financial responsibility metric, and being placed on the most stringent level of Heightened Cash Monitoring, were frequently associated with a higher likelihood of closure. My resulting models were generally able to place a majority of colleges that closed into a high-risk category
The Higher Learning Commission reached similar conclusions. Of course, there is a danger in identifying at-risk colleges too publicly:
Since a majority of colleges identified of being at the highest risk of closure remained open even four years later, there are practical and ethical concerns with using these results in the policy process. The greatest concern is that these results become a self-fulfilling prophecy— being identified as at risk of closure could hasten a struggling college’s demise.
Still, would-be students, staff and faculty should do some basic research to protect themselves as they considering enrolling or accepting a job at a college. College employees would also do well to save money and keep their resumes ready; some of these closures are so sudden that employees find out they are out of a job effective immediately and no paycheck is coming next month.
Supporters of prediction markets tend to emphasize how they are great tools for aggregating information to produce accurate forecasts. If you want to know e.g. who is likely to win the next election, you can watch every poll and listen to pundits for hours, or you can take ten seconds to check the odds. This is great for people who want information- but how do prediction markets fare as investments for their actual participants?
Zero Sum
The big problem with prediction markets as investments is that they are zero sum (or negative sum once fees are factored in). You can’t make money except by taking it from the person on the other side of the bet. This is different from stocks and bonds, where you can win just by buying and holding a diversified portfolio. Buy a bunch of random stocks, and on average you will earn about 7% per year. Buy into a bunch of random prediction markets, and on average you will earn 0% at best (less if there are fees or slippage).
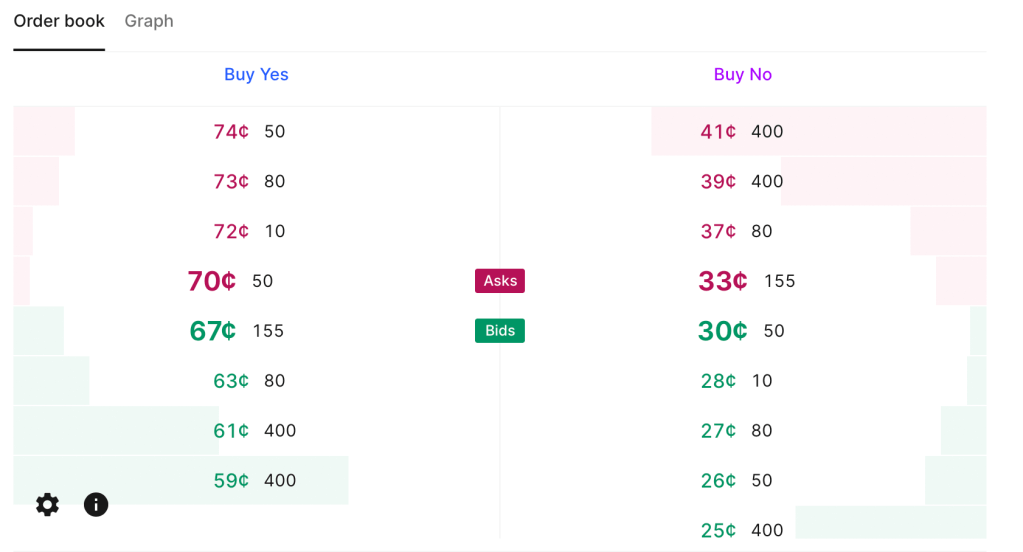
Low Liquidity
Current Kalshi order book for “Will June 2024 be the hottest June ever“. Betting $200 on either outcome could move the price by 5 cents (so move the estimated probability by 5pp).
This zero sum problem is close to inevitable based on how prediction markets work. They currently have one other big problem, though it is not inevitable, and is getting better as they grow: liquidity. There are some stocks and bonds where big institutions can buy or sell millions of dollars worth without moving the price. But in markets like Kalshi or PredictIt, I personally move prices often by betting just hundreds, or sometimes even just tens, of dollars. Buying at scale means getting worse prices, if you can even buy at all. PredictIt has a bet limit of $850 per contract for regulatory reasons. This definitely excludes institutional investors, but even for individuals it can mean many markets aren’t worthwhile. Say an outcome is already priced at 90 cents, the most you can make by betting it happens is about $94. That’s not nothing but its also not enough to incentivize lots of in-depth research, especially given the risk of losing the $850 if you are wrong and the opportunity cost of investing the money in stocks or bonds. Kalshi in theory allows bets up to $25k, but most of their markets haven’t had the liquidity to absorb a bet anywhere near that (though this could be changing).
Easy Alpha
Given these negatives, why would anyone want to participate in prediction markets, except to gamble or to generously donate their time to create information for everyone else? Probably because they think they can beat the market. Compared to the stock market, this is a fairly realistic goal. Perhaps because the low liquidity keeps out institutional investors, it isn’t that hard for a smart and informed investor to find mispricings or even pure arbitrages in prediction markets. This seems to be especially true with political prediction markets, where people often make bets because they personally like or dislike a candidate, rather than based on their actual chances of winning; that is exactly the kind of counterparty I want to be trading with.
I’ve been on PredictIt since 2018 and earned a 16% total return after fees; this was on hundreds of separate trades so I think it is mostly skill, not luck. Of course, even with this alpha, 16% total (not annual) return over 6 years is not great compared to stocks. On the other hand, I tended to put money in right before big elections and take it out after, so the money is mostly not tied up in PredictIt the whole time; the actual IRR is significantly better, though harder to calculate. On the other other hand, the actual dollar amount I made is probably not great compared to the time I put in. On yet another hand, the time isn’t a big deal if you are already following the subject (e.g the election) anyway.
Uncorrelated Alpha
The other big positive about prediction markets is that there is no reason to expect your returns there are correlated with your returns in traditional markets. Institutional investors are often looking for investments that can do well when stocks are down, and are willing to sacrifice some expected returns to get it. In fact, there may be ways to get a negative correlation between your prediction market returns and your other returns, hedging by betting on outcomes that would otherwise harm you. For instance, you can hedge against inflation by betting it will rise, or hedge against a recession by betting one happens. If you are right, you make some money by winning the bet; if you are wrong, you lose money on the bet but your other investments are probably doing well in the low-inflation no-recession environment.
Going Forward
Prediction markets have long been in a regulatory grey area in the US, but with the emergence of Kalshi and the current CFTC, everything may soon be black and white. Kalshi has won full approval from the CFTC for a variety of markets, but the CFTC is moving to completely ban betting on elections (you can comment on their proposal here until July 9th).
One great place to discuss the future of prediction markets will be Manifest, a conference hosted by play-money market Manifold in Berkeley, CA June 7-9th. It features the founders of most major US predictions markets and many of the bestwriters on prediction markets. I’ll be there, and as I write tickets are still available.
Henrik Karlsson read lots of biographies of geniuses and tried to sum up the things their childhoods had in common here. Some highlights:
At least two-thirds of my sample was home-educated (most commonly until about age 12), tutored by parents or governesses and tutors. The rest of my sample had been educated in schools (most commonly Jesuit schools).
As children, they were integrated with exceptional adults—and were taken seriously by them.
They had time to roam about and relied heavily on self-directed learning
A common theme in the biographies is that the area of study which would eventually give them fame came to them almost like a wild hallucination induced by overdosing on boredom. They would be overcome by an obsession arising from within.
They were heavily tutored 1-on-1
An important factor to acknowledge is that these children did not only receive an exceptional education; they were also exceptionally gifted.
There is lots of discussion of John Stuart Mill and John Von Neumann, who each had major contributions to economics:
When they were done, James Mill took his son’s notes and polished them into the book Elements of Political Economy. It was published the year John Stuart turned fifteen….
There is a moving scene in John Stuart Mill’s biography, when John Stuart is about to set out into the world and his father for the first time lets him know that his education had been . . . a bit particular. He would discover that others his age did not know as much as he did. But, his father said, he mustn’t feel proud about that. He’d just been lucky.
Let’s make more people lucky.
Other nice posts along similar lines are Erik Hoel’s “How Geniuses Used to Be Raised” (linked in Karlsson’s piece), and Scott Alexander’s review of Laszlo Polgar’s book “Raise a Genius” (about raising his 3 daughters to be chess grandmasters). Karlsson’s post, worth reading in full, is here.
I was writing up something for my graduating seniors about how to keep learning economics after school, and realized I might as well share it with everyone. This may not be the best way to do things, it is simply what I do, and I think it works reasonably well.
Blogs by Economists: There are many good ones, but besides ours Marginal Revolution is the only one where I aim to read every post
Podcasts on the Economy: NPR’s The Indicator (short, makes abstract concepts concrete), Bloomberg’s Odd Lots (deeper dives on subjects that move financial markets)
Podcasts by Economists: Conversations with Tyler and Econtalk (note that both often cover topics well outside of economics). Macro Musings goes the other way and stays super focused on monetary policy.
Twitter/X: This is a double-edged sword, or perhaps even a ring of power that grants the wearer great abilities even as it corrupts them. The fastest way to get informed or misinformed and angry, depending on who you follow and how you process information. Following the people I do gives you a fighting chance, but even this no guarantee; even assuming you totally trust my judgement, sometimes I follow people because they are a great source on one issue, even though I think they are wrong on lots of other things. Still, by revealed preference, I spend more time reading here than other single source.
Finance/Investing: Making this its own category because it isn’t exactly economics. Matt Levine has a column that somehow makes finance consistently interesting and often funny; unlike the rest of Bloomberg, you can subscribe for free. He also now has a podcast. If you’d like to run money yourself some day, try Meb Faber’s podcast. If you’d like things that touch on finance and economics but with more of a grounding in real-world business, try the Invest Like the Best podcast or The Diff newsletter.
Economics Papers: You can get a weekly e-mail of the new papers in each field you like from NBER. But most econ papers these days are tough to read even for someone with an undergrad econ degree (often even for PhDs). The big exception is the Journal of Economic Perspectives, which puts in a big effort to make its papers actually readable.
Books: This would have to be its own post, as there are too many specific ones to recommend, and I don’t know that I have any general principle of how to choose.
This is a lot and it would be crazy to just read all the same things I do, but I hope you will look into the things you haven’t heard of, and perhaps find one or two you think are worth sticking with. Also happy to hear your suggestions of what I’m missing.
We put my daughter on a waitlist for the daycare her siblings attended when she was one month old. Fourteen months later, she is still waiting, and we are looking around for other options. Almost every daycare I contact is full, with many saying their waitlists run into 2025.
This sounds like a classic shortage: demand exceeds supply at prevailing prices. But I am puzzled by such a shortage in the absence of price controls. Why don’t these daycares simply raise prices enough to eliminate their waitlists?
Theories:
The kind of person who runs a daycare is not inclined to act as a ruthlessly efficient profit maximizer. This probably explains some of it, but some of the daycares are literally publicly traded for-profit corporations, and they still have big waitlists.
Daycares deliberately underprice infant care as a loss leader to sell care to older kids. Sure, they could raise prices for infants and make more money today, but they want to make sure their preschool stays full down the road, and the easy way to do that is to keep infants as they age.
This is a temporary dislocation due to Covid. Demand fell off during Covid, some centers closed, then demand came back and the remaining centers are full. Perhaps opening a new center would be a good business, but regulation is slowing this down, or people just haven’t realized the opportunity yet.
I think there is something to each of these, but I still feel puzzled, especially since the most expensive locations seem to have the longest waits (at least here in Rhode Island). I can’t come up with a definite answer without lots more data on prices, waitlist sizes, entry, and exit. But I’d love to hear your theories.


