What I Learned from Erwin Blackstone

I’m told that Professor Erwin Blackstone died earlier this year, but I haven’t been able to find anything like an obituary online; consider this a personal memorial.

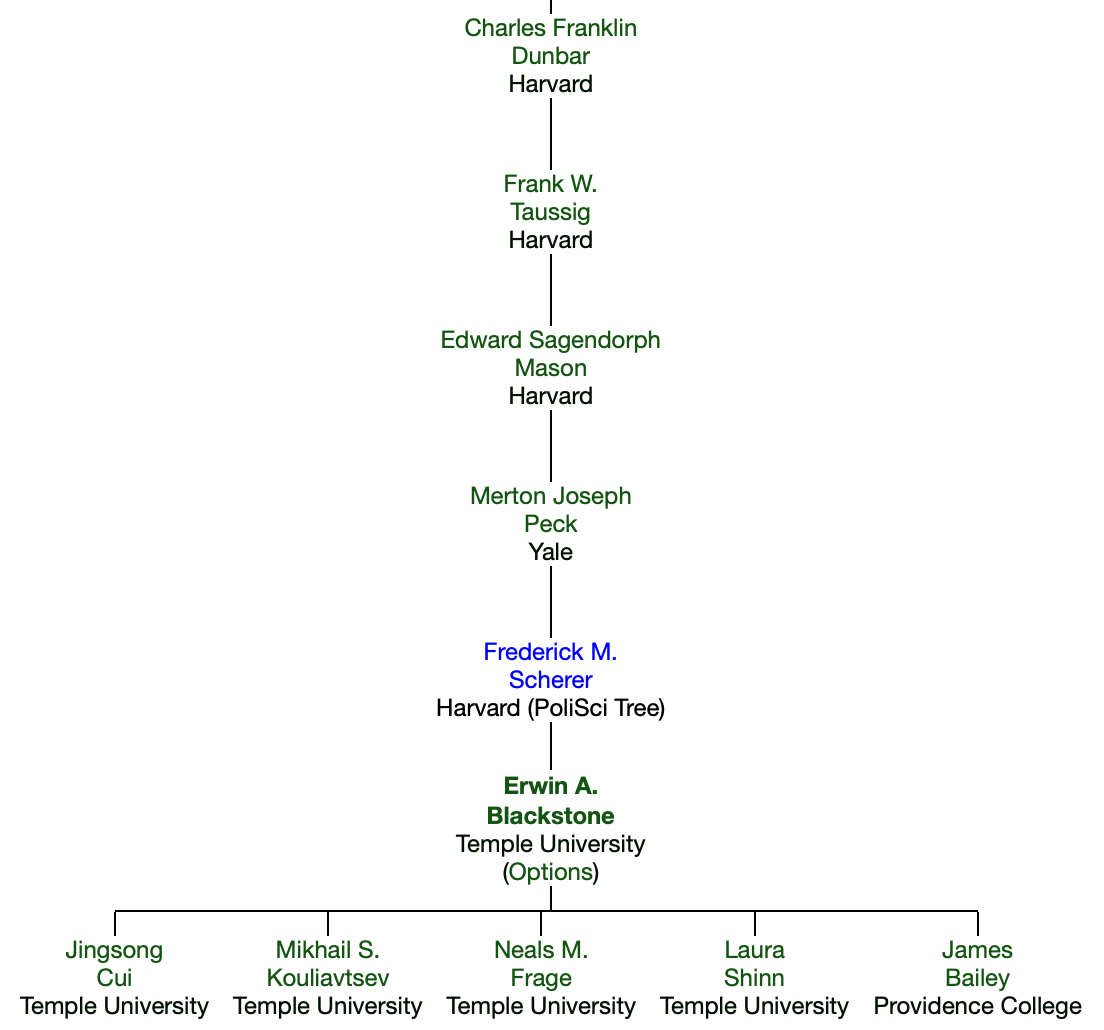
I knew Dr. Blackstone first as the professor of my Industrial Organization class at Temple University, where he taught since 1976. He was a model of how to take students seriously and treat them respectfully; he always called on us as “Mr./Ms. Last Name” and thought carefully about our questions.

Of course I learned all sorts of particular things about IO, especially US antitrust law and history- from Judge Learned Hand and baseball’s antitrust exemption to current merger guidelines and cases. I would later ask Dr. Blackstone to join my thesis committee, where he would heavily mark up my papers with comments and critiques.

He was a key part of how I was able to become a health economist despite the fact that Temple lacked a true health economist on the tenure-track economics faculty while I was there (as opposed to IO or labor economists who did some health). Blackstone’s coauthor Joseph Fuhr– a true health economist who also had Blackstone on the committee of his 1980 dissertation- came part-time to teach graduate health economics. Blackstone and Fuhr worked together to write the health economics field exam I took.

Finally, I learned from Blackstone by reading his papers. While he wrote many on health economics, my personal favorite was his work with Andrew Buck and Simon Hakim on foster care and adoption. It convincingly demonstrated the problems of having one fixed price in an area that most people don’t think about as a “price” at all- adoption fees. Having one fairly high fee for all children means the few seen as most desirable by adopting parents (typically younger, whiter, healthier) get adopted quickly, while those seen as less desirable by would-be adoptive parents linger in foster care for years. Like much of his work, it pairs a simple economic insight with a rich explanation of the relevant institutional details.

Academics hope to live on through our work- through our writing and the people we taught. Having taught many thousands of students at Cornell, Dartmouth, and Temple over 55 years, served on dozens of dissertation committees, and published over 50 papers and several books, I expect that it will be a long, long time before Erwin Blackstone is forgotten.

Source: Academic Tree. Charles Franklin Dunbar founded the Quarterly Journal of Economics in 1886.

Predicting College Closures: Now with Machine Learning

Small, rural, private schools stand out to me as the most likely to show up on lists of closed colleges. This summer I discussed a 2020 paper by Robert Kelchen that identified additional predictors using traditional regression:

sharp declines in enrollment and total revenue, that were reasonably strong predictors of closure. Poor performances on federal accountability measures, such as the cohort default rate, financial responsibility metric, and being placed on the most stringent level of Heightened Cash Monitoring

Kelchen just released a Philly Fed working paper (joint with Dubravka Ritter and Doug Webber) that uses machine learning and new data sources to identify more predictors of college closures:

The current monitoring solution to predicting the financial distress and closure of institutions — at least at the federal level — is to provide straightforward and intuitive financial performance metrics that are correlated with closure. These federal performance metrics represent helpful but suboptimal measures for purposes of predicting closures for two reasons: data availability and predictive accuracy. We document a high degree of missing data among colleges that eventually close, show that this is a key impediment to identifying institutions at risk of closure, and also show how modern machine learning algorithms can provide a concrete solution to this problem.

The paper also provides a great overview of the state of higher ed. The sector is currently quite large:

The American postsecondary education system today consists of approximately 6,000 colleges and universities that receive federal financial aid under Title IV of the federal Higher Education Act…. American higher education directly produces approximately $700 billion in expenditures, enrolls nearly 25 million students, and has approximately 3 million employees

Falling demand from the demographic cliff is causing prices to fall, in addition to closures:

Between the early 1970s and mid-2010s, listed real tuition and fee rates more than tripled at public and private nonprofit colleges, as strong demand for higher education allowed colleges to continue increasing their prices. But since 2018, tuition increases have consistently been below the rate of inflation

Most college revenue comes from tuition or from state support of public schools; gifts and grants are highly concentrated:

Research funding is distributed across a larger group of institutions, although the vast majority of dollars flows to the 146 institutions that are designated as Research I universities in the Carnegie classifications…. Just 136 colleges or university systems in the United States had endowments of more than $1 billion in fiscal year 2023, but they account for more than 80 percent of all endowment assets in American higher education. Going further, five institutions held 25 percent of all endowment assets, and 25 institutions held half of all assets

Now lets get to closures. As I thought, size matters:

most institutions that close are somewhat smaller than average, with the median closed school enrolling a student body of about 1,389 full-time equivalent students several years prior to closure

As does being private, especially private for-profit (states won’t bail you out when you lose money):

As do trends:

variables measuring ratios of financial metrics and those measuring changes in covariates are generally more important than those measuring the level of those covariates

When they throw hundreds of variables into a machine learning model, it can predict most closures with relatively few false positives, though no one variable stands out much (FRC is Financial Responsibility Composite):

My impression is that the easiest red flag to check for regular people who don’t want to dig into financials is “is total enrollment under 2000 and falling at a private school”.

They predict that the coming Demographic Cliff (the falling number of new 18-year-olds each year) will lead to many more closures, though nothing like the “half of all colleges” you sometimes hear:

The full paper is available ungated here. I’ll close by reiterating my advice from the last post: would-be students, staff, and faculty should do some basic research to protect themselves as they consider enrolling or accepting a job at a college. College employees would also do well to save money and keep their resumes ready; some of these closures are so sudden that employees find out they are out of a job effective immediately and no paycheck is coming next month.

We’ve Got You Covered

That’s the title of a recent book by Liran Einav and Amy Finkelstein, subtitled “Rebooting American Health Care”. I reviewed the book for Independent Review; the short version of my review is that while I don’t agree with all of their policy proposals, the book makes for an engaging, accurate, and easily readable introduction to the current US health care system. Here’s the start of the review:

Liran Einav and Amy Finkelstein are easily two of the best health economists of their generation. They have each spent twenty years churning out insightful papers published in the top economics journals. As a young health economist, I would read their papers and admire how well they addressed the technical issues at hand, but I was always left wondering what they thought about the big picture of health care in the United States….

The book’s prologue describes how Finkelstein’s father-in-law finally bullied her into writing on the topic, using almost the exact words I always wanted to: “I know these are hard issues. But come on … You’ve been studying them for twenty years. You must be one of the best placed people to help us understand the options. Do you really have nothing to say on this topic?”

The conclusion:

I learned a lot reading the book, despite having already studied U.S. health financing for over a decade—for instance, that the first compulsory health insurance program in the U.S. was a 1798 law pushed by Alexander Hamilton to cover foreign sailors. While the authors are more used to writing math-heavy academic papers, We’ve Got You Covered reads like the popular press book it is. Perhaps the highest endorsement comes from a non-academic family member of mine who picked up the book and noted, “These are not dry writers … this doesn’t sound like a book written by economists, no offense.”

The full review is free here, the book is for sale here.

The Laboratory of the States: Regulatory Reform Edition

The US Federal government has been considering major reforms like the REINS Act, which would require Congressional approval of major regulations proposed by executive branch agencies, or bringing back the “two in one out” rule from the first Trump administration. What would these do?

Right now it’s hard to say much for sure. But similar reforms have already been implemented in the states; as usual, the states provide a laboratory for investigating how policies work and whether they deserve broader adoption. It’s especially valuable to inform the debate over reforms like the REINS act that are still being considered at the federal level. Even for federal reforms that have already happened, it can be easier to evaluate the state version, since states make better control groups for each other than other countries do for the US.

But so far we’ve mostly been ignoring our laboratory results from recent state regulatory reforms. For instance, Broughel, Baugus, and Bose (2022) released a dataset that could be used to evaluate state regulatory reforms, but it has only been cited 3 times. This is why I’m adding this to my ideas page as a good subject for future academic research.  Do state REINS or Red Tape Reduction Acts actually reduce either the stock or flow of regulation? If so, which types of regulations are affected, and does this have any effect on downstream measures like economic growth or new business formation?

Any research along these lines could help inform policy debates in the states, as well as for a new Presidential administration coming in with hopes of boosting economic growth through deregulation.

HT: Adam Millsap

Effort Transparency and Fairness Published at Public Choice

Please see my latest paper, out at Public Choice: Effort transparency and fairness

The published version is better, but you can find our old working paper at SSRN “Effort Transparency and Fairness

Abstract: We study how transparent information about effort impacts the allocation of earnings in a dictator game experiment. We manipulate information about the respective contributions to a joint endowment that a dictator can keep or share with a counterpart…

Employees within an organization are sensitive to whether they are being treated fairly. Greater organizational fairness is shown to improve job satisfaction, reduce employee turnover, and boost the organization’s reputation. To study how transparent information impacts fairness perceptions, we conduct a dictator game with a jointly earned endowment. 

The endowment is earned by completing a real effort task in the experiment, an analog to the labor employees contribute to employers. First, two players work independently to create a pool of money. Then, the subject assigned the role of the “dictator” allocates the final earnings between them.

In the transparent treatment, both dictators and recipients have access to complete information about their own effort levels and contributions, as well as those of their counterparts. In the non-transparent treatment, dictators have full information about the relative contributions of both players, but recipients do not know how much each person contributed to the endowment. The two treatments allow us to compare the behaviors of dictators who know they could be judged and held to reciprocity norms with dictators who do not face the same level of scrutiny.

*drumroll* results:

This graph shows the amount of money the dictators take from the recipient contribution, in cents.  There are two ways to look at this. Notice the spike next to zero. Most dictators do not take much from what their counterpart earned. They are *dictators*, meaning they could take everything. Most take almost nothing, regardless of the treatment. We interpret this to mean that they are acting out of a sense of fairness, and we apply a humanomics framework to explain this in the paper.

Also, there is significantly more taken in non-transparency. When the worker does not have good information on the meritocratic outcome, then some dictators feel like they can get away with taking more. Some of this happens through what we call “shading down” of the amount sent by the dictator under the cover of non-transparency.

There is more in the paper, but the last thing I’ll point out here is that the “worker” subjects (recipients) anticipate that this will happen. The recipients forecast that the dictator would take more under non-transparency. In our conclusion, we mention that, even though the dictator seems to be at an advantage in a non-transparent environment, the dictator still might choose a transparency policy if it affects which workers select into the team.

View and download your article*   This hyperlink is good for a limited number of free downloads of my paper with Demiral and Saglam, says Springer the publisher. Please don’t waste it, but if you want the article I might as well put it out there. I posted this on 11/2/2024, so there is no guarantee that the link will work for you.

Cite our article: Buchanan, J., Demiral, E.E. & Sağlam, Ü. Effort transparency and fairness. Public Choice (2024). https://doi.org/10.1007/s11127-024-01230-9

Can researchers recruit human subjects online to take surveys anymore?

The experimental economics world is currently still doing data collection in traditional physical labs with human subjects who show up in person. This is still the gold standard, but it is expensive per observation. Many researchers, including myself, also do projects with subjects that are recruited online because the cost per observation is much lower.

As I remember it, the first platform that got widely used was Mechanical Turk. Prior to 2022, the attitude toward MTurk changed. It became known in the behavioral research community that MTurk had too many bots and bad actors. MTurk had not been designed for researchers, so maybe it’s not surprising that it did not serve our purposes.

The Prolific platform has had a good reputation for a few years. You have to pay to use Prolific but the cost per observation is still much lower than what it costs to use a traditional physical laboratory or to pay Americans to show up for an appointment. Prolific is especially attractive if the experiment is short and does not require a long span of attention from human subjects.

Here is a new paper on whether supposedly human subjects are going to be reliably human in the future: Detecting the corruption of online questionnaires by artificial intelligence   

Continue reading

Long-Run Prediction Markets Just Got More Accurate

Kalshi just announced that they will begin paying interest on money that customers keep with them, including money bet on prediction market contracts (though attentive readers here knew was in the works). I think this is a big deal.

First, and most obviously, it makes prediction markets better for bettors. This was previously a big drawback:

The big problem with prediction markets as investments is that they are zero sum (or negative sum once fees are factored in). You can’t make money except by taking it from the person on the other side of the bet. This is different from stocks and bonds, where you can win just by buying and holding a diversified portfolio. Buy a bunch of random stocks, and on average you will earn about 7% per year. Buy into a bunch of random prediction markets, and on average you will earn 0% at best (less if there are fees or slippage).

This big problem just went away, at least for election markets (soon to be all markets) on Kalshi. But the biggest benefit could be how this improves the accuracy of certain markets. Before this, there was little incentive to improve accuracy in very long-run markets. Suppose you knew for sure that the market share of electric vehicles in 2030 would over 20%. It still wouldn’t make sense to bet in this market on that exact question. Each 89 cents you bet on “above 20%” turns into 1 dollar in 2030; but each 89 cents invested in 5-year US bonds (currently paying 4%) would turn into more than $1.08 by 2030, so betting on this market (especially if you bid up the odds to the 99-100% we are assuming is accurate) makes no financial sense. And that’s in the case where we assume you know the outcome for sure; throwing in real-world uncertainty, you would have to think a long-run market like this is extremely mis-priced before it made sense to bet.

But now if you can get the same 4% interest by making the bet, plus the chance to win the bet, contributing your knowledge by betting in this market suddenly makes sense.

This matters not just for long-run markets like the EV example. I think we’ll also see improved accuracy in long-shot odds on medium-run markets. I’ve often noticed early on in election markets, candidates with zero chance (like RFK Jr or Hillary Clinton in 2024) can be bid up to 4 or 5 cents because betting against them will at best pay 4-5% over a year, and you could make a similar payoff more safely with bonds or a high-yield savings account. Page and Clemen documented this bias more formally in a 2012 Economic Journal paper:

We show that the time dimension can play an important role in the calibration of the market price. When traders who have time discounting preferences receive no interest on the funds committed to a prediction-market contract, a cost is induced, with the result that traders with beliefs near the market price abstain from participation in the market. This abstention is more pronounced for the favourite because the higher price of a favourite contract requires a larger money commitment from the trader and hence a larger cost due to the trader’s preference for the present. Under general conditions on the distribution of beliefs on the market, this produces a bias of the price towards 50%, similar to the so-called favourite/longshot bias.

We confirm this prediction using a data set of actual prediction markets prices from 1,787 market representing a total of more than 500,000 transactions.

Hopefully the introduction of interest will correct this, other markets like PredictIt and Polymarket will feel competitive pressure to follow suit, and we’ll all have more accurate forecasts to consult.

Literature Review is a Difficult Intellectual Task

As I was reading through What is Real?, it occurred to me that I’d like a review on an issue. I thought, “Experimental physics is like experimental economics. You can sometimes predict what groups or “markets” will do. However, it’s hard to predict exactly what an individual human will do.” I would like to know who has written a little article on this topic.

I decided to feed the following prompt into several LLMs: “What economist has written about the following issue: Economics is like physics in the sense that predictions about large groups are easier to make than predictions about the smallest, atomic if you will, components of the whole.”

First, ChatGPT (free version) (I think I’m at “GPT-4o mini (July 18, 2024)”):

I get the sense from my experience that ChatGPT often references Keynes. Based on my research, I think that’s because there are a lot of mentions of Keynes books in the model training data. (See “”ChatGPT Hallucinates Nonexistent Citations: Evidence from Economics“) 

Next, I asked ChatGPT, “What is the best article for me to read to learn more?” It gave me 5 items. Item 2 was “Foundations of Economic Analysis” by Paul Samuelson, which likely would be helpful but it’s from 1947. I’d like something more recent to address the rise of empirical and experimental economics.

Item 5 was: “”Physics Envy in Economics” (various authors): You can search for articles or papers on this topic, which often discuss the parallels between economic modeling and physics.” Interestingly, ChatGPT is telling me to Google my question. That’s not bad advice, but I find it funny given the new competition between LLMs and “classic” search engines.

When I pressed it further for a current article, ChatGPT gave me a link to an NBER paper that was not very relevant. I could have tried harder to refine my prompts, but I was not immediately impressed. It seems like ChatGPT had a heavy bias toward starting with famous books and papers as opposed to finding something for me to read that would answer my specific question.

I gave Claude (paid) a try. Claude recommended, “If you’re interested in exploring this idea further, you might want to look into Hayek’s works, particularly “The Use of Knowledge in Society” (1945) and “The Pretense of Knowledge” (1974), his Nobel Prize lecture.” Again, I might have been able to get a better response if I kept refining my prompt, but Claude also seemed to initially respond by tossing out famous old books.

Continue reading

Writing with ChatGPT Buchanan Seminar on YouTube

I was pleased to be a (virtual) guest speaker for Plateau State University in Nigeria. My host was (Emergent Ventures winner) Nnaemeka Emmanuel Nnadi. The talk is up on Youtube with the following timestamp breakdown:

During the first ten minutes of the video, Ashen Ruth Musa gives an overview called “The Bace People: Location, Culture, Tourist Attraction.”

Then I introduce LLMs and my topic.

Minute 19:00 – 29:00 is a presentation of the paper “ChatGPT Hallucinates Nonexistent Citations: Evidence from Economics

Minute 23:30 – 34 is summary of my paper “Do People Trust Humans More Than ChatGPT?

Continue reading

Forecasting Swing States with Economic Data

Ray Fair at Yale runs one of the oldest models to use economic data to predict US election results. It predicts vote shares for President and the US House as a function of real GDP growth during the election year, inflation over the incumbent president’s term, and the number of quarters with rapid real GDP growth (over 3.2%) during the president’s term.

Currently his model predicts a 49.28 Democratic share of the two-party vote for President, and a 47.26 Democratic share for the House. This will change once Q3 GDP results are released on October 30th, probably with a slight bump for the dems since Q3 GDP growth is predicted to be 2.5%, but these should be close to the final prediction. Will it be correct?

Probably not; it has been directionally wrong several times, most recently over-estimating Trump’s vote share by 3.4% in 2020. But is there a better economic model? Perhaps we should consider other economic variables (Nate Silver had a good piece on this back in 2011), or weight these variables differently. Its hard to say given the small sample of US national elections we have to work with and the potential for over-fitting models.

But one obvious improvement to me is to change what we are trying to estimate. Presidential elections in the US aren’t determined by the national vote share, but by the electoral college. Why not model the vote share in swing states instead?

Doing this well would make for a good political science or economics paper. I’m not going to do a full workup just for a blog post, but I will note that the Bureau of Economic Analysis just released the last state GDP numbers that they will prior to the election:

Mostly this strikes me as a good map for Harris, with every swing state except Nevada seeing GDP growth above the national average of 3.0%. Of course, this is just the most recent quarter; older data matters too. Here’s real GDP growth over the past year (not per capita, since that is harder to get, though it likely matters more):

RegionReal GDP Growth Q2 2023 – Q2 2024
US3.0%
Arizona2.6%
Georgia3.5%
Michigan2.0%
Nevada3.4%
North Carolina4.4%
Pennsylvania2.5%
Wisconsin3.3%

Still a better map for Harris, though closer this time, with 4 of 7 swing states showing growth above the national average. I say this assuming as Fair does that the candidate from the incumbent President’s party is the one that will get the credit/blame for economic conditions. But for states I think it is an open question to what extent people assign credit/blame to the incumbent Governor’s party as opposed to the President. Georgia and Nevada currently have Republican governors.

Overall I see this as one more set of indicators that showing an election that is very close, but slightly favoring Harris. Just like prediction markets (Harris currently at a 50% chance on Polymarket, 55% on PredictIt) and forecasts based mainly on polls (Nate Silver at 55%, Split Ticket at 56%, The Economist / Andrew Gelman at 60%). Some of these forecasts also include national economic data:

Gelman suggests that the economy won’t matter much this time:

We found that these economic metrics only seemed to affect voter behaviour when incumbents were running for re-election, suggesting that term-limited presidents do not bequeath their economic legacies to their parties’ heirs apparent. Moreover, the magnitude of this effect has shrunk in recent years because the electorate has become more polarised, meaning that there are fewer “swing voters” whose decisions are influenced by economic conditions.

But while the economy is only one factor, I do think it still matters, and that forecasters have been underrating state economic data, especially given that in two of the last 6 Presidential elections the electoral college winner lost the national popular vote. I look forward to seeing more serious research on this topic.