National Health Expenditure Accounts Historical State Data: Cleaned, Merged, Inflation Adjusted

The government continues to be great at collecting data but not so good at sharing it in easy-to-use ways. That’s why I’ve been on a quest to highlight when independent researchers clean up government datasets and make them easier to use, and to clean up such datasets myself when I see no one else doing it; see previous posts on State Life Expectancy Data and the Behavioral Risk Factor Surveillance System.

Today I want to share an improved version of the National Health Expenditure Accounts Historical State Data.

National Health Expenditure Accounts Historical State Data: The original data from the Centers for Medicare and Medicaid Services on health spending by state and type of provider are actually pretty good as government datasets go: they offer all years (1980-2020) together in a reasonable format (CSV). But it comes in separate files for overall spending, Medicare spending, and Medicaid spending; I merge the variables from all 3 into a single file, transform it from a “wide format” to a “long format” that is easier to analyze in Stata, and in the “enhanced” version I offer inflation-adjusted versions of all spending variables. Excel and Stata versions of these files, together with the code I used to generate them, are here.

A warning to everyone using the data, since it messed me up for a while: in the documentation provided by CMMS, Table 3 provides incorrect codes for most variables. I emailed them about this but who knows when it will get fixed. My version of the data should be correct now, but please let me know if you find otherwise. You can find several other improved datasets, from myself and others, on my data page.

State Tax Revenue is Down a Lot in 2023 (but really just back to normal levels)

State tax revenue is down a lot since last year. The latest comparable data from Census’s QTAX survey is for the 2nd quarter of 2023, and it shows a massive hit: state tax revenue was down 14% from the same quarter in 2022, which is about $66 billion. Almost all of that decline is from income tax revenue, specifically individual income tax revenue which is down over 30% (almost $60 billion). General sales taxes, the other workhorse of state budgets, is essentially flat over the year.

That’s a huge revenue decline! So, what’s going on? In some states, there has been an attempt to blame recent tax cuts. It’s not a bad place to start, since half of US states have reduced income taxes in the past 3 years, mostly reducing top marginal tax rates. But that can’t be the full explanation, since almost every state saw a reduction in revenue: just 3 states had individual income tax revenue increases (Louisiana, Mississippi, and New Hampshire) from 2022q2 to 2023q2, and they were among the half of states that reduced rates!

To get some perspective let’s look at long-run trends. This chart shows total state individual income tax revenue for all 50 states (sorry, DC) going back to 1993. I use a 4-quarter total, since tax receipts are seasonal (and because states sometimes move tax deadlines due to things like disasters, a specific quarter can sometimes look weird). And importantly, this data is not inflation adjusted. Don’t worry, I will do an adjustment further below in this post, but for starters let’s just look at the nominal dollars, because nominal dollars are how states receive money!

Continue reading

Former Treasury Official Defends Decision to Issue Short Term Debt for Pandemic;  I’m Not Buying It

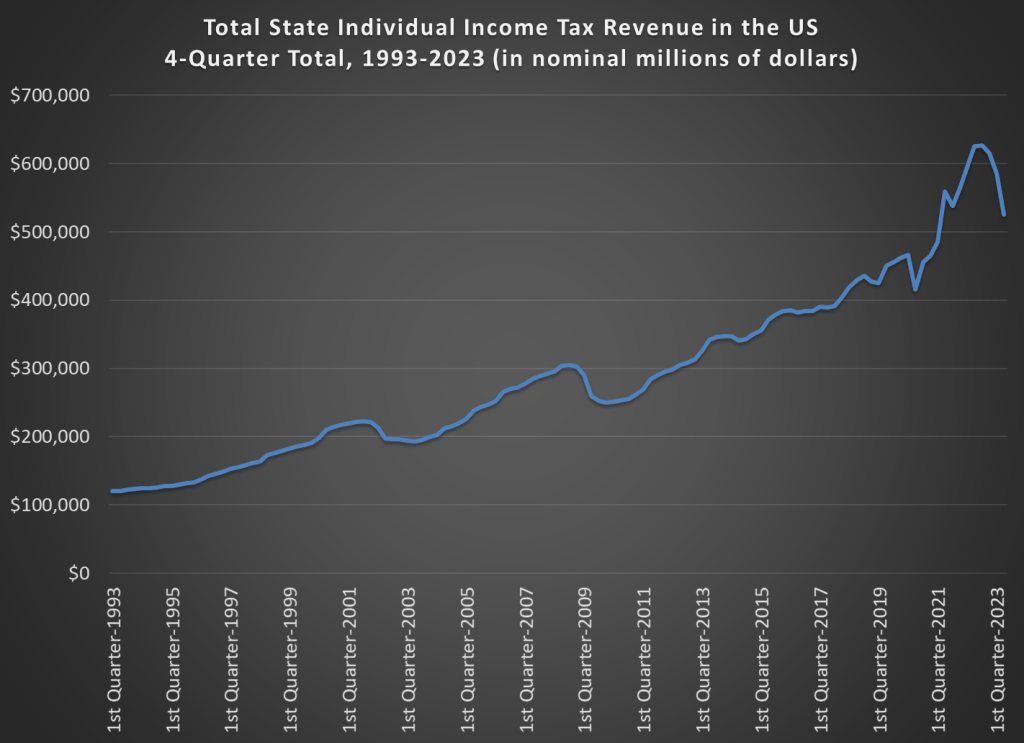
We noted earlier (see “The Biggest Blunder in The History of The Treasury”: Yellen’s Failure to Issue Longer-Term Treasury Debt When Rates Were Low ), along with many other observers, that it seemed like a mistake for the Treasure to have issued lots of short-term (e.g. 1-2 year) bonds to finance the sudden multi-trillion dollar budget deficit from the pandemic-related spending surge in 2020-2021. Rates were near-zero (thanks to the almighty Fed) back then.

Now, driven by that spending surge, inflation has also surged, and thus the Fed has been obliged to raise interest rates. And so now, in addition to the enormous current deficit spending,  that tsunami of short-term debt from 2020-2021 is coming due, to be refinanced at much higher rates. This high interest expense will contribute further to the growing government debt.

Hedge fund manager Stanley Druckenmiller  commented in an interview:

When rates were practically zero, every Tom, Dick and Harry in the U.S. refinanced their mortgage… corporations extended [their debt],” he said. “Unfortunately, we had one entity that did not: the U.S. Treasury….

Janet Yellen, I guess because political myopia or whatever, was issuing 2-years at 15 basis points[0.15%]   when she could have issued 10-years at 70 basis points [0.70 %] or 30-years at 180 basis points [1.80%],” he said. “I literally think if you go back to Alexander Hamilton, it is the biggest blunder in the history of the Treasury. I have no idea why she has not been called out on this. She has no right to still be in that job.

Unsurprisingly, Yellen pushed back on this charge (unconvincingly). More recently, former Treasury official Amar Reganti has issued a more detailed defense. Here are some excerpts of his points:

( 1 ) …The Treasury’s functions are intimately tied to the dollar’s role as a reserve currency. It is simply not possible to have a reserve currency without a massive supply of short-duration fixed income securities that carry no credit risk.

( 2 ) …For the Treasury to transition the bulk of its issuance primarily to the long end of the yield curve would be self-defeating since it would most likely destabilise fixed income markets. Why? The demand for long end duration simply does not amount to trillions of dollars each year. This is a key reason why the Treasury decided not to issue ultralong bonds at the 50-year or 100-year maturities. Simply put, it did not expect deep continued investor demand at these points on the curve.

( 3 ) …The Treasury has well over $23tn of marketable debt. Typically, in a given year, anywhere from 28% to 40% of that debt comes due…so as not to disturb broader market functioning, it would take the Treasury years to noticeably shift its weighted average maturity even longer.

( 4 ) …The Treasury does not face rollover risk like private sector issuers.

Here is my reaction:

What Reganti says would be generally valid if the trillions of excess T-bond issuance in 2020-2021 were sold into the general public credit market. In that case, yes, it would have been bad to overwhelm the market with more long-term bonds than were desired.  But that is simply not what happened. It was the Fed that vacuumed up nearly all those Treasuries, not the markets. The markets were desperate for cash, and hence the Fed was madly buying any and every kind of fixed income security, public and corporate and mortgage (even junk bonds that probably violated the Fed’s bylaws), and exchanging them mainly for cash.  Sure, the markets wanted some short-term Treasuries as liquid, safe collateral, but again, most of what the Treasury issued ended up housed in the Fed’s digital vaults.

So, I remain unconvinced that the issuance of mainly long-term (say 10-year and some 30-year; no need to muddy the waters like Reganti did with harping on 50–100-year bonds) debt would have been a problem. So much fixed-income debt was vomited forth from the Treasury that even making a minor portion of it short-term would, I believe, have satisfied market needs. The Fed could have concentrated on buying and holding the longer-term bonds, and rolling them over eventually as needed, without disturbing the markets. That would have bought the country a decade or so of respite before the real interest rate effects of the pandemic debt issuance began to bite.

But nobody asked my opinion at the time.

The Greatest NBA Coach Is… Dan Issel?

Some economists love to write about sports because they love sports. Others love to write about sports because the data are so good compared to most other facets of the economy. What other industry constantly releases film of workers doing their jobs, and compiles and shares exhaustive statistics about worker performance?

This lets us fill the pages of the Journal of Sports Economics with articles on players’ performance and pay, and articles evaluating strategies that sometimes influence how sports are played in turn. But coaches always struck me as harder to evaluate than players or strategies. With players, the eye test often succeeds.

To take an extreme example, suppose an average high-school athlete got thrown into a professional football or basketball game; a fan asked to evaluate them could probably figure out that they don’t belong there within minutes, or perhaps even just by glancing at them and seeing they are severely undersized. But what if an average high school coach were called up to coach at the professional level? How long would it take for a casual observer to realize they don’t belong? You might be able to observe them mismanaging games within a few weeks, but people criticize professional coaches for this all the time too; I think you couldn’t be sure until you see their record after a season or two. Even then it is much less certain than for a player- was their bad record due to their coaching, or were they just handed a bad roster to work with?

The sports economics literature seems to confirm my intuition that coaches are difficult to evaluate. This is especially true in football, where teams generally play fewer than 20 games in a season; a general rule of thumb in statistics is that you need at least 20 to 25 observations for statistical tests to start to work. This accords with general practice in the NFL, where it is considered poor form to fire a coach without giving him at least one full season. One recent article evaluating NFL coaches only tries to evaluate those with at least 3 seasons. If the article is to be believed, it wasn’t until 2020 that anyone published a statistical evaluation of NFL defensive coordinators, despite this being considered a vital position that is often paid over a million dollars a year:

Continue reading

Where Can You Still Buy an Affordable Home in the US?

A few months ago I looked at the richest and poorest MSAs in the US, including adjusting for the cost of living in each MSA. One big thing I found was that the list doesn’t change that much when you adjust for the cost of living: San Jose, San Francisco, Bridgeport (CT), Boston, and Seattle are still the highest income MSAs even after accounting for the fact that they are also high-cost-of-living places to live. The gap shrinks, but they are still in the lead.

But that was adjusting for all the factors in the cost of living. But what if we just looked at one important aspect of the cost of living: housing. And since the cost-of-living adjustments (BEA’s RPP) that I was using are from 2021, what if we tried to bring the data up as close to the present as possible? We know that housing prices have increased a lot since 2021, but also that the cost of borrowing has risen dramatically too. What would this show us about the cost of living for different MSAs?

A tool from the Harvard Joint Center for Housing Studies allows us to make some pretty up-to-date comparisons. Their interactive map shows data for the 179 largest MSAs (about half of the total MSAs in the US) on the median price of each home for the second quarter of 2023 and uses interest rates from that quarter to show the rough principal and interest cost (assuming a 3.5% down payment). Taxes and insurance costs for each MSA are also estimated.

Based on those assumptions, their tool provides the minimum income you would need to purchase a home in that area, assuming a 31% debt-to-income ratio for the mortgage. And the income levels needed vary quite widely across MSAs, from a low of $44,000 in Cumberland, Maryland, to a high of over $500,000 in San Jose, CA. That’s a huge difference.

Of course, we know that incomes also vary across MSAs. But they don’t vary that much. The JCHS tool doesn’t provide this data (though a JCHS map from 2017 did compare house prices to incomes), but we can look up median family income for each MSA from Census. Doing so we see that San Jose is indeed unaffordable based on the current (2022) median income, which is “only” about $170,000. A nice income compared to the national median, but only about 1/3 of the $500,000 you would need to afford a home in San Jose. Cumberland looks much better though: median family income is over $77,000 there, about 76% more than you would need to buy a home!

What if we did a similar calculation for all MSAs in the JCHS data? The following map is my attempt to do so. Sorry, but my graphics skills are not the best, so this map isn’t as pretty as it could be (I started with the JCHS map, and just shaded in the colors I wanted to use). But I think it conveys the general idea.

Green-shaded MSAs are the most affordable: places like Cumberland, Maryland, where median family income is well above (at least 20% above, my arbitrary threshold) the amount JCHS says you need to buy a home. There are 27 Green-shaded MSAs. Blue-shaded MSAs are affordable too, and median income is between 100% and 120% of the amount needed to afford a home on the JCHS standard. There are 41 of these, making 68 total MSAs out of these 179 that are affordable. Red-shaded MSAs are less than 100%, and thus unaffordable (though as I will discuss below, some are much closer to affordable than others).

Continue reading

OpenAI, IZA, and The Limits of Formal Power

Companies and non-profit organizations tend to be managed day-to-day by a CEO, but are officially run by a board with the legal power to replace the CEO and make all manner of changes to the company. But last week saw two striking demonstrations that corporate boards’ actual power can be much weaker than it is on paper.

The big headlines, as well as our coverage, focused on the bizarre episode where OpenAI, the one of the hottest companies (technically, non-profits) of the year, fired their CEO Sam Altman. They said it was because he was not “consistently candid with the board”, but refused to elaborate on what they meant by this; they said a few things it was not but still not what really motivated them.

Technically it is their call and they don’t have to convince anyone else, but in practice their workers and other partners can all walk away if they dislike the board’s decisions enough, leaving the board in charge of an empty shell. This was starting to happen, with the vast majority of workers threatening to walk out if the board didn’t reverse their decision, and their partner Microsoft ready to poach Sam Altman and anyone else who left.

After burning through two interim CEOs who lasted two days each, the board brought back ousted CEO Sam Altman. Formally, the big change was board member Ilya Sutskever switching sides, but the blowback was enough to get several board members to resign and agree to being replaced by new members more favored by the workers (including, oddly, economist Larry Summers).

A similar story played out at IZA last week, though it mostly went under the radar outside of economics circles. IZA (aka the Institute for Labor Economics) is a German non-profit that runs the world’s largest organization of labor economists. While they have a few dozen direct employees, what makes them stand out is their network of affiliated researchers around the world, which I had hoped to join someday:

Our global research network ist the largest in labor economics. It consists of more than 2,000 experienced Research Fellows und young Research Affiliates from more than 450 research institutions in the field.

But as with OpenAI, the IZA board decided to get rid of their well-liked CEO. Here at least some of their reasons were clear: they lost their major funding source and so decided to merge IZA with another German research institute, briq. Their big misstep was choosing for the combined entity to be run by the the much-disliked head of the smaller, newer merger partner briq (Armin Falk), instead of the well-liked head of the larger partner IZA (Simon Jaeger). Like with OpenAI, hundreds of members of the organization (though in this case external affiliates not employees, and not a majority) threatened to quit if the board went through with their decision. Like with OpenAI, this informal power won out as Armin Falk backed off of his plan to become IZA CEO.

Each story has many important details I won’t go into, and many potential lessons. But I see three common lessons between them. First is the limits to formal power; the board rules the company, but a company is nothing without its people, and they can leave if they dislike the board enough. Second, and following directly from this, is that having a good board is important. Finally, workers can organize very rapidly in the internet age. At OpenAI nearly all its employees signed onto the resignation threat within two days, because the organizers could simply email everyone a Google Doc with the letter. Organizers of the IZA letter were able to get hundreds of affiliates to sign on the same way despite the affiliates being scattered all across the world. In both cases there was no formal union threatening a strike; it was the simple but powerful use of informal power: the voice and threatened exit of the people, organized and amplified through the internet.

Are You Better Off Than You Were Four Years Ago?

In the October 1980 Presidential debate, Ronald Reagan famously asked that question to the American voters. His next sentence made it clear he was talking about the relationship between prices and wages, or what economists call real wages: “is it easier for you to go and buy things in the stores than it was four years ago?”

Reagan was a master of political rhetoric, so it’s not surprising that many have tried to copy his question in the years since 1980. For example, Romney and Ryan tried to use this phrase in their 2012 campaign against Obama. But it’s a good question to ask! While the President may have less control over the economy than some observers think, the economy does seem to be a key factor in how voters decide (for example, Ray Fair has done a pretty good job of predicting election outcomes with a few major economic variables).

Voters in 2024 will probably be asking themselves a similar question, and both parties (at least for now) seem to be actively encouraging voters to make such a comparison. We still have 12 months of economic data to see before we can really ask the “4 years” question, but how would we answer that question right now? Here’s probably the best approach to see if people are “better off” in terms of being able to “go and buy things at the stores”: inflation-adjusted wages. This chart presents average wages for nonsupervisory workers, with two different inflation adjustments, showing the change over a 4-year time period.

Continue reading

Growth of the Transfer State

I’ve written about government spending before. But not all spending is the same. Building a bridge, buying a stapler, and taking from Peter to pay Paul are all different types of spending. I want to illustrate that last category. Anytime that the government gives money to someone without purchasing a good or service or making an interest payment, it’s called a ‘transfer’. People get excited about transfers. Social security is a transfer and so is unemployment insurance benefits. Those nice covid checks? Also transfers.

Here I’ll focus on Federal transfers, though the data on all transfers is very similar if you include states in the analysis. Let’s start with the raw numbers. Below is data on GDP, Federal spending, and federal transfers. Suffice it to say that they are bigger than they used to be. They’ve all been growing geometrically and they all exhibit bumps near recessions.

Continue reading

Let’s Be Thankful for Food Abundance

Despite recent increases in prices of food, we should still all be very thankful this Thanksgiving for the abundance of affordable food available in the modern world. Looking back at my past few blog posts, I notice that I have been very food-centric in my choice of topics! And last week I also showed how the Thanksgiving meal this year will be the second cheapest ever (only behind 2019). While it’s absolutely true that food prices are up a lot in the past 2 and 4 years, they probably aren’t up as much as you have heard.

It’s always my preference to take as long-term perspective as possible when thinking about economic progress. So here’s the best way I’ve come up with to show how cheap and abundant food is today: food as a share of household spending fell dramatically in the 20th century.

Most of the data in this chart comes from the BLS Consumer Expenditure Surveys. This survey was done occasionally since 1901, and then annually since 1984. I also use BEA data to estimate personal taxes paid as a percent of spending (the CEX Surveys have some tax data, but it’s not reliable nor consistent). I picked as close to 30-year intervals as I could (with a preference for showing the earliest and latest years available), and I chose spending categories that are 90-100% of total expenditures in most of these years. Keep in mind also that these are consumer expenditures. As a nation, we spend a lot more on healthcare and education than this chart suggests, but most of that spending is not directly from households (of course, it is indirectly). Think of this chart as an average household budget.

I hope the thing that jumps out at you is that the amount money households spend on food has fallen dramatically since 1901, from over 42 percent to under 13 percent of household expenditures. To be clear, this data includes both spending on food at home and at restaurants (after 1984 we can track them separately, and groceries are pretty consistently about 60 percent of food spending). And you may be wondering about very recent trends too, such as before the pandemic. In 2022, household spent slightly less on food than they did in 2019, falling from 13.5 to 12.8%.

You may also notice that taxes have increased, though not much since 1960. Housing cost have been consistently high, and also a bit higher than 1990, going from 27 percent to 33 percent in 2022. And housing is now the single largest budget expenditure category, but for most of the first half of the 20th century, it was food that was the largest. And since people aren’t changing their housing situation more than once a year (if that), it would also have been food that dominated weekly and monthly budget decisions and worry about price fluctuations.

This year there will be lots of complaining about prices around the Thanksgiving table. And much of that is warranted! But let’s also be thankful on this food-intensive holiday for how cheap the food is.

And if some smart-aleck youngster tries to tell you that they learned on TikTok that things were better during the Great Depression (yes, people are really saying this!), have them watch this video by Christopher Clarke. Or show them that in the mid-1930s an average family spent one-third of their budget on food in my chart above, or how much labor it would have taken to buy that turkey in the 1930s (about 40 times as much time spent working as today).

Malinvestment Produces Knowledge

Austrian economists rightfully have some gripes about mainstream macroeconomics – specifically about aggregation. The conventional wisdom says that a fall in output can be prevented or remedied in the short-run by an expansion of total spending (via increasing the money supply). Total output is stabilized and the crisis is averted. Even if rising spending preceded the output decline, the standard prescription is the same.

The Austrian Business Cycle theory says that, actually, the prior expansion in spending resulted in yet-to-be-realized poor investments due to easy credit. The decline in output is self-inflicted by unsustainable endeavors, and the money supply expansion response prevents the correction. The consequence is more malinvestment. The Austrians say that the focus on gross investment is a misleading aggregation and commits the fallacy of composition that all investment is the same or the same on relevant margins.

Both schools of thought are on firm ground. I don’t see them as conflicting. They both make valid points and are correct about the world. The conventional wisdom is able to paper-over short-run hiccups, and the Austrians recognize that resources are suboptimally allocated. The two sides are talking past each other to some extent.

The market process of seeking profits and satisfying consumer demands is a messy process. Prices and profits (and losses) incentivize firms with information that they use to adjust their behavior. They innovate and reallocate resources from bad projects and toward money-making projects. When firms earn negative profits (a loss) they learn that their understanding of the world was wrong and that they malinvested their scarce resources. Therefore, malinvestment is a standard and *necessary* part of the market process of identifying and serving the changing and unknown demands of individuals. Without malinvestment we lack the necessary information to distinguish success from failure.

Mal-investment is harmful insofar as it represents resources that were invested such that future output did not rise as it could have otherwise. So, while malinvestment is necessary to the market process, a preponderance of it makes us poorer in the future. Luckily, firms have incentives and finite resources such that mal-investment remains somewhat tamed. Indeed, malinvestment is the cost that we bear for innovation and identifying what works.

The issue is that the above discussion is oriented to the long-run. The conventional wisdom is oriented toward resolving the short-run threats. The two meet one another when malinvestment realizations occur in a correlated manner. It’s not that policy causes malinvestment. Rather, depressed interest rates and easy credit prevent firms from identifying which of their projects turned out to be more or less productive. Firms persist in bad investments because they can’t discriminate between the failed and successful projects ex ante.

So, when interest rates suddenly rise, low or negative productivity projects are identified and resources are reallocated. The discovery and reallocation process takes time. And if many projects are found to be failures at once, then the result is a drop in economic activity that is detectable at the aggregate level. The problem is not that malinvestment exists. The problem is that malinvestment was permitted to persist and grow such that the eventual realization of losses is correlated and has macroeconomic effects. We observe spending, output, and employment declines. That’s the ‘business cycle’ part of the Austrian Business Cycle. Interest rates rising helps to identify the bad projects. That’s good. But policy that increases the popularity of bad projects is bad. It makes us poorer in the long-run and more vulnerable to declines in the short-run.