Do you have a robot vacuum? The first model was introduced in 2002 for $199. I don’t know how good that first model was, but I remember seeing plenty of ads for them by 2010 or so. My family was the cost-cutting kind of family that didn’t buy such things. I wondered how well they actually performed ‘in real life’. Given that they were on the shelves for $400-$1,200 dollars, I had the impression that there was a lot of quality difference among them. I didn’t need one, given that I rented or had a small floor area to clean, and I sure didn’t want to spend money on one that didn’t actually clean the floors. I lacked domain-specific knowledge. So I didn’t bother with them.
Fast forward to 2024: I’ve got four kids, a larger floor area, and less time. My wife and I agreed early in our marriage that we would be a ‘no shoes in the house’ kind of family. That said, we have different views when it comes to floor cleanliness. Mine is: if the floors are dirty, then let’s wait until the source of crumbs is gone, and then clean them when they will remain clean. In practice, this means sweeping or vacuuming after the kids go to bed, and then steam mopping (we have tile) after parties (not before). My wife, in contrast, feels the crumbs on her feet now and wants it to stop ASAP. Not to mention that it makes her stressed about non-floor clutter or chaos too.
I’ve often heard that before modern water treatment, it was safer to drink beer; but I’ve also heard people call this a historical myth. A new paper in the Journal of Development Economics by Francisca Antman and James Flynn comes down strongly on the side of “beer really was safer”:
This paper provides the first quantitative estimates into another well-known water alternative during the Industrial Revolution in England.
Although beer in the present day is regarded as being worse for health than water, several features of both beer and water available during this historical period suggest the opposite was likely to be true. First, brewing beer requires boiling the water, which kills many dangerous pathogens often found in drinking water. As Bamforth (2004) puts it, “the boiling and the hopping were inadvertently water purification techniques”. Second, alcohol itself has antiseptic qualities. Homan (2004) notes that “because the alcohol killed many detrimental microorganisms, it was safer to drink than water” in the ancient near-east.
They use several identification strategies to establish this, for instance when a tax on malt was increased and mortality went up:
But did this mean people were drunk all the time? Probably not:
beer in this period was generally much weaker than it is today, and thus would have been closer to purified water. Accum (1820) found that common beers in late 18th and early 19th century England averaged just 0.75% alcohol by volume, a fraction of the content of the beers of today. Beer in this period was therefore far less harmful to the liver. Taken together, these facts suggest that beer had many of the benefits of purified water with fewer of the health risks associated with beer consumption today.
In fact, people at the time didn’t necessarily know that beer was healthier:
Thus, even though people did not recognize beer as a safer choice, drinking beer would have been an unintentional improvement over water, and thus may have contributed to improvements in human health and economic development over the period we investigate
Though as usual, Adam Smith was ahead of his time. Here’s what he had to say in his 1776 Wealth of Nations, in a chapter on malt taxes:
Spirituous liquors might remain as dear as ever, while at the same time the wholesome and invigorating liquors of beer and ale might be considerably reduced in their price.
In my Inbox I read the following sentence, summarizing an article on child health in Arkansas: “The latest Annie E. Casey Foundation KIDS COUNT Data Book shows 2022 was the deadliest year on record for child deaths in Arkansas.”
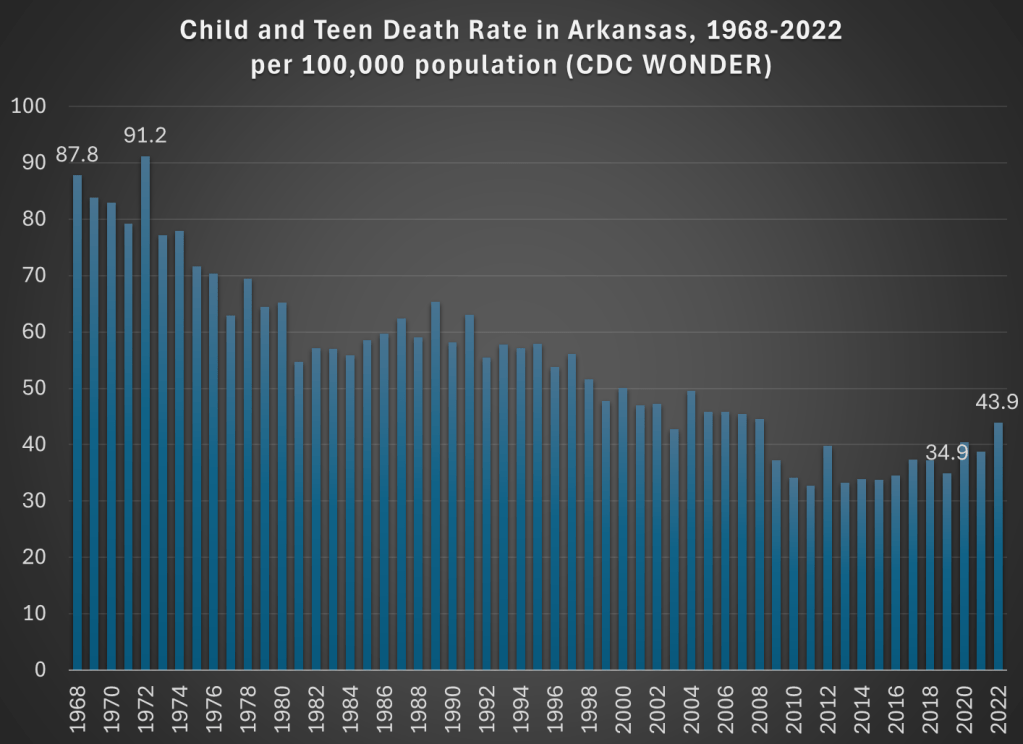
Deadliest on record! That certainly grabbed my attention. I clicked the link and read the article. Indeed, they emphasize three times that 2022 was the “deadliest year” for kids in Arkansas, including with a chart! And the chart does seem to support the claim: in 2022 there were 44 child and teen deaths per 100,000 in Arkansas, higher than any year on the chart.
But wait a minute, this chart only goes back to 2010. Surely the record goes back further than that? Indeed it does. It took me three minutes (yes, I timed myself, and you have to use 4 different databases) to complete the necessary queries from CDC WONDER to extract the data to replicate their 2010-2022 chart, and to extend the data back a lot further: all the way to 1968 (though in 30 seconds I could have extended it back to 1999).
And what do we find in 1968? The death rate for children and teens in Arkansas was twice as high as it was in 2022. Not just a little higher, but double. With some more digging, I might be able to go back further than 1968, but from the easily accessible CDC data, that’s as far back as “the record” goes. Of course, I knew where to look, but I would hope that a group producing a data book on child health also knows where to look. And you don’t need to extend this very far past the arbitrary 2010 cutoff in the article quoted: 2008 and every year before it was more deadly than 2022 for children in Arkansas. Here’s a chart showing the good long-run trend:
Now there is a notable flattening of the long-run trend in the past 15 years or so, and a big reversal since 2019. What could be causing this? The article I read doesn’t get specific, but here’s what they say: “The state data isn’t broken out into cause of death, but firearm-related deaths have become the leading cause of death among U.S. teens in recent years. Deaths from accidents such as car crashes account for most child deaths.”
But using CDC WONDER, we can easily check on what is causing the increase since 2019. “Firearm-related deaths” is an interesting phrase, since it lumps together three very different kinds of deaths: homicides, suicides, and accidents. And while it is true that “deaths from accidents” are the leading category of deaths for children, this also lumps together many different kinds of deaths: not only car crashes, but also poisonings, drownings, or accidental firearm deaths.
For Arkansas in 2022, here are the leading categories of deaths for children and teens (ages 1-19) if we break down the categories a bit:
Homicides: 66
Non-transport accidents: 58 (largest subcategories: poisonings/ODs and drowning)
Transport accidents: 52 (almost all car crashes)
Suicides: 24
Birth defects: 16
Cancers: 14
Cardiovascular diseases: 13
And no other categories are reported, because CDC WONDER won’t show you anything smaller than 10 deaths.
We might also ask what caused the increase since 2019, especially since this a report on child health and possible solutions. The death rate increased by 9 deaths per 100,000, and over 80% of the increase is accounted for by just two categories: homicides and non-transport accidents. Car crashes actually fell slightly (though the rate increased a bit, since the denominator was also smaller). Deaths from suicides, cancer, and heart diseases also declined from 2019 to 2022 among children in Arkansas, and these are the three on the list above that we would probably consider the “health” categories. Things actually got better!
But the really big increase, and very bad social trend, is the category of homicides. Among children and teens in Arkansas, it rose from 35 deaths in 2019 to 66 deaths in 2022. It almost doubled. That’s bad! But homicides are not mentioned anywhere in the article on this topic that I read (“firearm-related deaths” is the closest they get). And while car accidents are definitely a major problem, they didn’t really increase from 2019 to 2022 (among kids in Arkansas).
One more thing we can do with CDC WONDER is break down the homicides by age. The numbers so far are looking at a very broad range of children and teens, from ages 1-19. As I’ve written about before, the is a huge difference between homicide rates for older teens versus all of the kids. Indeed for Arkansas we see the same pattern, such as when I run a CDC WONDER query for single-years of age: only the ages 17, 18, and 19 show up (remember, anything less than 10 deaths won’t register in the query).
Breaking it down by five-year age groups, we see that 53 of the 66 homicides (in Arkansas among kids and teens) were for ages 15-19, that is 80% of the total. And further if we run the query by race, we see that 40 of the 66 homicides were for African Americans age 15-19. This is clearly a social problem, but it’s an extremely concentrated social problem. And the increase for older teen Blacks has been large too: it was just 17 deaths in 2019, more than doubling to 40 homicides in 2022.
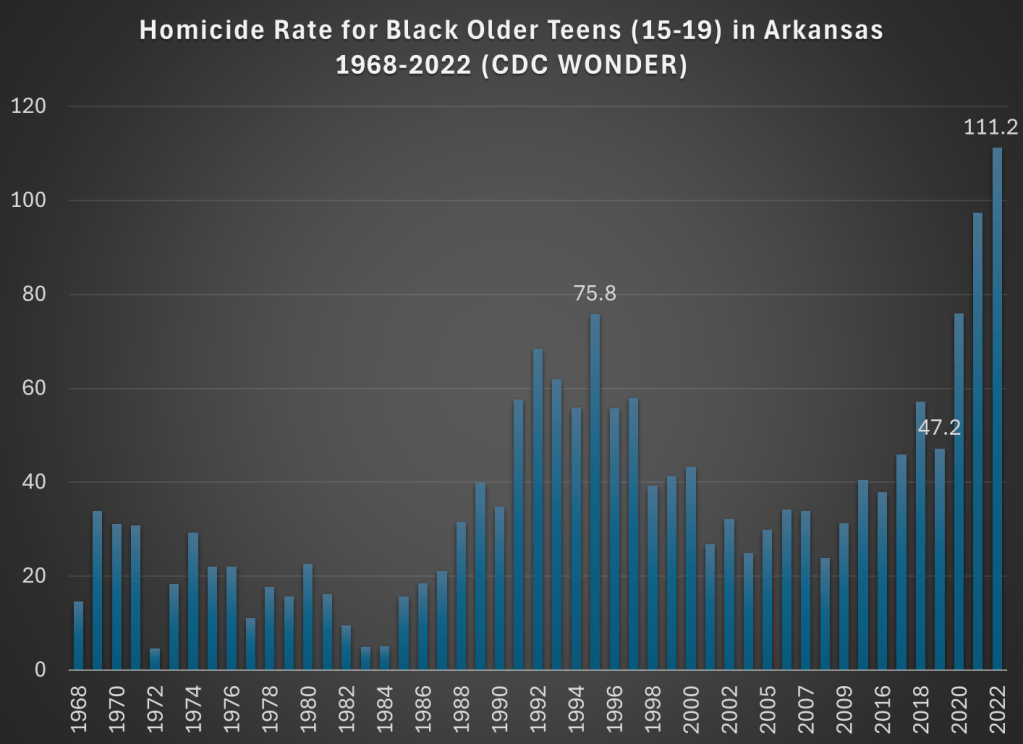
Now, small numbers can jump around a bit, so just looking at 2019 and 2022 might be deceptive. What if we had a longer annual series to look at? Again, CDC WONDER allows us to do this. Here is the chart for homicides among older Black teens in Arkansas:
This is a dramatic chart. The steady rise in homicides among this demographic since 2019 is staggering. Not only the dramatic increase, but notice that 2021 and 2022 are much worse than the crime wave of the early 1990s, which also jump out in this chart. The homicide rate for older Black teens in 2022 was almost 50 percent higher than 1995, the prior worst year on record.
So is there a problem with child and teen deaths in Arkansas? Yes! But with just a few minutes of searching on CDC WONDER, I think we can get a much better picture of what is causing it than the article I read summarizing the report. Indeed, if we read the full national report, the word “homicide” is only mentioned once in a laundry list of many causes of death.
The most important part of addressing a social problem, such as “deadliest year on record for child deaths in Arkansas” is to know some basic details about what is causing a bad social indicator to worsen. Hopefully after reading this blog post you know a little bit more. If you want to read my summary of the research on how to reduce deaths from firearms, see this June 2022 post.
I’m in the process of writing a review of Jon Haidt’s book The Anxious Generation. I wrote some preliminary thoughts a few weeks ago, but I’m diving a lot deeper now, so watch for that review soon. But one of the main startling pieces of data in the book is the dramatic rise in suicides among young girls. Haidt isn’t the first to point this out, but in large part his book is an attempt to explain this rise (as well as the rise among boys and slightly older girls).
This got me thinking a bit more broadly about not just suicides, but all causes of mortality among young Americans. So in the style of my 2022 post about the leading causes of death among men ages 18-39, let’s look at the historical trends for deaths among girls 10-14 in the US.
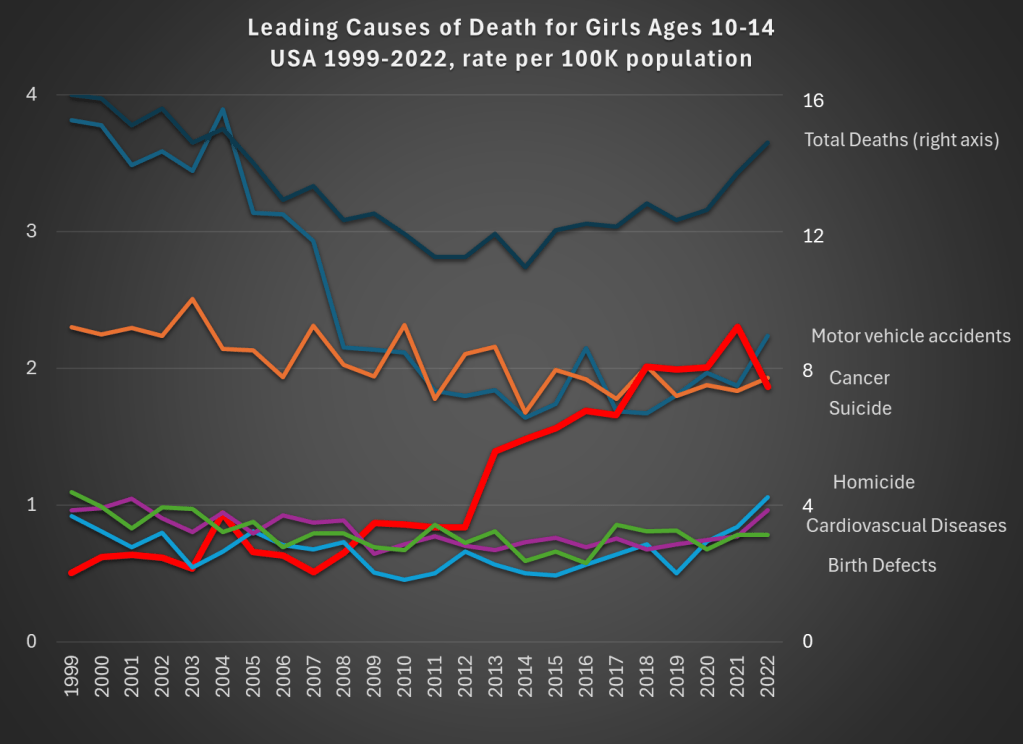
Data comes from CDC WONDER. The top dark line shows total deaths, and the scale for total deaths is the right-axis. Notice that for total deaths, there is a U-shaped pattern. From 1999 to about 2012, deaths for girls aged 10-14 are falling. Then, the bottom out and start to rise again. While the end point in 2022 is lower than 1999 (by about 9 percent), there is a 22 percent increase from 2010 to 2022.
What’s driving those trends? A fall in motor vehicle accidents (blue line, the leading cause of death in both 1999 and 2022) is driving the decline. This category fell 41 percent over the entire time period: a big drop for the leading cause of death!
But the rise in suicides (thick red line) starting in 2013 is the clear driver of the reversal of the overall trend. Suicides for this demographic in 2022 were 268 percent higher than 1999, and 116 percent higher than 2010. Haidt and others are right to investigate the causes of this trend (I’m not convinced they have the complete answer, but more on that in my forthcoming book review).
There has been no clear trend in cancer deaths over this time period, and the combination of all the three of these trends means that roughly equal number of girls ages 10-14 die from car accidents, suicide, and cancer.
What can we learn from this data? First, we should acknowledge just how rare death is for girls ages 10-14. At 14.8 deaths per 100,000 population, it is the lowest 5-year age-gender cohort, other than the ages just below it (ages 5-9, for both boys and girls). But just because it is small doesn’t mean we should ignore it. The big increase, especially in suicides, in the past decade is worrying and could be indicative of broader worrying social trends (and suicides have risen for almost every age group too, see my linked post above).
If a concern, though, is that we are over-protecting our kids and this is leading them to retreat into a world of social media, we might want to see if there are any benefits of this overprotection in addition to the costs. The decline in motor vehicle accidents is one candidate. Is this decline just a result of the overall increase in car safety? Or is there something specific going on that is leading to fewer deaths among young teens and pre-teens?
As we know from other data, a lot fewer young people are getting driver’s licenses these days, especially compared to 1999 (and engaging in fewer risky behaviors across the board). Of course, 10-14 year-olds themselves usually weren’t the ones getting licenses — they are too young in most states — but their 15 and 16 year-old siblings might be the ones driving them around. Is fewer teens driving around their pre-teen siblings a cause of the decline in motor vehicle deaths? We can’t tell from this data, but it is worth investigating further (note: best I can tell, only about 23 percent of the decline is from fewer pedestrian deaths, though in the long-run this is a bigger factor).
Social tradeoffs are hard. If there really is a tradeoff between fewer car accident deaths and more suicides, how should we think about that tradeoff? Or is the tradeoff illusory, and we could actually have fewer deaths of both kinds? I don’t think I know the answer, but I do think that many others are being way too confident that they have the answer based on what data we have so far.
One final note on suicides. For all suicides in the US, the most common method is suicide by firearm: about 55% of suicides in the US were committed with guns in 2022, with suffocations a distant second at about 25%. For girls ages 10-14, this is not the case, with suffocation being by far the leading method: 62% versus just 17% with firearms. I only mention this because some might think the increasing availability of firearms is the reason for the rise in suicides. It could be true overall, but it’s not the case for young girls.
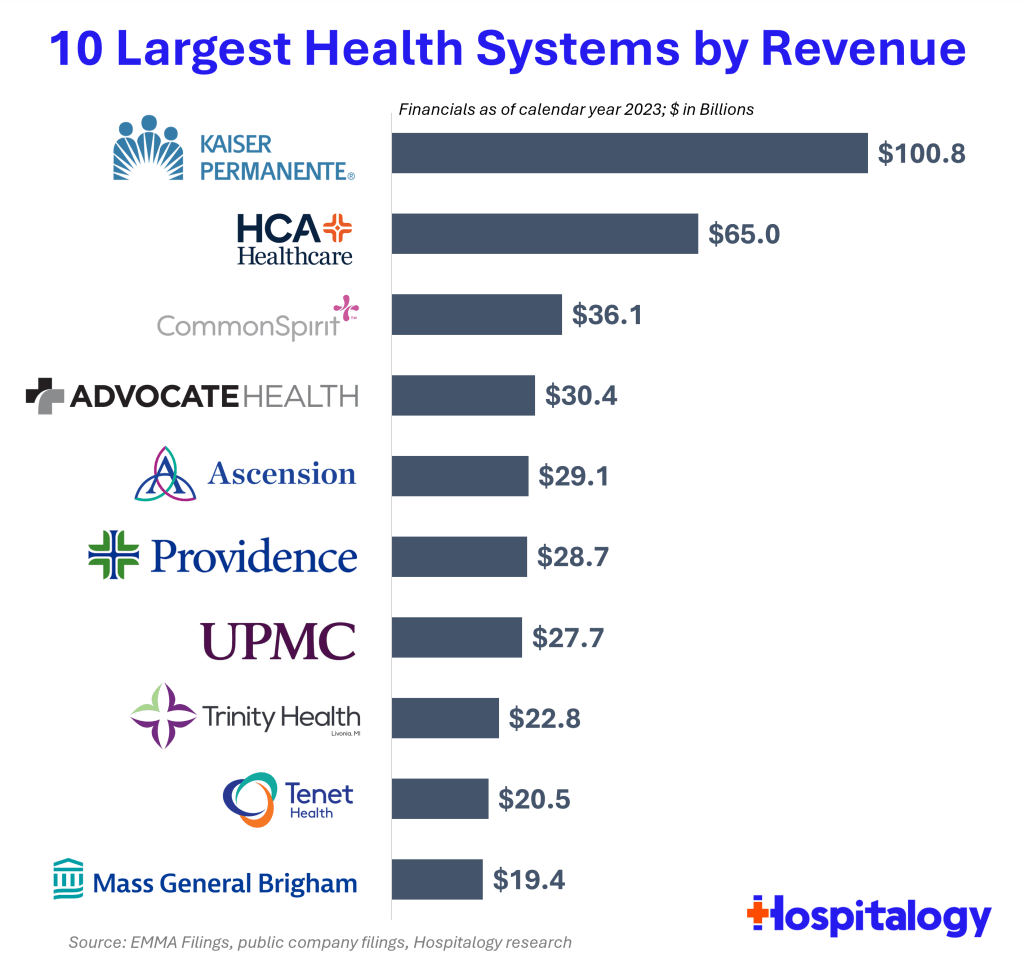
Health spending keeps rising, and hospitals keep consolidating, so the largest health systems in the US keep growing bigger. But getting exact data on how big is surprisingly difficult. So I appreciate that someone else did the work, in this case Blake Madden of Hospitalogy. Here are his top 10:
See his post for the full list of the largest 113 health systems, and details and caveats on the methodology. I have found that Hospitalogy generally has good coverage of the business of health care, and that following Blake on Twitter is a good way to keep up with it.
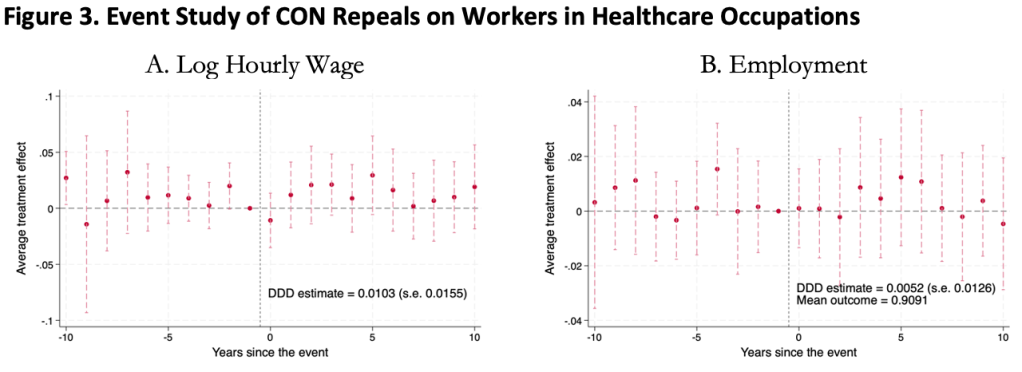
This was surprising to me, as I kind of expected CON laws to harm workers. Certificate of Need laws require many types of health care providers to obtain the permission of a state board before they are allowed to open or expand. This could lead to fewer health care facilities, and so less demand for health care workers, lowering wages and employment. It could also lead to less competition among health care employers, to similar effect.
On the other hand, less competition in the market for health services could raise profits, with room to share them in the form of higher wages. Or, CON being primarily targeted at capital expenditures like facilities and equipment could increase the demand for labor (to the extent that labor and capital are substitutes in health care). All these competing theories seem to cancel out to one big null when we look at the data.
We use 1979-2019 data from the Current Population Survey and a generalized triple-difference approach comparing CON-repealing to CON-maintaining states, and find a bunch of fairly precise zeroes. This holds for many different definitions of “health care worker”: those who work in the health industry, in health occupations, in hospitals, in health care outside hospitals, nurses, physicians, and more.
This is the first word on the topic, not the last; I wouldn’t be too surprised if someone down the road finds that CON does significantly affect health care workers. In this paper we pushed hard on the definition of “health care workers”, but not on “Certificate of Need” or “wages”. We simply classify states as “CON” or “non-CON” because that is what we have data for, but some states have much stricter programs than others, and some day someone will compile the data on this back to the 1970’s. The easier thread to pull on is “wages”. We use one good measure (the natural log of inflation-adjusted hourly real wages), but don’t do any robustness checks around it; considering “business income” could be especially important here. It is also possible that CON affects workers in other ways; we only checked wages and employment.
The full paper is here (ungated here) if you want to read more.
It seems like we finally have anti-obesity drugs that are effective and come without deal-breaking side effects: GLP-1 inhibitors like semaglutide (Wegovy). But they are currently priced over $10,000 per year for Americans. Should insurance cover them?
So far Medicare has decided to cover these drugs only to the extent that they treat diseases like diabetes (which these drugs were originally developed to treat) and heart disease (Wegovy reduces adverse cardiac events by 20% in overweight patients with heart disease). Just based on the diabetes coverage, Medicare was already spending $5 billion per year on these drugs in 2022, making semaglutide the 6th most expensive drug for Medicare with prescriptions still growing rapidly. The addition of other indications for specific diseases, like heart disease coverage added last month, is sure to expand this dramatically, especially if trials confirm other benefits.
But with almost 3/4 of Americans now officially overweight, weight loss makes for a bigger potential market than any specific disease. Medicare currently spends about 15k per beneficiary for all medical care; if they actually paid for an 11k/yr drug for 3/4 of their beneficiaries, their spending could rise to 23k per beneficiary per year. The effect on Medicare Part D, which covers prescription drugs and currently spends about 2.5k per beneficiary per year, would be even more dramatic, with spending quadrupling. This would blow a huge hole in the federal budget, where health insurance already accounts for about 1/4 of all spending (and Medicare 1/2 of that 1/4).
Of course, the reality would not be nearly that bad. Not all overweight people would want to take a weight loss drug, even if it were covered by insurance; the side effects are real. To the extent people do take the drugs, the reduction in obesity could lead to lower spending on treatments for things like heart attacks. Rebates can already reduce the cost of these drugs to be less than half of their list price, and Medicare may be able to negotiate even lower prices starting in 2027. Key patents will expire by 2033, after which generic competition should dramatically lower prices. Competition from other brand-name GLP-1 drugs could lower prices much sooner.
Patents always come with a tradeoff: they encourage innovation in the future, but mean high prices and under-use of patented goods today. The government does have one option for how to lower the marginal price of a drug without discouraging future innovation: just buy out the patent. This would likely cost hundreds of billions of dollars up front, but this could be recouped over time through lower spending, while bringing large health benefits because the drug would be much more widely used if it were sold at a price near its marginal cost of production.
Of course, for now supply of these medications is the bigger problem than the cost. Even with the current high prices and insurers tending not to cover drugs of weight loss alone, demand exceeds supply and shortages abound. The manufacturers are trying to ramp up production quickly to meet the large and growing demand, but this takes time. Insurers like Medicare covering weight loss drugs wouldn’t actually mean more people get the drugs in the short run, it would simply change who gets to use them.
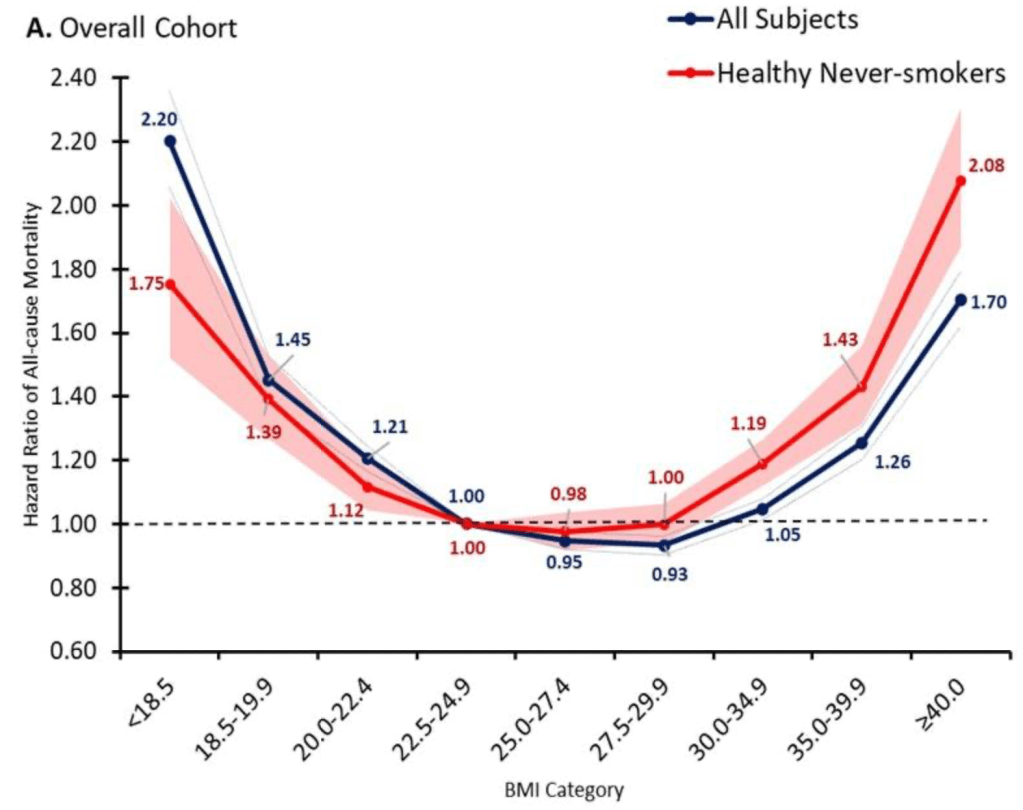
But once production ramps up, I do expect that it will make sense for Medicare to cover weight loss drugs. The health benefits appear to be so large that the drugs are cost effective even at current prices, and prices are likely to fall substantially over time. The big restriction I suspect will still make sense is to require that patients be obese, rather than merely overweight, since being “merely” overweight (BMI 25-29) probably isn’t that bad for you:
Update 4/18/24: I started thinking about this question because of an interview request from Janet Nguyen at Marketplace. She has now published an excellent article on the subject that also includes quotes from John Cawley of Cornell, who knows a lot more than I do on the subject.
I’ve always told my health economics students that Medicaid is both better and worse than all other insurance in the US for its enrollees.
Better, because its cost sharing is dramatically lower than typical private or Medicare plans. For instance, the maximum deductible for a Medicaid plan is $2.65. Not $2650 like you might see in a typical private plan, but two dollars and sixty five cents; and that is the maximum, many states simply set the deductible and copays to zero. Medicaid premiums are also typically set to zero. Medicaid is primarily taxpayer-financed insurance for those with low incomes, so it makes sense that it doesn’t charge its enrollees much.
But Medicaid is the worst insurance for finding care, because many providers don’t accept it. One recent survey of physicians found that 74% accept Medicaid, compared to 88% accepting Medicare and 96% accepting private insurance. I always thought these low acceptance rates were due to the low prices that Medicaid pays to providers. These low reimbursement rates are indeed part of the problem, but a new paper in the Quarterly Journal of Economics, “A Denial a Day Keeps the Doctor Away”, shows that Medicaid is also just hard to work with:
24% of Medicaid claims have payment denied for at least one service on doctors’ initial claim submission. Denials are much less frequent for Medicare (6.7%) and commercial insurance (4.1%)
Identifying off of physician movers and practices that span state boundaries, we find that physicians respond to billing problems by refusing to accept Medicaid patients in states with more severe billing hurdles. These hurdles are quantitatively just as important as payment rates for explaining variation in physicians’ willingness to treat Medicaid patients.
Of course, Medicaid is probably doing this for a reason- trying to save money (they are also trying to prevent fraud, but I have no reason to expect fraud attempts are any more common in Medicaid than other insurance, so I don’t think this can explain the 4-6x higher denial rate). This certainly wouldn’t be the only case where states tried to save money on Medicaid by introducing crazy rules hassling providers. You can of course argue that the state should simply spend more to benefit patients and providers, or spend less to benefit taxpayers. But the honest way to spend less is to officially cut provider payment rates or patient eligibility, rather than refusing to pay providers as advertised. In addition to being less honest, these administrative hassles also appear to be less efficient as a way to save money, probably because they cost providers time and annoyance as well as money:
We find that decreasing prices by 10%, while simultaneously reducing the denial probability by 20%, could hold Medicaid acceptance constant while saving an average of 10 per visit.
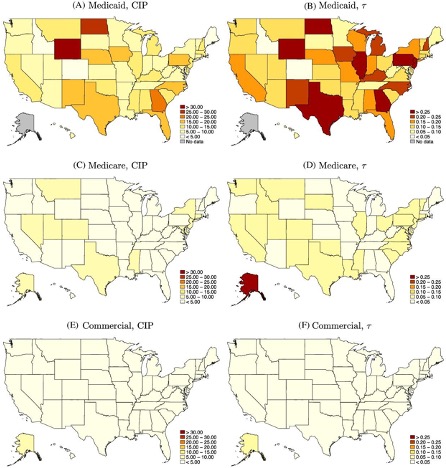
Medicaid is a joint state-federal program with enormous differences across states, and administrative hassle is no exception. For administrative hassle of providers, the worst states include Texas, Illinois, Pennsylvania, Georgia, North Dakota, and Wyoming:
Source: Figure 5 of A Denial a Day Keeps the Doctor Away, which notes: “The left column shows the mean estimated costs of incomplete payments (CIP) by state and payer. The right column shows the mean CIP as a share of visit value by state and payer. “
A good strength workout includes a push, a pull, and legs. When I can get to the gym I like to alternate bench press and incline press for the push; rows and pulldowns for the pull; and squats and deadlifts for the legs. But with a baby to take care of at home, its been hard to find time for the gym. Between driving, waiting for equipment, and the actual lifts, the gym takes an hour. Doing a similar workout at home can take just 10 minutes, and has the advantage that you can watch a baby while doing it.
But the big challenge with home workouts was finding a good leg exercise. Pushes are easy: just do pushups. Pulls are pretty easy: just buy a $15 pullup bar to hang over a door. But how to do a good leg workout without costly barbells and plates that take up lots of space? Enter the pistol squat.
The idea is simply to start from a stand and lower yourself down almost to the ground on a single leg, then come back up on one leg, with the other leg out front for balance:
Source: Snapshot from this video, which shows how to do the standard pistol plus many variations
I find this to be about as difficult as doing a traditional two-legged barbell squat with 1x bodyweight on the bar. The traditional squat has two legs lifting 2x bodyweight (your body itself, plus 1x bodyweight on the bar); the pistol squat has one leg lifting 1x bodyweight (just your body itself), which is about equal. This was perfect for me because I was doing about 3 sets of 5 reps of squats with 1x bodyweight on the bar, so I just do the same number of pistol squats. But what if you’re not exactly at that weight?
Going lighter is easy– just put one hand on something sturdy nearby like a table and lean on it until it takes enough of your weight that you can do the squat. This helps with balance too if that is an issue. Going heavier is harder, but you could carry something heavy in your hands, turn the rise into more of an explosive jump, or just do more reps.
I’d still rather be at the gym, but the complete home workout seems like a good application of the Pareto Principle– you get most of the benefits of the gym while paying only a small fraction of its time and money costs.
Cold symptoms are personally unpleasant, and also have economic aspects. In 2011, Americans directly spent some $40 billion on cold medicines, and the societal costs of workers and students staying home are much greater.
Having dealt with one or two colds a year for quite a few decades, I have significant experience with cold remedies. Also, being a habitual researcher, I have nosed around the internet looking at various studies of the effectiveness of medications.
The biggest problem I have with colds is the nasal drippage at night. In the daytime, I can just blow my nose, but at night this can keep me from sleeping, and also leads to nasty coughing and even bronchial infection if the stuff goes down into my lungs.
There are various so-called first-generation antihistamines out there. They all have some sedative affects. Second-generation antihistamines (e.g. fexofenadine, loratadine, and cetirizine) have fewer sedating qualities, since they do less crossing of the blood-brain barrier, but they tend to be only effective for allergies and less effective for colds.
The best antihistamine for colds which I have found, which seems to be confirmed on the internet, is chlorpheniramine maleate. This was the key ingredient in classic Coricidin, and now appears in Coricidin HPB. HPB stands for high blood pressure. It seems to be always accompanied with some acetaminophen (Tylenol).
(Side comment: the internet seems to say that in general antihistamines are not a problem for people with high blood pressure. Decongestants are. I guess the manufacturer turned the lack of a decongestant in this formulation into a virtue, by calling it “safe for high blood pressure.”)
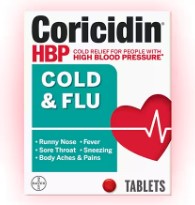
Coricidin HPB exists in many different incarnations on drugstore shelves. The one I go for is the Cold and Flu package, see below. It just has the chlorpheniramine maleate plus acetaminophen:
Most of the other variants have the word “cough” in the title, such as “Cough and Cold,” and contain dextromethorphan cough suppressant. I find the combination of the dextromethorphan plus the antihistamine to be extremely soporific. In my medicine cabinet I label them “zombie pills, since they leave me feeling torpid even 24 hours after taking them. The plain antihistamine version (Cold and Flu) also slows me down, but not nearly as much as the cough suppressant version.
I have also found generic versions (e.g. CVS brand) of chlorpheniramine maleate. However, less than half the pharmacies I check have this stuff on their shelves, for some reason. I guess it is not as heavily promoted as the Vicks NyQuil, which contains the heavily sedating doxylamine succinate (active ingredient in Unisom sleep aid) as the antihistamine component.
I recently ran across an article by Parkview Health which happens to come to the same conclusions I have. I will share their recommendations here in italics, with a little further commentary of my own. On antihistamines for runny nose:
In patients older than 12 years of age: Nyquil™ (doxylamine succinate), Tavist (clemastine fumarate), chlorpheniramine maleate or Benadryl® (diphenhydramine) may help relieve symptoms, although these may cause sleepiness. Chlorpheniramine maleate is the least sedating of the products listed above.
For Nasal Congestion:
The best oral medication would be Sudafed® (psudoephedrine) [sic], which is a medication behind the counter in the pharmacy. There is a medication that is similar and available over-the-counter, Sudafed PE® (phenylephrine), but it’s not nearly as effective as plain Sudafed®. These medications have precautions in some disease states so it is best to consult your physician before treating your nasal congestion.
The best nasal spray medication is Afrin® (oxymetazoline) and while this medication is very effective. It should only be used for 3 days due to the potential side effect of rebound congestion.
Nearly all the meds on the drugstore shelves for stuffy nose use phenylephrine, which is known to be essentially useless. Go figure. Anyway, go for the good stuff, the pseudoephedrine. I use the 12-hour slow-release formulation, keeps me going all day. This med does jazz up your nervous system, so some folks may find the racing brain to be unpleasant. Truck drivers use it to stay awake at night, but for the rest of us, don’t take this at bedtime. I take the antihistamine at night (half hour before bedtime, and typically once in the middle of the night, since it only lasts about four hours), and the decongestant in the morning.
If I can’t afford to be slow-brained the next day, or if I am at peak nasal congestion, I might use the nasal spray at night once or twice, but I know from experience that using it too much leads to permanent stuffiness.
Pseudoephedrine can be used in the manufacture of methamphetamine, so you can’t just load up your shopping cart with boxes of it. In the U.S., you typically have to go to the pharmacist’s counter, and they dole all out maybe two boxes at a time, noting your driver’s license, and entering it into some national database.
I’ll let the good folks at Parkview Health offer the closing wisdom here on cold and flu meds:
Cough:
The best way to address cough is to assess what kind of cough it is. When you cough is it dry and non-productive? Or is it wet and mucus exits with the cough?
If the cough is dry and non-productive:
Utilize Delsym® (dextromethorphan)
If the cough is wet and produces mucus:
Drink water to make the mucus thinner
Utilize Mucinex® (guaifenesin)
Fever/Sore throat: The best medication for fever and/or sore throat is plain Tylenol® (acetaminophen) or NSAIDs such as Motrin® (ibuprofen).
What medications are best to treat the symptoms of the common cold in children? Many medications that are used in the common cold for adults should not be used in children because there have been few trials supporting their use in infants and children. Therefore, the best treatment is Children’s Tylenol® (acetaminophen) or Children’s Motrin® (ibuprofen) for fever or uncomfortable symptoms due to the common cold.
Other than the medications listed, the best way to help your infant or child get rid of the common cold is drinking an adequate amount of fluids. If further help or direction is needed, contact your physician.
What medication(s) are best to treat the flu? Unfortunately, the flu is much harder to treat over-the-counter, as there aren’t medications to really treat this viral infection. The best measures to take are to get plenty of rest, drink enough fluids and utilize Tylenol® (acetaminophen) for fever.
There are medications that can be prescribed by your physician to help shorten the duration of the flu although studies have shown the medications shorten the flu by only a day.
The best way to prevent the flu by getting the flu shot
Other Types of Cold Remedies
The above discussion covered plain vanilla, non-prescription (over the counter) medications. There are other more exotic and expensive meds to be had by prescription, as well as a plethora of folk remedies. Here is a link to about a dozen such nostrums, such as garlic and cognac, vinegar and cayenne pepper, and sauerkraut.