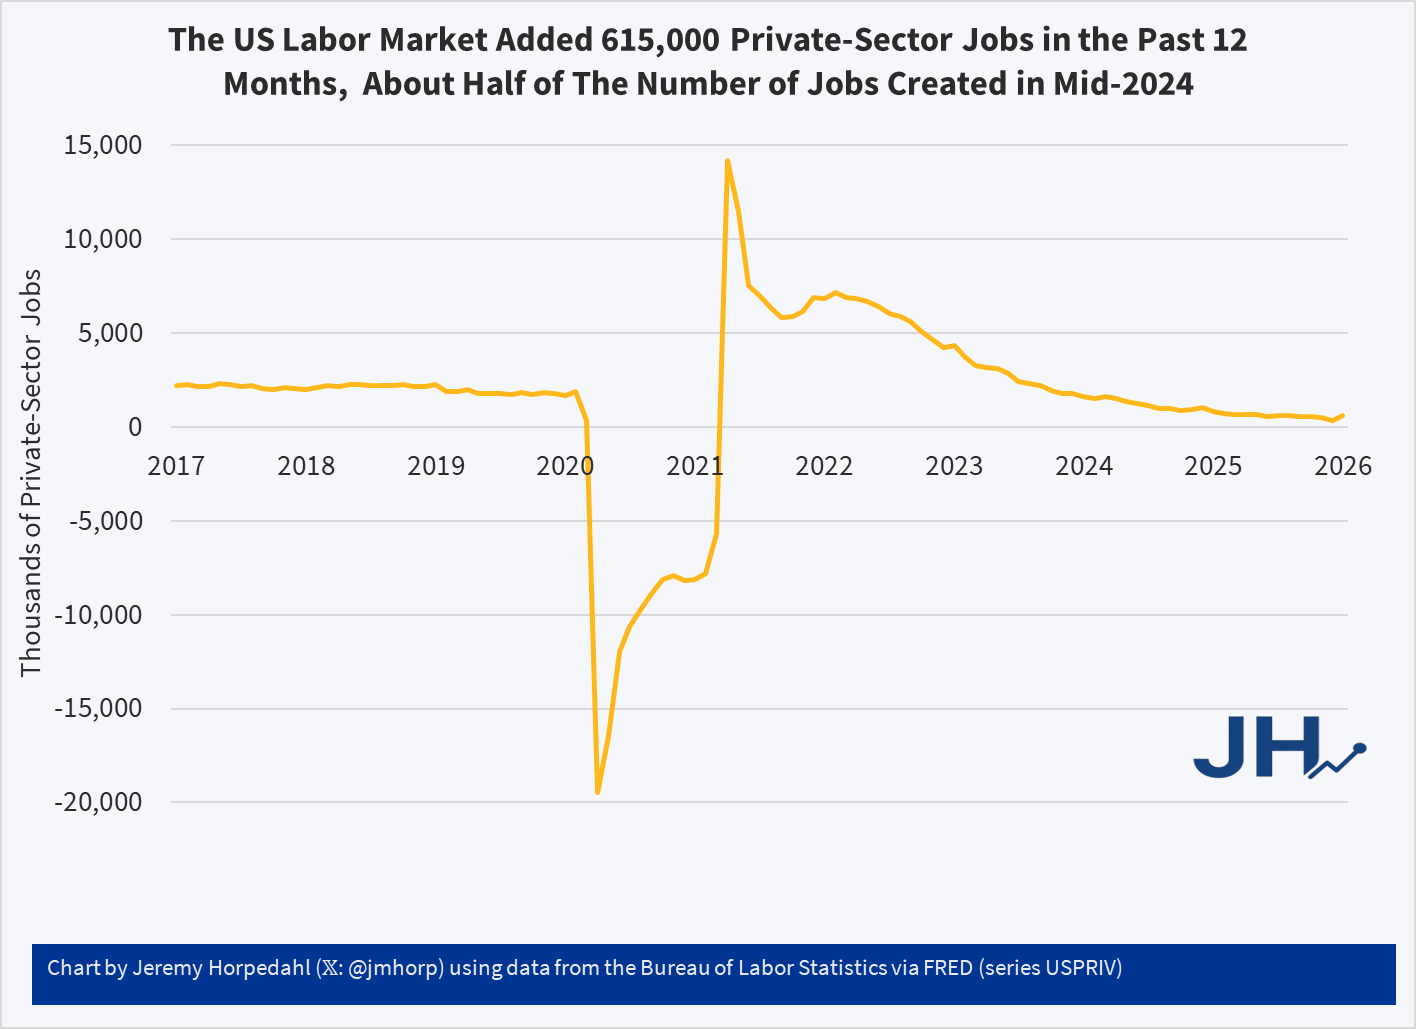
The US Labor Market is Adding About Half as Many Private-Sector Jobs as in Mid-2024
While some of the 2025 data is still coming in (such as GDP), we already have much of the core economic data to evaluate the year.
In a recent op-ed, President Trump claimed, “Just over one year ago, we were a ‘DEAD’ country. Now, we are the ‘HOTTEST’ country anywhere in the world!” Of course, every President claims they are doing great things, and Americans are almost exactly evenly divided over whether the economy was better under Biden or Trump — but this mostly just partisanism (Independents are close to evenly split, though).
So what is the truth? I have put together what I think are the best economic indicators to judge how the economy is doing. And what does it tell us? I think the fairest read is that 2025 was a pretty good year, but based on most economic data it was almost identical to 2024.
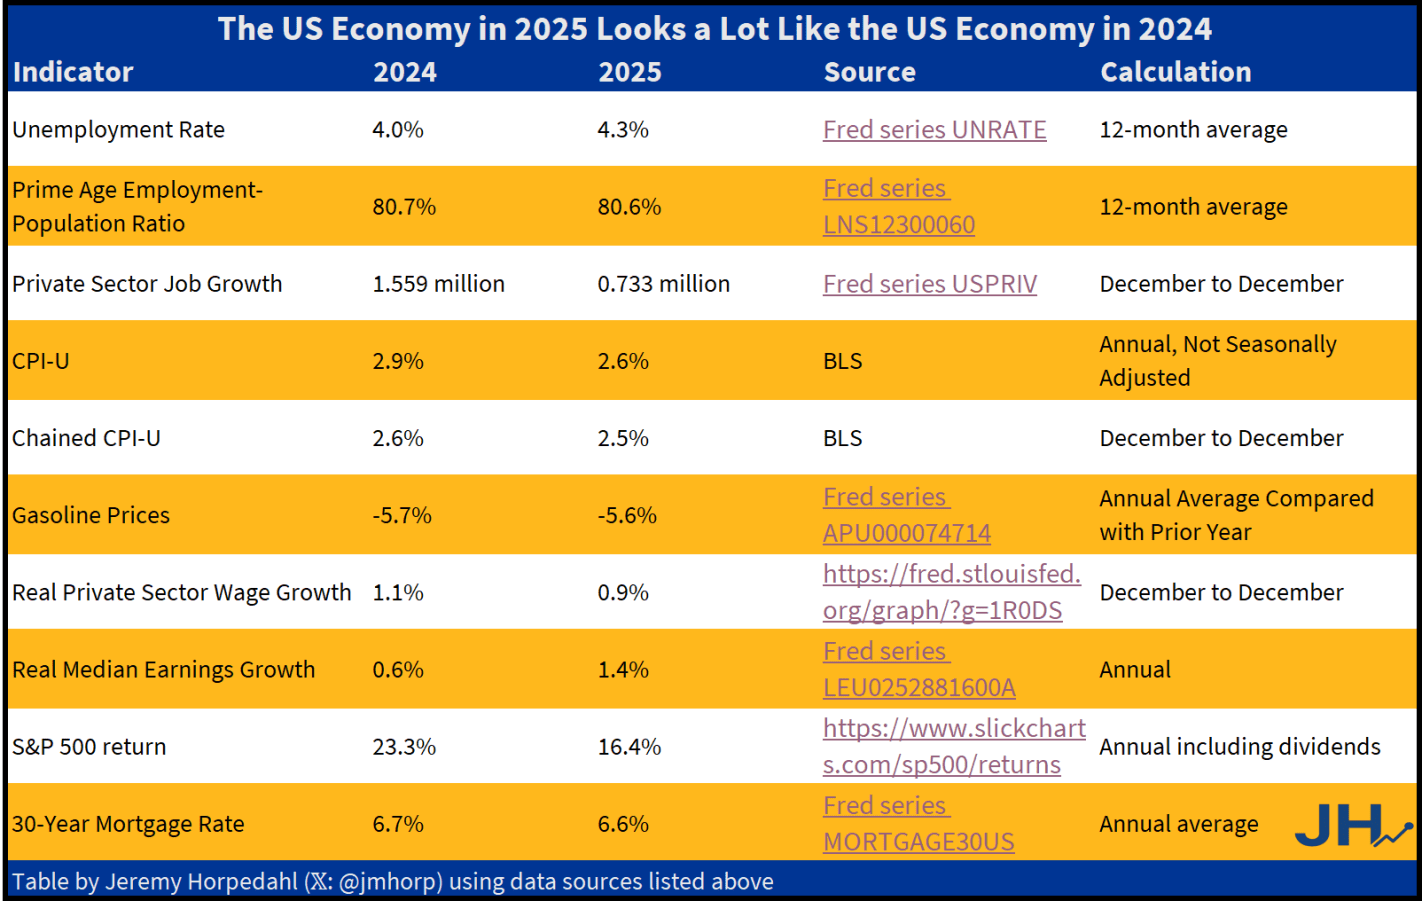
The only indicator that is clearly better is private-sector job growth in 2024. We might add S&P 500 in 2024 growth too, although some other assets such as gold have performed better in 2025. Inflation in 2025 is a tad lower, but not the massive improvement Trump suggests. This is especially the case for one of his favorite prices, gasoline. Yes, 2025 is a little lower than 2024… just like 2024 was a little lower than 2023.
And what of that greatest of all macroeconomic indicators, GDP? We don’t yet have Q4 data for GDP, which means we don’t have full-year 2025 data yet. But the growth rate of real GDP in 2024 was 2.8%, and betting markets are currently predicting 2.3% for 2025. Betting markets could be wrong! But it seems unlikely it would be much above 2.8% (those same betting markets only think there is a 4% chance it will be over 3.0%).
None of this is to say that the 2024 and 2025 economies are exactly the same. Certainly there is more uncertainty due to the shifting tariff policy, but on the other hand even with that uncertainty the economy is still performing fairly well. And my table above only includes economic outcomes, not any changes to government budgets, nor important social indicators such as crime. These are important too, but my focus in this post is only on the economic data.
It seems that in those surveys about whether the economy is better now or under Biden, it would be useful to offer an “about the same” option. Of course, in 2021-2022 inflation was much worse under Biden — but job growth was much better. A lot of this was baked in from the pandemic, 2020 monetary and fiscal stimulus, etc. Once we were back to a semi-normal economy in 2024, it was a decent year. Not blockbuster, but decent. So was 2025.
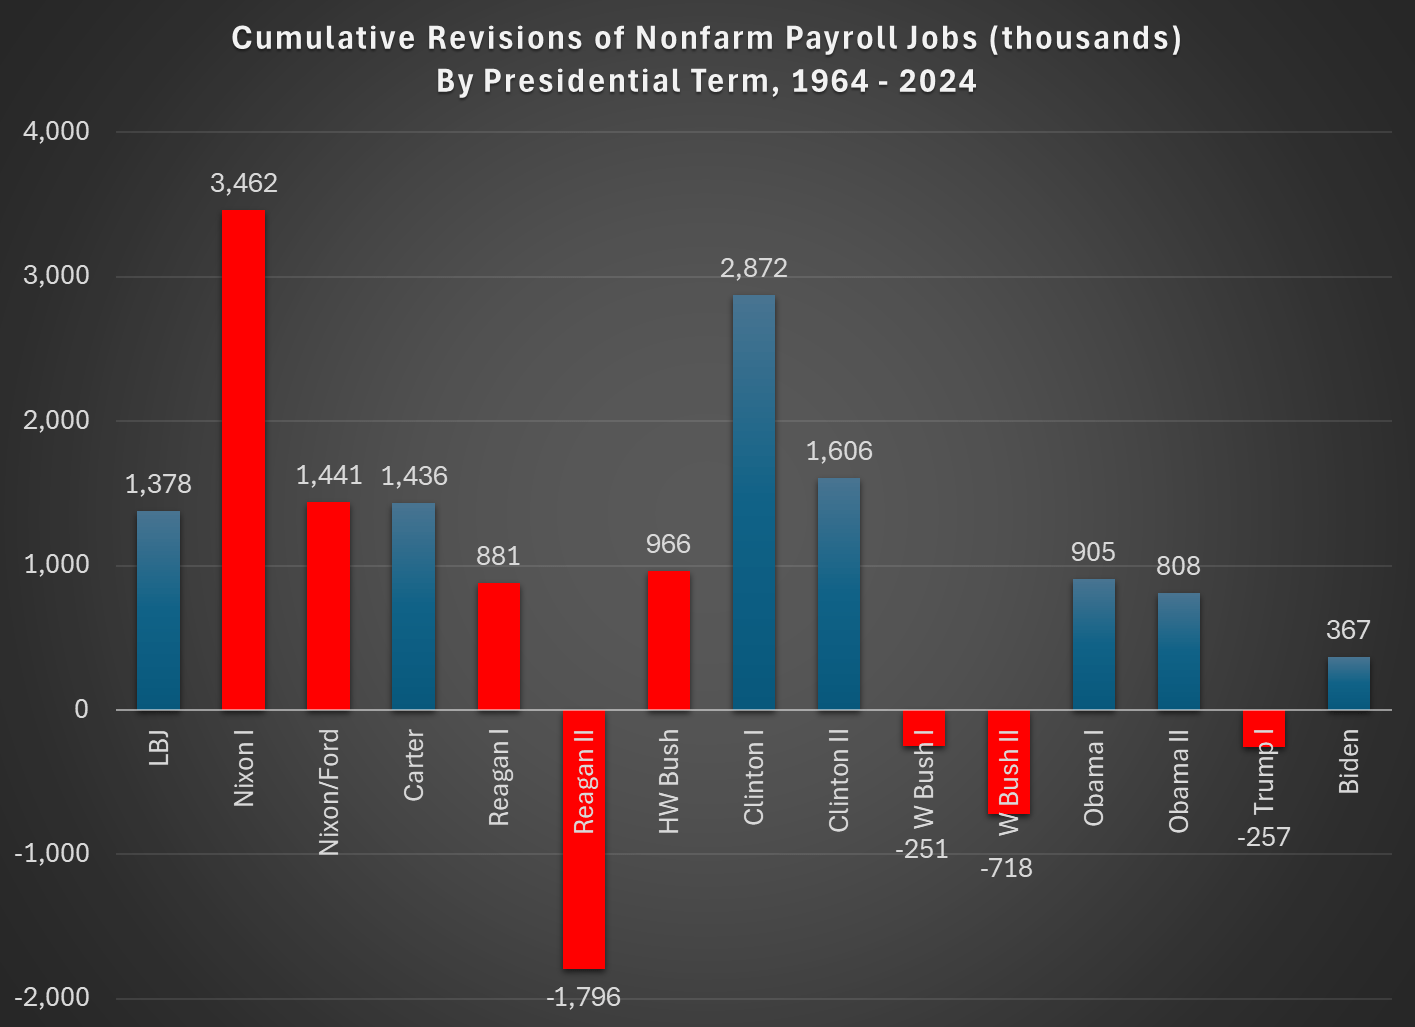
Are you tired of hearing about revisions to jobs data? Well, there was another hot one released by BLS yesterday. Known as the “preliminary estimate of the Current Employment Statistics (CES) national benchmark revision to total nonfarm employment,” this change isn’t yet incorporated into the official jobs data. But it will, possibly slightly modified, be included with the January 2026 jobs release, altering jobs data back to April 2024. It is part of the normal annual process of reconciling the monthly, survey-based jobs data with the near-universe data from unemployment insurance records. Normally, this is a quiet affair, especially the preliminary estimate which is just giving a heads up to researchers about what will be coming in a few months.
I wrote about these preliminary figures last year, when the initial estimate was a negative revision 818,000 jobs. When revised and actually incorporated into the data, it was a somewhat smaller 598,000 jobs, which I then used in a post just last month to show that BLS hasn’t been getting worse at estimating jobs. If anything, they have been getting better. Yesterday’s report showed that the revision could be negative again, this time 911,000 jobs. That’s a little bigger than last year, but maybe it will end up being smaller in the final number. So, no big deal again?
Maybe not. The 911,000 jobs revision would actually be much larger than last year’s revisions because it’s coming on top of a slower growing labor force already. The initial report for March 2024 showed 2.9 million jobs added in the past year, so the 818,000 revision was a much smaller share than this most recent data, since the March 2025 initial report showed just 1.9 million jobs added in the prior year. And the March 2025 jobs numbers have already been revised down by over 100,000 jobs since the initial report, meaning that potentially half or more of the initially reported job gains would be lost due to the revision, as opposed to about 20 percent last year.
Is losing half of the job gains large? Yes. In fact, almost unprecedented:

(note: I am trying out a new chart template. Let me know what you think!)
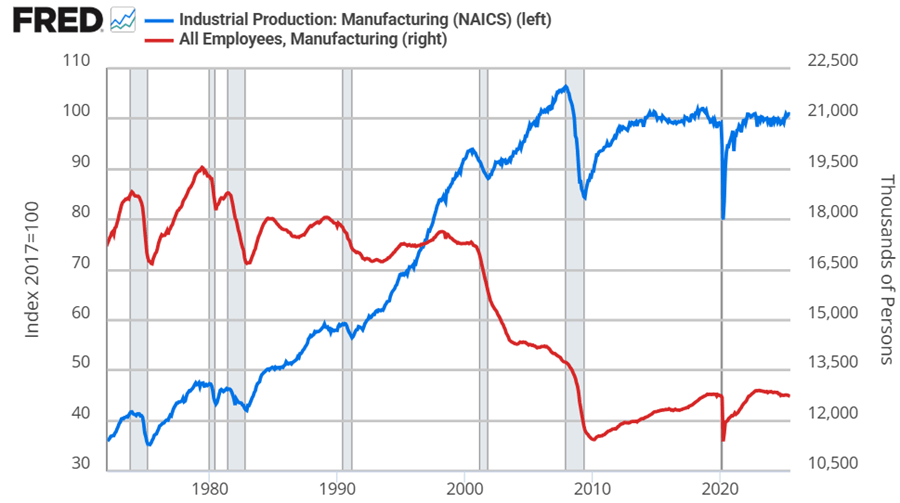
Continue readingDid president Trump’s first term tariffs, enacted in 2018, increase manufacturing employment or even just manufacturing output? Let’s set the stage.
Manufacturing employment was at its peak in 1979 at 19.6 million. That number declined to 18m by the 1980s, 17.3m in the 1990s. By 2010, the statistics bottom out at 11.4m. Since then, there has been a rise and plateau to about 12.8m if we omit the pandemic.
Historically, economists weren’t too worried about the transition to services for a while. After all, despite falling employment in manufacturing, output continued to rise through 2007. But, after the financial crisis, output has been flat since 2014, again, if we omit the pandemic. Since manufacturing employment has since risen by 5% through 2025, that reflects falling productivity per worker. That’s not comforting to either economists or to people who want more things “Made in the USA”.
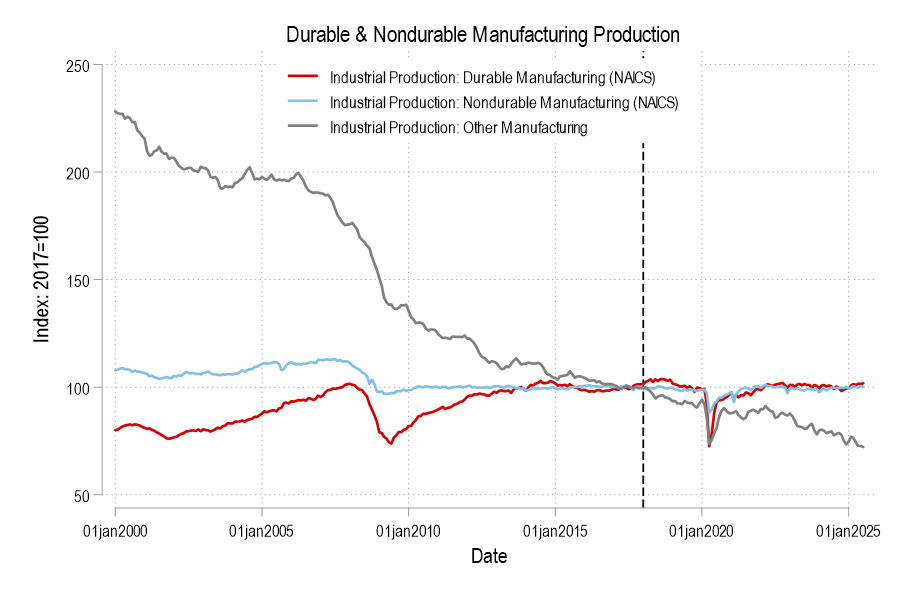
Looking at the graphs, there’s no long term bump from the 2018 tariffs in either employment or output. If you squint, then maybe you can argue that there was a year-long bump in both – but that’s really charitable. But let’s not commit the fallacy of composition. What about the categories of manufacturing? After all, the 2018 tariffs were targeted at solar panels, washing machines, and steel. Smaller or less exciting tariffs followed.
Breaking it down into the major manufacturing categories of durables, nondurables, and ‘other’ (which includes printed material and minimally processed wood products), only durable manufacturing output briefly got a bump in 2018. But we can break it down further.
Yesterday I showed that BLS jobs reports from the CES aren’t getting worse over time, if we judge them by how much they are later revised. In fact, they are much better than decades past, with the last 20 years or so standing out as much better than the past.
Today I want to address a related but separate topic: are the initial jobs reports good at telling us when a downturn in the labor market is beginning? This is actually the strongest argument for releasing this survey data in a timely manner, even though the data often goes through significant revisions later. The report typically comes out the first Friday of a new month, so it is very current data. Given that the likely new BLS Commissioner has signaled he prefers the more accurate quarterly release, even though it is 7-9 months after the fact, it is useful to ask if these initial reports have any value in telling us when labor market declines (and recessions) are beginning.
That’s right: you are getting two posts from me this week, on essentially the same topic. Because it’s very important right now.
The short answer: the report is very good for the purpose of identifying downturns, especially the start of the downturns. Let’s walk through the past few recessions.
Continue readingYou’ve probably heard a lot about BLS data recently (or at least more than usual) with Trump firing the BLS Commissioner after a bad monthly revision to the nonfarm payroll jobs figures. But this didn’t come out of the blue, as there was plenty of criticism of the jobs numbers during the Biden term as well, mostly coming from the political right.
The two main criticisms leveled at the BLS, in my reading of it are:
I think both of those claims can be analyzed with the following chart, which also shows those claims to be incorrect:
Thousands of keyboards were likely drenched four days ago as coffee spewed from thousands of nostrils upon reading the headlines that President Trump fired the head of the Bureau of Labor Statistics because he (the prez) didn’t like the July 2025 job numbers that were reported. Apparently, the job stats were not as great as we had been led to expect for the new regime of tariffs and deportations. (Someone should inform the politicians that businessmen need predictability for making any expansionary plans). So, shoot the messenger, that will fix it.
The First Ire was apparently kindled especially by the truly massive downward revisions to the May (-125,000) and June (-133,000) job figures, which reduced the combined employment gain for those months by 258,000. That made for three anemic employment months in a row, which is a different picture that had been earlier portrayed. For those unfamiliar with past BLS reports, that could seem like manipulation or gross incompetence. For instance, whitehouse.gov published an article titled, “BLS Has Lengthy History of Inaccuracies, Incompetence”, excoriating the “Biden-appointed”, now-fired Erika McEntarfer who “consistently published overly optimistic jobs numbers — only for those numbers to be quietly revised later.”
But massive overestimations of jobs creation, followed a month or two or three later by massive downward revisions are pretty standard procedure for the BLS in recent years. Fellow blogger Jeremy Horpedahl has noted prior occurrences of this, e.g. here and here. There is no reason to suspect nefarious motives, though. The understaffed and overworked folks at BLS seem to be doing the best they can. It is just a fact that some key data simply is not available as early as other data. There are also rational adjustments, e.g. seasonal trends, that must first be estimated, and only later get revised.
Bloomberg explains some of the fine points of the recent revisions:
The downward revision to the prior two months was largely a result of seasonal adjustment for state and local government education, BLS said in earlier comments to Bloomberg. Those sectors substantially boosted June employment only to be largely revised away a month later.
But economists say the revisions also point to a more concerning, underlying issue of low response rates.
BLS surveys firms in the payrolls survey over the course of three months, gaining a more complete picture as more businesses respond. But a smaller share of firms are responding to the first poll. Initial collection rates have repeatedly slid below 60% in recent months — down from the roughly 70% or more that was the norm before the pandemic.
In addition to the rolling revisions to payrolls that BLS does, there’s also a larger annual revision that comes out each February to benchmark the figures to a more accurate, but less timely data source. BLS puts out a preliminary estimate of what that revision will be a few months in advance, and last year [2024], that projection was the largest since 2009.
Perhaps it would be wise for the BLS to hang a big “preliminary” label on any of the earlier results they publish, to minimize the howls when the big revisions hit later. Or perhaps some improvements could be made in pre-adjusting the adjustments, since revisions there do seem to swing things around outrageously. I expect forthcoming BLS reports to be the subject of derision from all sides. We all know which parties will scoff if the job report looks great or if it looks not great. Presumably the interim head of the Bureau, William Wiatrowski, is busy polishing his resume.
And POTUS should be careful what he wishes for – “great” job growth numbers would, ironically, strengthen the case for the Fed to delay the interest rate cuts he so desires.
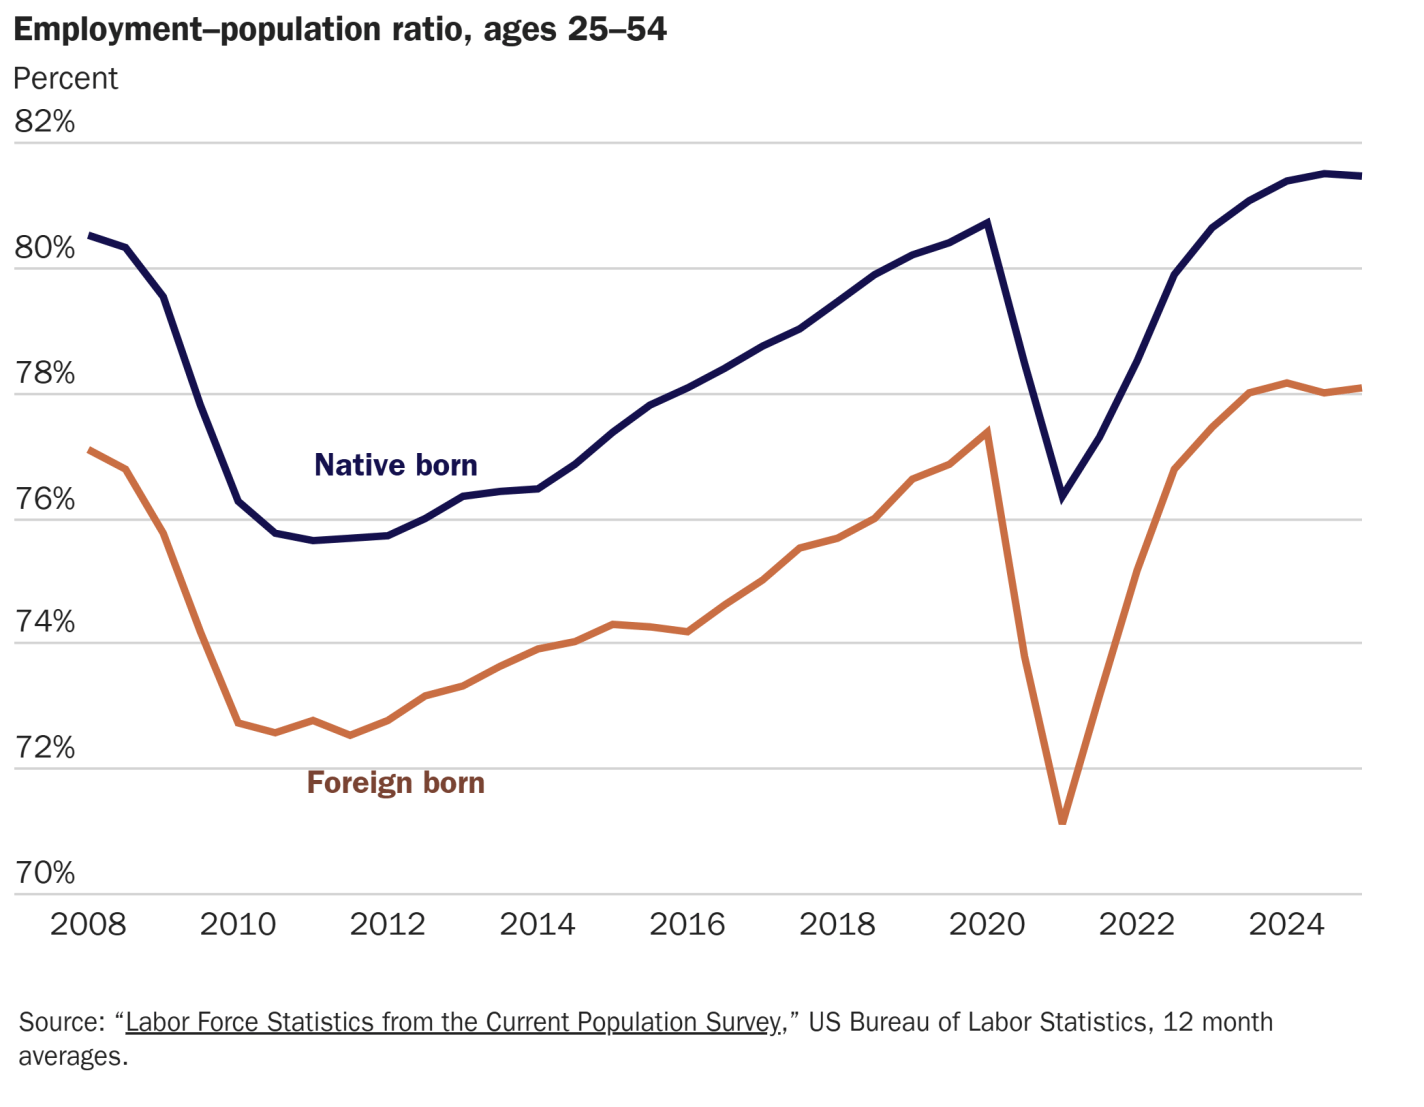
Are foreigners taking the jobs of native-born Americans? The fear that foreigners are displacing domestic workers has long been feared, and remains one of the major economic objections to immigration. And recently there seems to be some evidence this is happening in the US, with almost all net job creation in the US in the past 5 years going to foreigners, while native-born employment has been flat.
But this is not evidence that foreigners are taking our jobs, as I explain in my latest piece for the Cato Institute. The reason is simple: the native-born, working-age population hasn’t been growing. If we looking at the employment-rate of native-born Americans, it is higher than it has ever been, and higher than for the foreign-born population:
After raising rates in 2022 to belatedly combat inflation, the FOMC was feeling successful in 2024. They were holding the line and remaining steadfast while many people were getting all in a tizzy about pushing us into a recession. People had been predicting a recession since 2022, and the Fed kept the federal funds rate steady at 5.33% for an entire year. Repeatedly, in the first half of 2024, betting markets were upset that the Fed wasn’t budging. I had friends saying that the time to cut was in 2023 once they saw that Silicon Valley Bank failed. I remained sanguine that rates should not be cut.
I thought that rates should have been higher still given that the labor market was strong. But, I also didn’t think that was going to happen. My forecasts were that the Fed would continue to keep rates unchanged. At 5.33%, inflation would slowly fall and there was plenty of wiggle room for unemployment.
Then, we had a few months of lower inflation. It even went slightly negative in June 2024. Some people were starting to talk about overshooting and the impending recession. I documented my position in August of 2024. Two weeks later, Jerome Powell gave a victory lap of a speech. He said that “The time has come for policy to adjust”. Instead of discerning whether the FOMC would cut rates, the betting markets switched to specifying whether the cut would be 0.25% or 0.5%. The Fed chose the latter, followed by two more cuts by the end of the year.
I was wrong about the Fed’s policy response function. But why? Was the FOMC worried about the downward employment revisions? That was big news. Did they think that they had inflation whipped? I’m not sure. There was a lot of buzz about having stuck the soft landing. In late 2024, I leaned toward the theory that the Fed was concerned about employment. Like, they thought that we had been doing better until then.
Continue readingWhile many data watchers eagerly anticipate the monthly jobs report coming out this Friday, today the Bureau of Labor Statistics released another set of jobs data, and arguably a much better and more complete set of jobs data for 2023. It’s called the Quarterly Census of Employment and Wages, and I have written about this data before.
The QCEW data is better because, as the name implies, it is a census of employment, rather than just a survey, meaning it is an attempt to measure the universe of employment (or at least, the universe of employment covered by unemployment insurance, which is something like 95% of the workforce). Surveys are nice, because they can provide us more timely information — notice that the QCEW is 5-6 months out of date. It is also useful to have this complete data to check on the monthly data and see if it was mostly accurate — indeed, the data is updated through a process called “benchmarking” on a regular basis.
What do the latest QCEW show us? The headline number is that total employment grew by 2.3 million jobs from December 2022 to December 2023, which is 1.5% job growth (if we use annual averages, growth is a little stronger at 2%). That’s a healthy rate of job growth, but it’s less than the familiar Nonfarm Payroll series (CES) shows from December to December: about 3 million jobs added, or a growth rate of 1.8% If we focus just on private-sector employment, we see again that the monthly series is running faster than the more comprehensive QCEW: 2.3 million jobs in the monthly report added versus 1.7 million.
Does all this mean that the monthly jobs numbers are “fake”? Of course not. Surveys will always be imperfect, but they are still useful. But it does mean that you might want to discount them by about 25 percent.