I’ve written numerous times about generational wealth on this blog. My biggest post was one comparing different generations using the Fed’s Distributional Financial Accounts back in September 2021. I’ve posted several updates to that post as new the quarterly data was released, but this post contains a major update. I’ll explain in great detail below about the updates, but first let me present the latest version of the chart (through 2023q3):
Regular readers will notice a few differences compared with past charts. The big one is that young people have a lot more wealth than it appeared in past versions of this chart! You’ll also notice that I have relabeled this line “Millennials & Gen Z (18+)” and shifted that line over to the left a few years to account for the fact that this isn’t just the wealth of Millennials, and therefore the median age of this group is lower than in my past charts. The two dollar figures I highlighted are at the median age of 30 for these age cohorts (unfortunately we don’t have data for Boomers at that age).
The Federal Reserve has released the latest update to their Distributional Financial Accounts data, which the data underlying several of my past posts on generational wealth. With that recent data, I have updated the chart of wealth for Baby Boomers, Generation X, and Millennials.
The data is shown on a log scale to better show growth rates and allow for easier visual comparisons. But if you are interested in the more precise numbers, in the most recent quarter (2023q2) Generation X has, on average about $620,000 in net wealth, which compares favorably with Baby Boomers at about the same age (in 2006) with about $539,000 in net wealth per person. That’s about 20 percent more.
Millennials have about $115,000 in net wealth on average, which also compares favorably with Baby Boomers, who had slightly more at about the same age (in 1990) with $121,000 in net wealth on average. Given the uncertainties of all the data that goes into this, I’d say those are roughly equal. Gen X had a bit more around the same age (in 2007) with $149,000, but that fell significantly the next two years during the Great Recession.
(For more detail on my approach to creating the chart, see the linked post above, but in short I’m using the Fed DFA data for wealth, Census Bureau data by single year of age for population, and the Personal Consumption Expenditures price index for inflation adjustments (I also have a chart with the CPI-U — it’s not much different). Wealth data is for the 2nd quarter in each year (to match 2023), except for 1989 since the 3rd quarter is the first available.)
Given how much wealth can fluctuate based on housing values (see above for Gen X from 2007-2009), it might be useful to look at the data with housing. Housing is also a weird kind of wealth — for the most part, you can’t access it without selling (other than certain home equity loans), and when you do sell, unless your home appreciated more than average, you just have to move to another home that also appreciated.
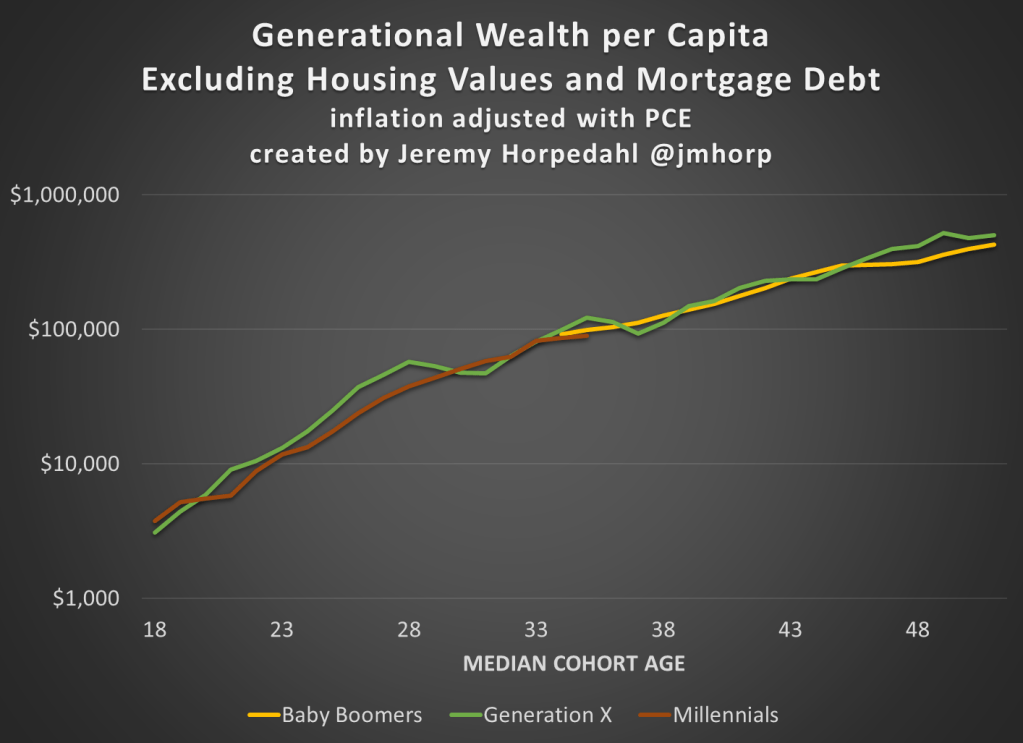
Here’s the chart excluding housing value and mortgage debt:
The chart… doesn’t change much. The values are all lower, of course, but the comparisons across generations look pretty similar. Gen X right now is 17 percent wealthier than Boomers at the same age. And if we look at all three generations around the median age of 35, they are pretty close: Gen X with $123,000 (but slipping over the next few years), Boomers with $99,000, and Millennials with $90,000.
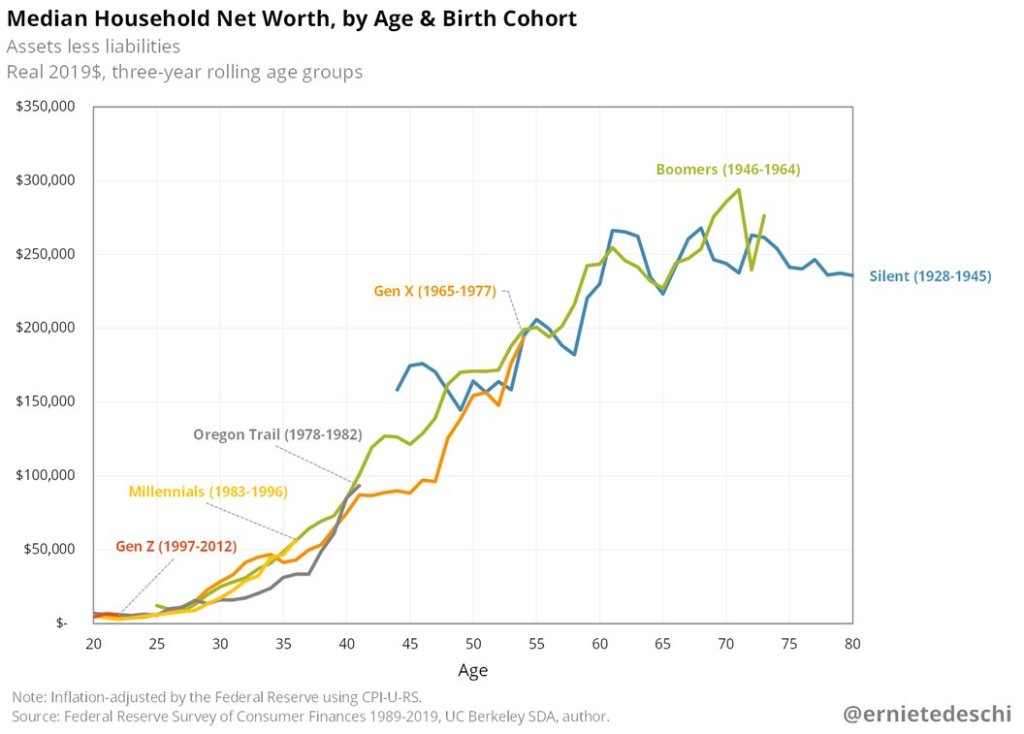
How do young people fare when it comes to household wealth? The recently released Survey of Consumer Finances from the Federal Reserve provides some insights. One major takeaway: the much-maligned Millennials are doing pretty good! Ernie Tedeschi created this informative chart on Twitter:
Looking at household net worth at roughly the same age, Millennials today have roughly the same household wealth as Boomers did in the past. And both of these generations beat the generation between them, Gen X, as well as the “microgeneration” creatively labeled Oregon Trail.
And it’s something of a running joke on Twitter, but I must add: Yes! It’s adjusted for inflation!
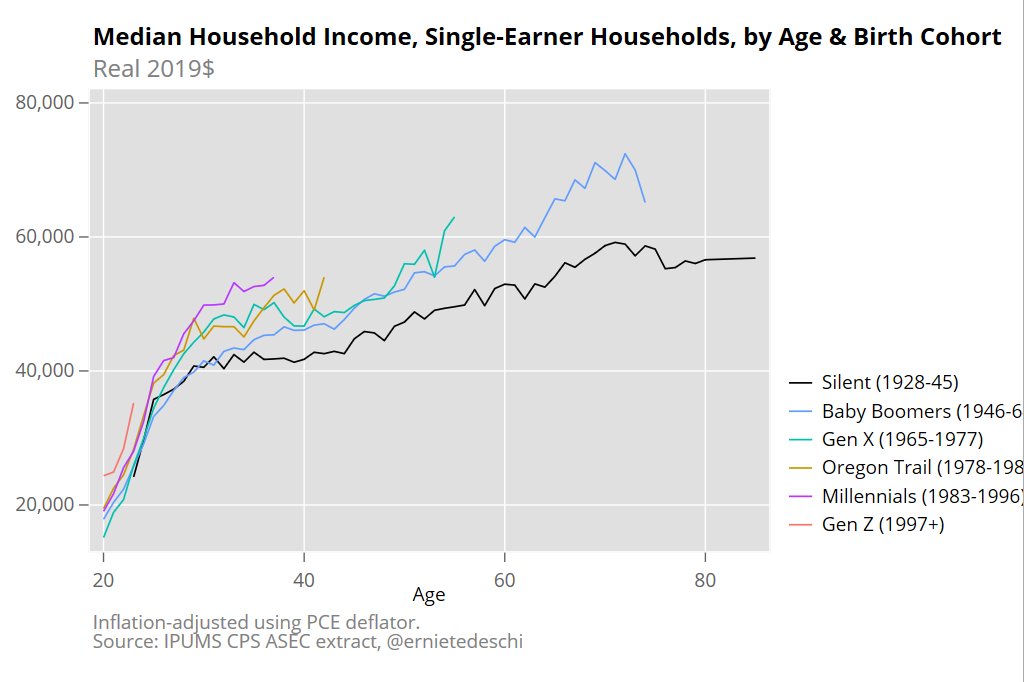
Part of this may be driven by the increase in dual-income households. Certainly that matters. While wealth data by number of earners is harder to track down, income data is more readily available. What if we look at single-income households? Millennials are still in the lead! (Once again, the chart comes from Ernie Tedeschi.)
And before you ask: Yes! It’s adjusted for inflation!
None of this means that Millennials don’t face challenges, including financial ones. This data is current through 2019, so 2020 will almost certainly make these numbers look worse, for a time. But all things considered and anecdotes aside, the kids today seem to be as well or better than past generations.