Statistics is hard…
I want to share a conversation about proportion Vs. probability.
My friend, Corey DeAngelis, has a new research paper that measures the link between school district unionization and in-person re-opening in the time of Covid-19.
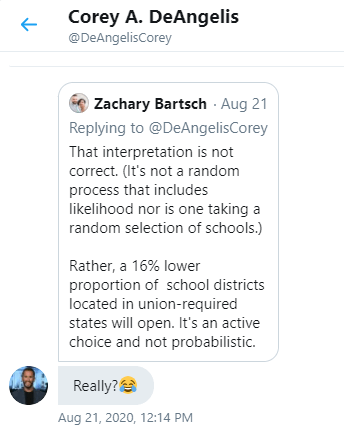
He promoted it on Twitter – but little did he know that a member of the statistics police was on patrol…
Am I splitting hairs? Of course I am. Do most people know what he means? I think so. Is the distinction important? You betchya.
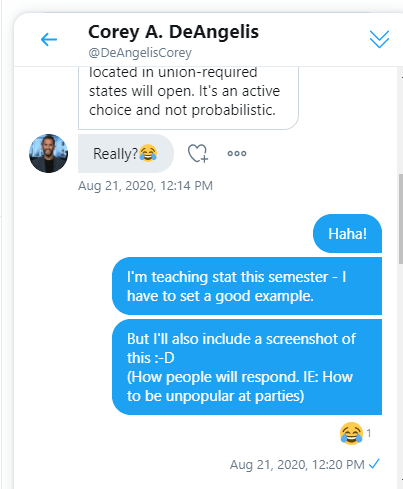
Corey, sent me a private message with the appropriate response:
Oh, yes – really. Speaking probabilistically when we don’t have all of the information is so very tempting. To us the observer, lots of things appear probabilistic to us that are deterministic in nature (Have you ever played the board game “Don’t Wake Daddy!”, “Hot Potato”, or “Musical Chairs”? There is a process that determines when daddy will awaken or when the music ends). Not knowing the underlying process makes the experience appear probabilistic. But appearances can be deceptive.
Often, people speak as if they are taking a random draw from a sample. That can be probabilistic. Given a draw of school districts, the likelihood of selecting an opening school from non-union districts is greater than choosing an opening school from a union district. This is entirely right. What is not right is saying that teacher-unionized districts are “more likely” to stay closed.
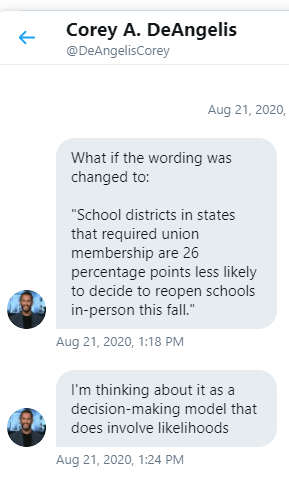
The decision to stay closed or to open is a product of collective choice – the decisions of several parties with diverse interests. Of course, we don’t know every single influence on the decision. But we do know that the outcome follows a pattern. A lower proportion of schools open in teacher-unionized districts than the proportion in non-union-districts.
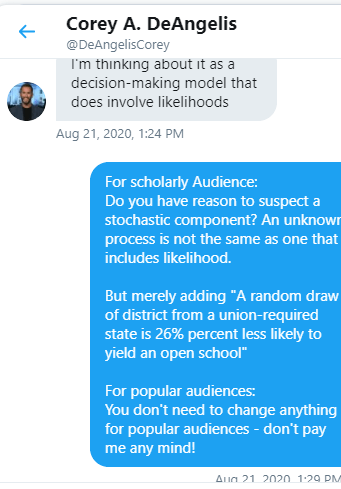
Researchers often talk about their sample as if it is reality. A random draw from a sample has a probability. Nobody is randomly drawing an actual school district and expecting a probabilistic process to determine the policy outcome. Just ask yourself: “Does the sample proportion tell me an empirical probability?”

*Note: This is why we have different language when using a standard normal distribution.
“What proportion of area is to the left of z*=1.5?”
“Given a random draw from a standard normal distribution, what is the probability of selecting a value that is less than 1.5?”
One describes randomness. The other describes an already determined outcome.
Note: Yes, this kind of behavior does have implications for one’s popularity.