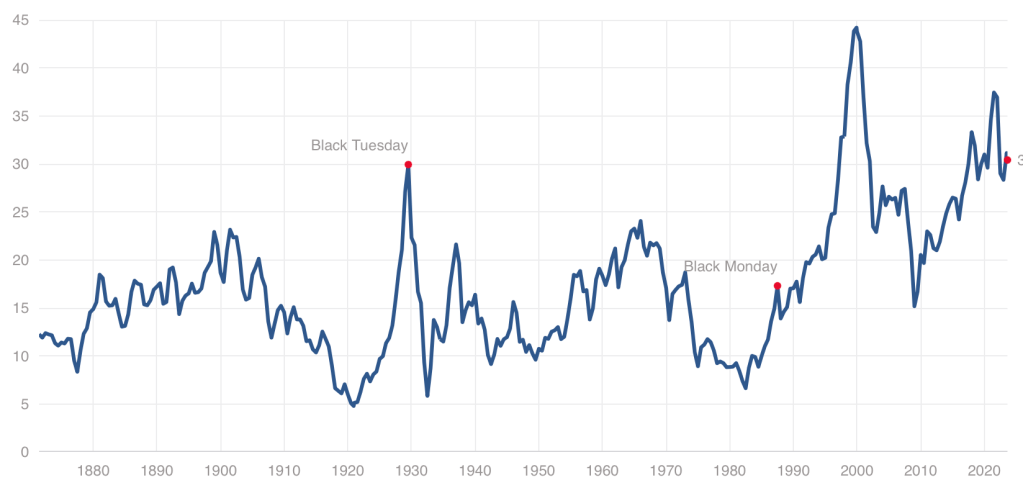
While we have stepped back from the meme stock craziness of 2021, US stocks remain quite expensive by historical standards, with our Cyclically Adjusted Price to Earnings (CAPE) ratio at almost twice its long-run average:
Even at a high price, US stocks could still be worth it, and I certainly hold plenty. But I also think it it a good time to consider the alternatives. US Treasury bond yields are the highest they’ve been since 2007. But there are also many countries where stocks are dramatically cheaper than the US- and not just high-risk basket-cases, but stable “investable” countries.
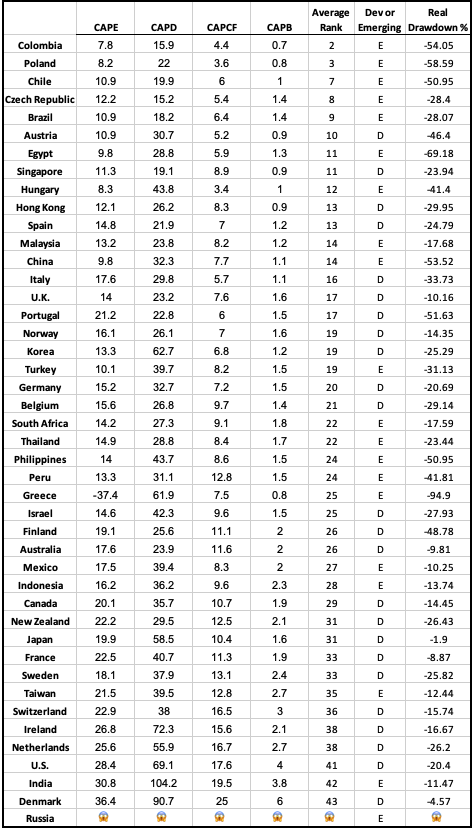
There are several reasonable ways to measure what counts as “expensive” for stocks in addition to the CAPE ratio I mention above. The Idea Farm averages out four such measures to determine how expensive different “investable” (large, stable) country stock markets are. Here is their latest update:
You can see that US stocks are expensive not only relative to our own history, but also relative to other countries, lagging only India and Denmark. That means that much of the world looks like a relative bargain, with the cheapest countries being Colombia, Poland, Chile, Czech Republic, and Brazil.
Of course, sometimes stocks, just like regular goods and services, are cheap for a reason: they just aren’t that good. They might be cheap because investors expect slow growth, or a recession, or political risk. But if you don’t share these expectations about a cheap stock (or country), that’s when to really take a look. I certainly did well buying Poland after I saw they were the cheapest in last year’s global valuation update and thought there was no good reason for them to stay that cheap.
I like that the chart above provides a simple ranking of investable markets. But if you wish it included more valuation measures, or small frontier markets, you can find that from Aswath Damodaran here. Some day I hope to provide a data-based, rather than vibes-based, analysis of which countries are “cheap/expensive for a reason” vs “cheap/expensive for no good reason”, featuring measures like industry composition, population growth, predictors of economic growth, and economic freedom. For now you just get my uninformed impression that Poland and Colombia seem like fine countries to me.
Disclosure: I’m long stocks or indices in several countries mentioned, including EPOL, FRDM, PBR.A, CIB, and SMIN. Not investment advice.
You may have heard that there is a new viral song which deals with a few economic issues. Noah Smith has a good analysis of “Rich Men North of Richmond,” which he mostly finds to be incorrect in its analysis (for example, of welfare policy). But Smith does say that the song has a point: manufacturing wages haven’t performed well in recent years. Not only has pay for factory workers “[lagged] the national average in recent years,” for those workers in Virginia, it’s lower in real terms than in 2010.
Well that all doesn’t sound good! Smith is only going back to about 2000 with the data he shows. What if we took a longer run perspective? What if we took a really long-run perspecitive?
Here’s wages for blue-collar factor workers that goes back to 1939 in the US:
The wage data (for manufacturing production workers) is from BLS and the PCE price index is from the BEA. What do you notice as you look at the data?
First, it is true that the last 20 years or so hasn’t been great. Only about 8% cumulative growth since 2002. That’s not great!
But as you look back further, you’ll notice that gains are substantial. Compared to what some might consider the “golden age” of manufacturing wages, the early 1950s, real wages have roughly doubled. It’s true, the growth rate from 1939-1973 is much, much better than the following 50 years. Wouldn’t it be nice if that growth rate had continued! But no doubt you’ve seen many memes saying something like “in the 1950s you could support a family on one high-school graduate income, but not today!” This data suggests that view of the 1950s is a little distorted by nostalgia.
One final thing to note: we might think that one big change in recent decades is that a lot more compensation goes to benefits, rather than wages. There’s actually a total compensation series for blue-collar workers going all the way back to 1790:
The total compensation data, as well as the CPI data that I used to inflation-adjust the figures (to 2022 dollars), comes from the fantastic resource Measuring Worth. This is a total compensation measurement, so it includes benefits, but the source data tells us that up until the late 1930s, it’s really just a wage measure. So potentially we could splice this together with the above chart, to get a “wage only” series covering the entire history of the US.
However, when we look at total compensation, we still see the post-1970s stagnation. Real compensation is roughly the same as about 1977. Yikes! Note here that we’re using the CPI, since the PCE index only goes back to 1929, and the CPI tends to overstate inflation (yes, that’s right, sorry CPI truthers). Still, it’s not the most optimistic picture.
Or isn’t it? With all of the automation and global competition in manufacturing coming on board in the past 50 years, perhaps our baseline is that things could have been much worse. In any case, if we look at total compensation, it’s currently about double what it was in the post-WW2 era. That’s even with the dip in 2022 due to high CPI inflation.
Wages and compensation of blue-collar productions workers have indeed been growing slowly for the past few decades. That much is true. On the other hand, they are still among the highest they have ever been in history, over 50 times (not 50%, 50 times!) higher than at the birth of this nation. This ranks them as probably the highest wages anywhere in world history for an occupation that doesn’t require an advanced degree. That history is worth knowing.
The spread of highly-contagious and sometimes fatal Covid-19, and the responses to it (lockdowns and then trillions of dollars of federal giveaway money to mitigate the effects of the lockdowns and now huge interest rate hikes to counter the inflation caused by that giveaway money) have been arguably the most economically momentous events of this decade so far. Thus, it behooves us to keep an ongoing eye on this beast, since it seems to keep coming back in waves.
We all know that Covid is spread by little “aerosol” droplets coming out the infected people’s mouths and noses. Those aerosols are mainly generated by speaking and singing. So being in a room full of talking or singing people (e.g., a happy convention or bar, or a hymn-singing church) can be a super-spreader situation.
I have reasons to try to avoid respiratory diseases, and so I attended church on-line or outdoors for most of the past three years. The Covid numbers finally got low enough this spring that I started attending inside, and even going unmasked the past two months.
Alas, Covid cases and hospitalizations are back on the rise, it seems due to the new Eris or EG.5 subvariant. Like the infamous omicron variant of a year ago, it is very transmissible and resistant to existing vaccines, but is not as deadly as the original strain. Much of the population has some immunity due to vaccines and/or prior exposure. Also, antivirals like Paxlovid are widely available to help mitigate symptoms. Still, a case of Covid often makes for an uncomfortable and disruptive week or two, and can still be fatal or debilitating.
So, I have done a quick amateur scan of the internet, trying to get a fix on what to expect. One thing that stands out is that actual case numbers are far higher than officially reported, for a couple of reasons. One is that the rigorous, systematic reporting of cases has fallen off, since Covid was deemed no longer an emergency. Also, with the end of free test kits and the generally more lax public attitude (we just want to be done with this), there is far less testing done than in 2022. (In communities with systematic testing, it turns out that the best way to track Covid is by analyzing wastewater).
Will the Latest Vaccines Save Us?
The vaccine story seems somewhat mixed. The latest booster vaccine, to be available around October, will target the XBB.1.5 subvariant, which is what was mainly circulating earlier this year. However, it is expected that since EB.5 is closely related to XBB.1.5 (both of these are of the general omicron family), the booster will confer some immunity to EB.5. That is the good news.
The bad news is that the public’s uptake of boosters in general is well under 50%, so we may expect EB.5 or whatever the next subvariant is to continue to circulate, and probably surge during the colder months when respiratory diseases tend to spread. Also, vaccines do not really stop you from getting Covid, they mainly act to mitigate the symptoms by helping your body’s defenses to react faster.
Starting next week, I will resume wearing an effective KN-95 or my preferred KF-94 mask at church and other venues where a lot of people are talking or singing.
“Major cuts in faculty, academic programs could hit West Virginia University as financial concerns loom” by Maddie Aiken, Pittsburgh Gazette
Is this fiscally driven? Politically motivated? An attack on education? Some sorta boondoggle? Hard to say with any degree of confidence from all the way down here in Clemson, but that won’t stop me from speculating to my heart’s content. With these sorts of proposals on the table, there has arrived no shortage of proposed explanations and blame. All that said, I am quite confident that the final outcome will result in a different university that more than a few other universities will eventually resemble as well (NB: not mine, to be clear. For all of it’s standard pecadilloes, Clemson appears to be pretty good shape. That said, if the fates hand us a couple losing football seasons alongside a QAnon woke-truther voting block winning a set of seats in the state legislature, well, anything becomes possible).
So why is this happening?
A handful of reasonable explanations, in semi-random order
The University president is a corrupt and incompetent boob
Feasibility: 4/5 Explanatory power: 2/5
Whoo-buddy. This guy appears to be the kind of known commodity that only a completely checked-out board of trustees would ever put in charge of a university. To wit, while plowing through millions he got caught spending $64k (not a typo) on his “signature” bow ties at his job prior to WVU. He has since burned millions at WVU on all the stuff that corrupt managers spend money on when they can’t put the money directly in their own pockets. Click on the whole thread below, it’s pretty jarring. That said, while this is likely all true, I’m not sure he’s burned enough money to wholly explain cuts this deep and a $45m budget shortfall.
Gordon Gee has a verifiable history of wasteful spending and exorbitantly high compensation compared to his peers.
Not only has Gee's antics wasted tens of millions of dollars in spending … he's also responsible for the deaths of 29 West Virginian coal miners.
2. West Virginia has turned its back on higher education broadly, the humanities specifically.
Feasibility: 2/5 Explanatory power: 1/5
West Virginia University is no longer interested in educating young people to meaningfully participate in a global community. As usual, students will pay for the parochialism and greed of a bloated administration that feeds itself while starving them. https://t.co/MokyosmuY0
Now, before you get ahead of me, I am not saying that the current political climate, obsessions with “woke” professors, and the broad anti-science/scholarship platform of a chunk of the US conservative movement isn’t making this an easier sell to the state legislature. What I am saying is that the $45m budget shortfall is real and graduate programs are often sneaky expensive. Masters programs are generally expected to be revenue positive for a department, and for many schools were often quite lucrative (at least, they were before the demand from foreign students was cut off). If a MA/MS/MFA program is getting cut during a budget crisis, you can be extra sure that program is losing money. Put another way, the universitycan’t afford to cut any profitable program right now, no matter how much its political gestalt might annoy certain power players. Placed in this context, I am surprised to see the Public Administration department on the chopping block. Those are often fairly popular and profitable masters programs. To be fair, I was originially the most surprised to see the MFA in Creative Writing program was being eliminated. It has a good reputation, such programs are usually relatively low cost to operate, and often can bring in a lot tuition money from students looking for a “consumption” degree. Then I saw that 100% of their MFA students received a full tuition waiver and $16,500 stipend. For that to work when your university is underwater you need those MFA students to teach a lot of undergraduate composition courses, and even then that leaves you with an English Department faculty hardpressed to justify their own numbers.
3. A $45 million shortfall meant WVU couldn’t put off the future another year
Feasibility: 5/5 Explanatory power: 3/5
This is the converstion we’re all actually having, regardless of the various competing framings. There are departments struggling on every campus. Humanities majors in decline, STEM majors in ascendance. For every Arts & Sciences faculty meeting that turned into a “why are their salaries higher than ours/because there is greater demand for our services outside of academia” food fight, there is now an actual existential question on the table, which means this just got real.
Real-er than you might think. Covid exposed the Return-On-Investment fragility of a lot of high priced private colleges, but <raised-eyebrows sotto voce> made your in-state public university look pret-ty good by comparison. Inflation? Inflation is often a boon to universities looking to cut costs because it offers the prospect of a meaningful haircut to the salaries of every member of your tenured faculty, but only if the state legislature plays along and lets you raise tuition in accordance with inflation. The fact that the flagship public university of a state is staring this down at exactly the moment when things are set up for state schools to succeed is perhaps the darkest harbinger of them all.
4. Maybe this is just a West Virginia problem
Feasibility: 5/5 Explanatory power: 4/5
West Virginia’s population shrank 3.2% from 2010 to 2020. The university’s enrollment has shrunk 10% since 2005. It’s hard enough to shrink any public institution’s workforce, let alone one with a tenure system for a sizable portion of it’s employees. Maybe none of this is that complicated. Shrinking populations are hard for government institutions to manage. Politically costly decisions get put off until the lights might actually go out. Choices do eventually get made, however, and when they do, they tend to be drastic.
5. All of the above
Feasibility: 5/5 Explanatory power: 5/5
That’s the best part of this gimmick. It implies I’ve explained the entire West Virginia University dilemma without ever actually committing my reputation to a single excerptable sentence. Come to think of it, I should use this format more often.
Where is my 600 words on the Barbie movie? I’m trying to get ready for the Fall semester, which includes two classes that I have never taught before. In the university slang, that would be “two new preps.” There is someone out there living my dream of dropping hot current cultural takes on schedule. I’m going to direct you over to Maia Mindel. Along with Adam Minter, she is someone I would love to meet.
For more economics of Barbie, Jeremy wrote “Barbie Dolls and Women’s Wages“. “… the gains for women in the labor market since the introduction of Barbie are large and worth celebrating.”
For more on film, I did list some thoughts and links for Oppenheimer.
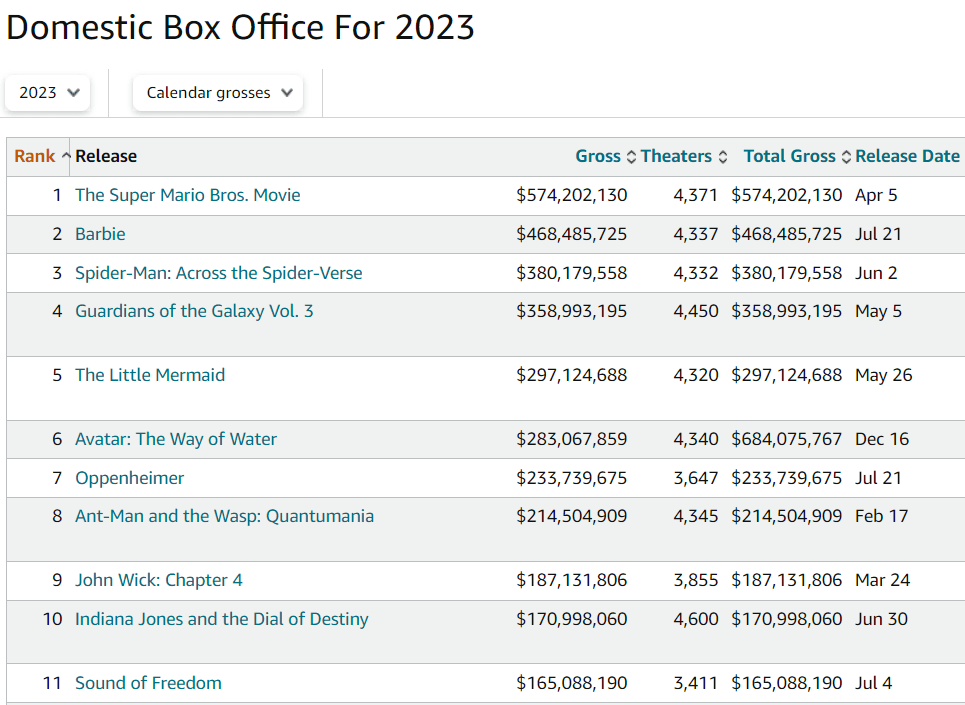
Here is the Box Office Mojo report on 2023 American theater sales, as of August 2023. In less than a month, Barbie reached #2! And Oppenheimer is doing well for a serious historical movie.
I want to share some changes that I’ll make to my game theory course, just for the record. It’s an intense course for students. They complete homeworks, midterm exams, they present scholarly articles to the class, and they write and present a term paper that includes many parts. Students have the potential to learn a huge amount, including those more intangible communication skills for which firms pine.
There is a great deal of freedom in the course. Students model circumstances that they choose for the homeworks, and they write the paper on a topic that they choose. The 2nd half of the course is mathematically intensive. When I’ve got a great batch of students, they achieve amazing things. They build models, they ask questions, they work together. BUT, when the students are academically below average, the course much less fun (for them and me). We spend way more time on math and way less time on the theory and why the math works or on the applicable circumstances. All of that time spent and they still can’t perform on the mathematical assignments. To boot, their analytical production suffers because of all that low marginal product time invested in math. It’s a frustrating experience for them, for me, and for the students who are capable of more.
This year, I’m making a few changes that I want to share.
Minimal Understanding Quizzes: All students must complete a weekly quiz for no credit and earn beyond a threshold score in order to proceed to the homework and exams. I’m hoping to stop the coasters from getting ‘too far’ in the course without getting the basics down well enough. The quizzes must strike the balance of being hard enough that students must know the content, and easy enough that they don’t resent the requirement.
Inpatient costs were 27% higher (95% CI 0.252, 0.285), but length of stay was 12% shorter (95% CI −0.131, −0.100), in Comprehensive Cancer Centers relative to community hospitals.
In other words, these cutting-edge hospitals that tend to treat complex cases are more expensive, as you would expect; but despite getting tough cases they actually manage a shorter average length of stay. We can’t nail down the mechanism for this but our guess is that they simply provide higher-quality care and make fewer errors, which lets people get well faster.
The NCI Cancer Centers Program was created as part of the National Cancer Act of 1971 and is one of the anchors of the nation’s cancer research effort. Through this program, NCI recognizes centers around the country that meet rigorous standards for transdisciplinary, state-of-the-art research focused on developing new and better approaches to preventing, diagnosing, and treating cancer.
Our paper focuses on New York state because of their excellent data, the New York State Statewide Planning and Research Cooperative System Hospital Inpatient Discharges dataset, which lets us track essentially all hospital patients in the state:
We use data on patient demographics, total treatment costs, and lengths of stay for patients discharged from New York hospitals with cancer-related diagnoses between 2017 and 2019.
You know I’m all about sharing data; you can find our data and code for the paper on my OSF page here.
My coauthor on this paper is Ryan Fodero, who wrote the initial draft of this paper in my Economics Senior Capstone class last Fall. He is deservedly first author- he had the idea, found the data, and wrote the first draft; I just offered comments, cleaned things up for publication, and dealt with the journal. I’ve published with undergraduates several times before but this is the first time I’ve seen one of my undergrads hit anything close to a top field journal. You can find a profile of Ryan here; I suspect it won’t be the last you hear of him.
I was reading “The Ultimate Guide to Barbie” the other day, and I noticed an interesting piece of data towards the end of the magazine: the original Barbie doll in 1959 retailed for $3. Today, according to the magazine, a Barbie costs around $14-19. And they further told us that adjusted for inflation, that $3 original Barbie is about $24 today.
I’m not sure exactly where they got that number. Using the BLS CPI tool, it’s more like $31.50. And while I appreciate the attempt to give us historical context, I think for the typical reader will still be a bit perplexed. What does it mean to say $3 in 1959 is equal to $24 (or $31.50) today? Well, it means that the price of Barbie dolls has risen more slowly than other goods and services (quality adjusted). But I think we can do better on the context.
Here’s my best attempt to give context:
The chart shows the number of minutes of work that the median woman would need to work to purchase a Barbie doll for her daughter. In 1959, it took almost 2 hours of work. Today, it takes only about a half hour (I’m using the lower range from the magazine, $14 for a Barbie today, although there are plenty of $10-11 Barbies on Amazon).
Another way of thinking about it: with the same amount of work, a working mother today could buy her daughter 3-4 times as many Barbies as her counterpart in 1959.
I deliberately used median female wages here to make another historical comparison. Women’s earnings have increased much more than men’s since 1959. Back then, median female earnings for full-time, year round workers was only 61% of male earnings. Today, it is close to 85%. True, that’s still not parity. And for those that know the history, you will also know that the closing of that gap has stagnated in recent years. But this is still some major progress during the Barbie Era.
Finally, as I have emphasized before, looking too much at the cost of one product over time has limits. What about other goods and services? A toy, even a well-known brand like Barbie, is a tradable good that can be manufactured anywhere in the world (it looks like Indonesia is where many Barbies are made today). So it wouldn’t be surprising that it has got cheaper over time. But what about all goods and services?
Here’s where inflation adjustments are most useful. Not for individual goods and services, but for looking at incomes over time. How much stuff can a given income purchase compared to the past? That’s what inflation adjustments are for. And this chart shows male and female median earnings in 1959 and 2023, with the 1959 figures adjusted to 2023 dollars using the PCE price index.
When we adjust for changes in all prices, not just Barbies, we can see that median female earnings have roughly doubled between 1959 and 2023. That’s not quite as robust as the “Barbie standard of living,” which allows you to purchase 3-4 times as many dolls. But 2 times as much stuff is pretty good. It’s especially good when compared with male earnings growth, which grew about 44 percent.
It should be obvious here that these are just the raw medians, not controlling for anything like education, experience, or occupational choice. Controlling for those will shrink the gap a bit more. But the gains for women in the labor market since the introduction of Barbie are large and worth celebrating.
A stopped clock is occasionally right. And so are perma-bears, those commentators or analysts who continually predict that GDP and stocks will plunge – perhaps in the next quarter, but more often say six months from now. (And that deadline keeps getting pushed back every six months).
When I was first getting started investing, I was overly influenced by these seemingly cautious and sober souls, and I consequently lost out considerably compared to my colleagues who blithely stayed fully invested. So I hold my native pessimism in check when investing, and stay mainly in the market, but with a little cash in reserve just in case The Big One hits.
All that said, I do try to sample various points of view. If I have been mainly seeing positive chatter, I turn to my favorite perma-bear, an analyst named Jeffrey Snider. His YouTube channel is called Eurodollar University, and he runs a subscription service as well.
Jeff seems like a genuinely nice guy, who believes that his dire readings of the macroeconomic tea leaves are helping folks avoid disaster. His demeanor is more like an earnest teacher, not a huckster trying to sell something. I should add that he offers meaningful insights on the Eurodollar scene, which is globally significant and which most analysts do not understand or even recognize.
But Jeff’s bias is nearly always toward the negative, and it is something of a good-natured joke among his viewers. Typical comments: “ The market can remain irrational longer than Jeff can stay pessimistic” and “Jeff is the best on Youtube. I watch his videos every night right before I go to bed. In less than 5 minutes, I’m in a semi-conscious coma. Its better than any sleeping pill. That smooth soothing voice extoling the virtues of a collapsing economy works wonders. A++”.
Well, what is the bear-meister saying now? He claims that the seemingly red-hot employment numbers that have been reported in recent months are less hot than they appear. I will paste in a few snips from his recent YouTube, It Just Happened…The JOB MARKET JUST BROKE!! .
One point he makes is that there has been a persistent, inaccurate bias to the upside in the payroll numbers reported by the BLS. These big numbers are what gets reported; what does not get reported so much is, month after month, these monster payroll increases are quietly revised downwards, often by substantial amounts:
Even with the adjustments, these still seem like large increases in employment. Undaunted, Jeff pokes holes in the hot labor market scenario by claiming that full time employment is actually stagnant; it is the rise in part-time workers that creates the seemingly large army of the newly employed. The fact that total hours worked has plateaued seems to support his case here:
Another factor is worker hoarding. Employers were so burned trying to scramble for workers during the 2022 reopening-from-Covid that they are keeping their workers on payroll (even part-time), just in case the economy picks up and they need to pull them in full-time. A case in point is manufacturing. New orders are down considerably this year, and headed even lower, yet manufacturers have not cut their workforces appreciably:
If orders stay low for a long enough time, however, the manufacturers will have no choice but to start massive layoffs.
As another indicator of labor market softness, temporary workers may be a leading indicator of employment trends. They are not such a core part of a company, so there is less hoarding of them. And temporary help services have been in a steady decline this year, which is consistent with a cooler economy:
Sell Everything??
As I said, it is worth considering all sides. I think the specific points mentioned above are all valid ones. I would add that if students actually start payments on all those loans which taxpayers and the Fed have subsidized for the past three years, that will finally put a crimp in the spending. Also, the surprise downgrade of U.S. federal debt by the Fitch rating agency , and resulting jump in interest rates, has finally gotten people talking about out-of-control government spending, for one week anyway. Also, the great China-reopening that was supposed to jump-start the global economy seems to be pretty flat.
However, a couple of counter-points to the bearish narrative:
First, even if manufacturing is rolling over, in the U.S. it is fairly small relative to services. At least in some geographical areas, my anecdotal reports say that it is still a challenge to get good workers to do services.
Second, the tidal wave of cash from pandemic giveaways that washed into our collective bank accounts is still not depleted. Consumer confidence is high, and we are spending freely. This economy is a big, big ship, and it is still steaming full ahead, brushing aside high interest rates and yield curve inversions. The recession seems to continually recede. There will inevitably be a downturn someday, of course, but absent some geopolitical event, I think it may take some time for it to arrive.
And finally, even if the long-awaited recession does arrive, it may not necessarily be so bad for stocks. Since the 2008-2009 Great Financial Crisis, the Fed has taken a very active role in supporting the markets. Wall Street has been conditioned to expect the Fed to flood the system with money if a serious downturn occurs. Also, the Street is betting that there will be enough howls of pain over the high interest being paid on the federal debt that unbearable pressure will be brought on the Fed to loosen up; the vaunted independence of that institution will be put to the test, with Congressional threats to alter their charter if they don’t cave to pressure. And so, “[economic] bad news is [investing] good news”, in contrast to the pre-2008 world. Furthermore, federal deficit spending ramps up during recessions, and as noted in The Kalecki Profit Equation: Why Government Deficit Spending (Typically) MUST Boost Corporate Earnings , this deficit spending tends to boost earnings.
And so even if Jeff Snider is correct that the economy is rolling over and will soon slide downward, this may not give investors a very useful signal. As another one of his YouTube viewers has commented, “This channel is a masterclass in learning that knowledge about the macro environment does not provide an edge in markets.”
There are things that you can, on some level, know are true but not fully internalize until you re-experience that truth multiple times. We all know that there is a seemingly unending supply of free and paid educational instruction available on the internet, from the broadest mathematical pedagogy to instructions for replacing a single grommet on a specific appliance make and model. We are awash in content, much of it explicitly designed to aid in our self-guided educational journeys. You and I already know this, but every few years I feel like I re-live a moment of awe at what is costlessly or near-costlessly made available to anyone with an internet connection.
As you probably know, I am an economist and a sports junkie. In both my professional and sports endeavors, I tend to dabble in scattered interests until I get narrowly obsessed with something. Sometimes this takes the form of a 5 year research project, other times it means I become a hockey goalie for 15 years. For both hockey and most of the technical aspects of my economic research, I am almost exclusively “self-taught”, though I’m not sure that is all that unusual anymore. Woe be unto the applied economist who thinks an afternoon’s cap-and-gown affair means they are done struggling to learn new econometrics.
The corridor of athletic activity available to me has narrowed with injury and age, so like many before me I have turned to golf. At first reluctantly, I’ll admit, but now I am fully on board. I’ve constrained my financial investment, using (until very recently) entirely used equipment, found balls, and opting for less expensive courses. As I’ve progressed, what has once again shocked me is not just how easy it is to acquire instruction, but the incredible nuance and narrowness of that instruction. If something isn’t working for me, I can simply describe the problem I am experiencing into google and a dozen videos diagnosing and remedying the problem will instantly appear. If I want to understand the biomechanics or even physics behind my swing to build intuition, I can watch 100s of hours of videos. If I want advice geared towards players with similar personal characteristics, habits, or preferences, it all appears before me. It is not without exaggeration to suggest that I am receiving better instruction as a 46-year old amateur with one good knee than all but the absolutely most privleged in the world would have received 30 years ago.
This is all the more important when placed in the context of the rising cost of personal instruction. The price of passive instruction may be rapidly approaching zero, but that doesn’t insulate active instruction from Baumol’s cost disease. The cost of having someone’s time all to your self has never been higher, which means if you want your instruction curated, the regulatory device of interpersonal obligation and sunk costs, or simply an upscale babysitter that lets you feel like a good parent while you scroll your phone for an hour, you’re going to pay more than ever.
The only downside to being able to costlessly access our near-infinite Library of Alexandria, if there must be one, is the guilt I feel as I steadily improve. Every increment of improvement is evidence that I chose to get better at golf instead every other dimension of my professional and private self. The double-edged sword of opportunity cost haunts me, reminding me that everything I learn comes at the expense of what I chose not to learn. I could have learned about the China Trade Shock, the latest reason why every identification strategy ever employed in an economics paper is wrong, Mandarin, or how to cook rissotto for my wife.
But I chose golf. There’s probably insight into myself to be be had there, but some lessons are best left unlearned.