Bar codes have been common in retail stores since the 1970s. These give a one-dimensional read of digital data. The hardware and software to decode a bar code are relatively simple.
The QR code encodes information in a two-dimensional matrix. The QR code, short for quick-response code, was invented in 1994 by Masahiro Hara of the Japanese company Denso Wave for labelling automobile parts. It can pack far more information in the same real estate than a bar code, but it requires sophisticated image processing to decode it. Fortunately, the chip power for image processing has kept up, so smart phones can decode even intricate QR codes, provided the image is clear enough.
Here is the QR code that encodes the URL for Wikipedia, i.e., the characters: “https://en.wikipedia.org/wiki/Wikipedia”.

Like most QR codes, it has three distinctive square patterns on three corners, and a smaller one set in from the fourth corner, that give information to the image processing software on image orientation and sizing.
As time goes on, more versions of QR codes are defined, with ever finer patterns that convey more information. For instance, here is a medium-resolution QR Code (version 3), and a very high resolution QR code (Version 40):

Version 3 QR Code (29×29), encodes up to 50 characters
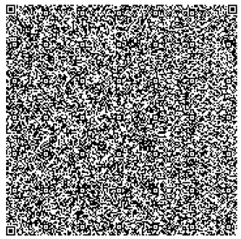
Version 40 QR Code (177×177), encodes up to 1852 characters
My phone could not decode the Version 40 above; the limit may be how much detail the camera could capture.
QR codes use the Reed–Solomon error correction methodology to correct for some errors in image capture or physical damage to the QR code. For instance, this QR code with the torn-off corner still decodes properly as the URL for Wikipedia (whole image shown above):
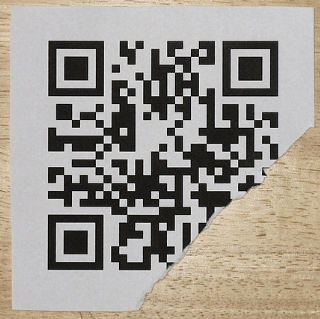
Torn QR Code still decodes properly.
Getting down a little deeper in the weeds, this image shows, for Version 3 (29×29) QR code, which pixels are devoted to orientation/alignment (reddish, pinkish), which define the format (blueish), and which encode the actual content (black and white):

Uses Of QR Codes
A common use of QR codes is to convey a web link (URL), so pointing your phone at the QR code is the equivalent of clicking on a link in an email. Here is an AI summary of uses:
They are used to access websites and digital content, such as restaurant menus, product information, and course details, enabling a contactless experience that reduces the need for printed materials. Smartphones can scan QR codes to connect to Wi-Fi networks by automatically entering the network name (SSID), password, and encryption type, simplifying the process for users. They facilitate digital payments by allowing users to send or receive money through payment apps by scanning a code, eliminating the need for physical cash or cards. QR codes are also used to share contact information, such as vCards, and to initiate calls, send text messages, or compose emails by pre-filling the recipient and message content. For app downloads, QR codes can directly link to the Apple App Store or Google Play, streamlining the installation process. In social media and networking, they allow users to quickly follow profiles on platforms like LinkedIn, Instagram, or Snapchat by scanning a code. They are also used for account authentication, such as logging into services like WhatsApp, Telegram, or WeChat on desktop by scanning a code with a mobile app. Additionally, QR codes are employed in marketing, event ticketing, and even on gravestones to provide digital access to obituaries or personal stories. Their versatility extends to sharing files like PDFs, enabling users to download documents by scanning a code. Overall, QR codes act as a bridge between the physical and digital worlds, enhancing efficiency and interactivity across numerous daily activities.
Note that your final statement in this world might be a QR code on your gravestone.
Security with QR Codes
On an iPhone, if “Scan QR Codes” (or something similar) has been enabled, pointing the phone at a QR code in Camera mode will display the first few characters of the URL or whatever, which gives you the opportunity to click on it right then. If you want to be a bit more cautious, you can take a photo, and then open Photos to look at the image of QR code. If you then press on the photo of the QR code, up will come a box with the entire character string encoded by the QR code. You can then decide if clicking on something ending in .ru is what you really want to do.
Accessing a rogue website can obviously hurt you. And even if you aren’t dinged by that kind of browser exploit, the reader’s permissions on your phone may allow use of your camera, read/write contact data, GPS location, read browser history, and even global system changes. The bad guys never sleep. Who would have thought that a QR code on a parking meter posing as a quick payment option could empty your bank account? Our ancestors needed to stay alert to physical dangers, for us it is now virtual threats.
ACKNOWLEDGEMENT: The bulk of the content, and all the images, in this blog post were drawn from the excellent Wikipedia article “QR code”.


#/media/File:RMS_Republic.jpg)