In September we covered the release of the Fraser Institute’s 2025 Economic Freedom of the World report. I said then:
The authors are doing great work and releasing it for free, so no complaints, but two additional things I’d like to see from them are a graphic showing which countries had the biggest changes in economic freedom since last year, and links to the underlying program used to create the above graphs so that readers could hover over each dot to identify the country
Well, now Matthew Mitchell of the Fraser Institute has done that:
I can only post a screenshot of a scatterplot here, but if you click through to the Fraser report you can hover over any dot to see which country it represents:
My new article, “Prohibition and Percolation: The Roaring Success of Coffee During US Alcohol Prohibition”, is now published in Southern Economic Journal. It’s the first statistical analysis of coffee imports and salience during prohibition. Other authors had speculated that coffee substituted alcohol after the 18th amendment, but I did the work of running the stats, creating indices, and checking for robustness.
My contributions include:
National and state indices for coffee and coffee shops from major and local newspapers.
A textual index of the same from book mentions.
I uncover that prohibition is when modern coffee shops became popular.
The surge in coffee imports was likely not related to trade policy or the end of World War I
Both demand for coffee and supply increased as part of an intentional industry effort to replace alcohol and saloons.
An easy to follow application of time series structural break tests.
An easy to follow application of a modern differences in differences method for state dry laws and coffee newspaper mentions.
Evidence from a variety of sources including patents, newspapers, trade data, Ngrams, naval conflicts, & Wholesale prices.
Generally, the empirical evidence and the main theory is straightforward. I learned several new empirical methods for this paper and the economic logic in the robustness section was a blast to puzzle-out. Finally, it was an easy article to be excited about since people are generally passionate about their coffee.
Bartsch, Zachary. 2025. “Prohibition and Percolation: The Roaring Success of Coffee During US Alcohol Prohibition.” Southern Economic Journal, ahead of print, September 22. https://doi.org/10.1002/soej.12794.
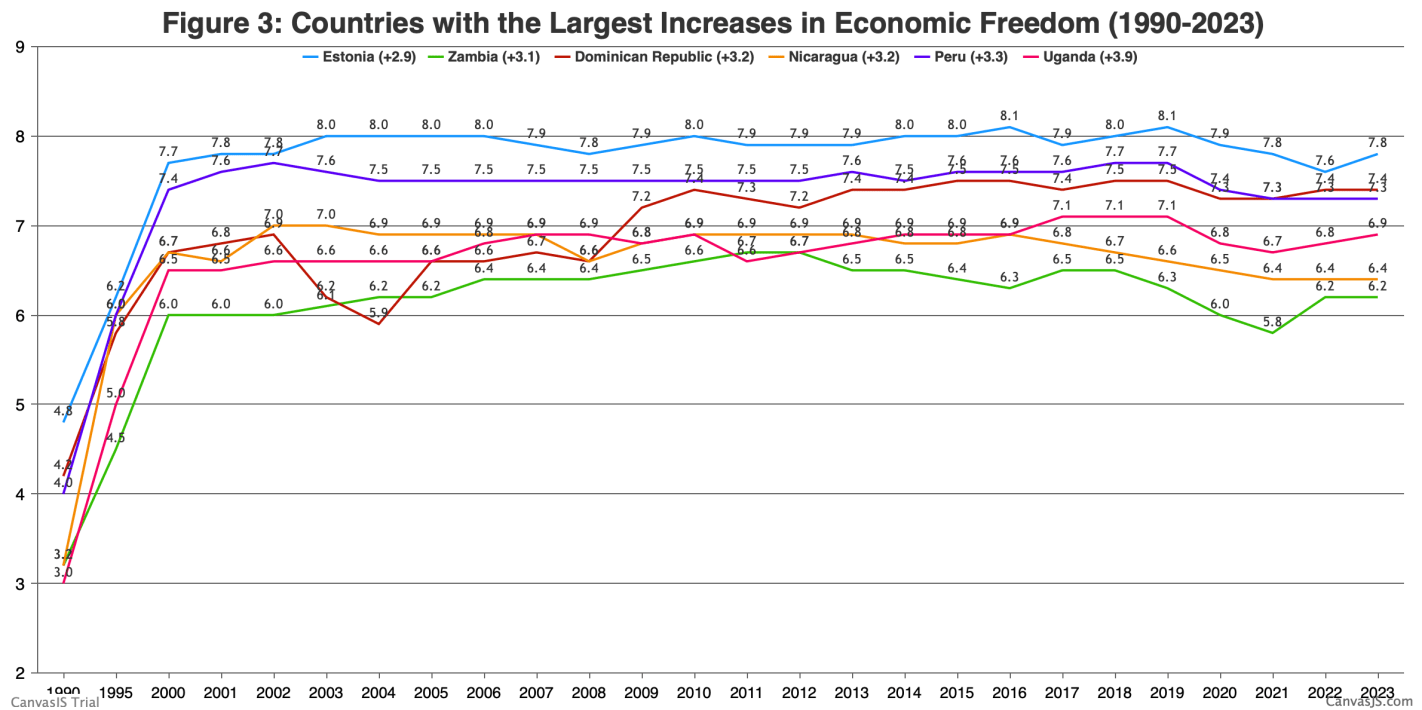
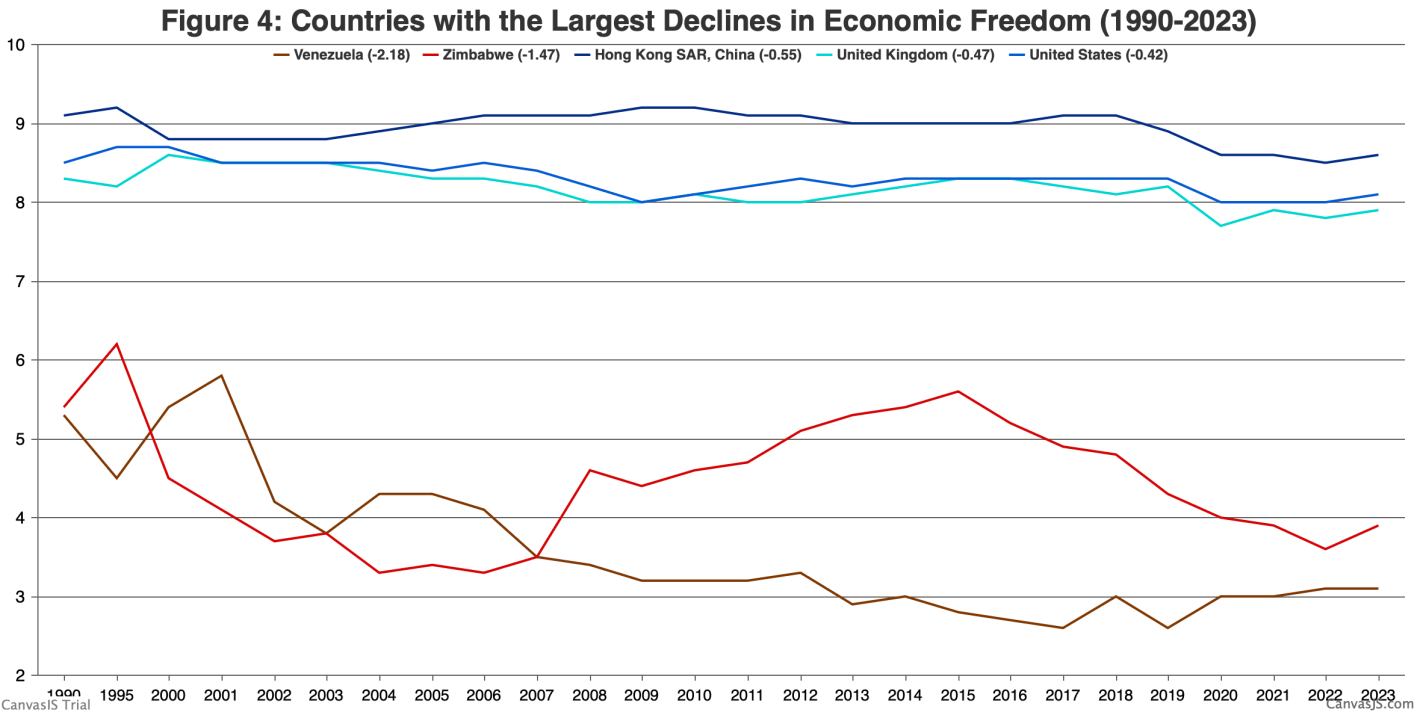
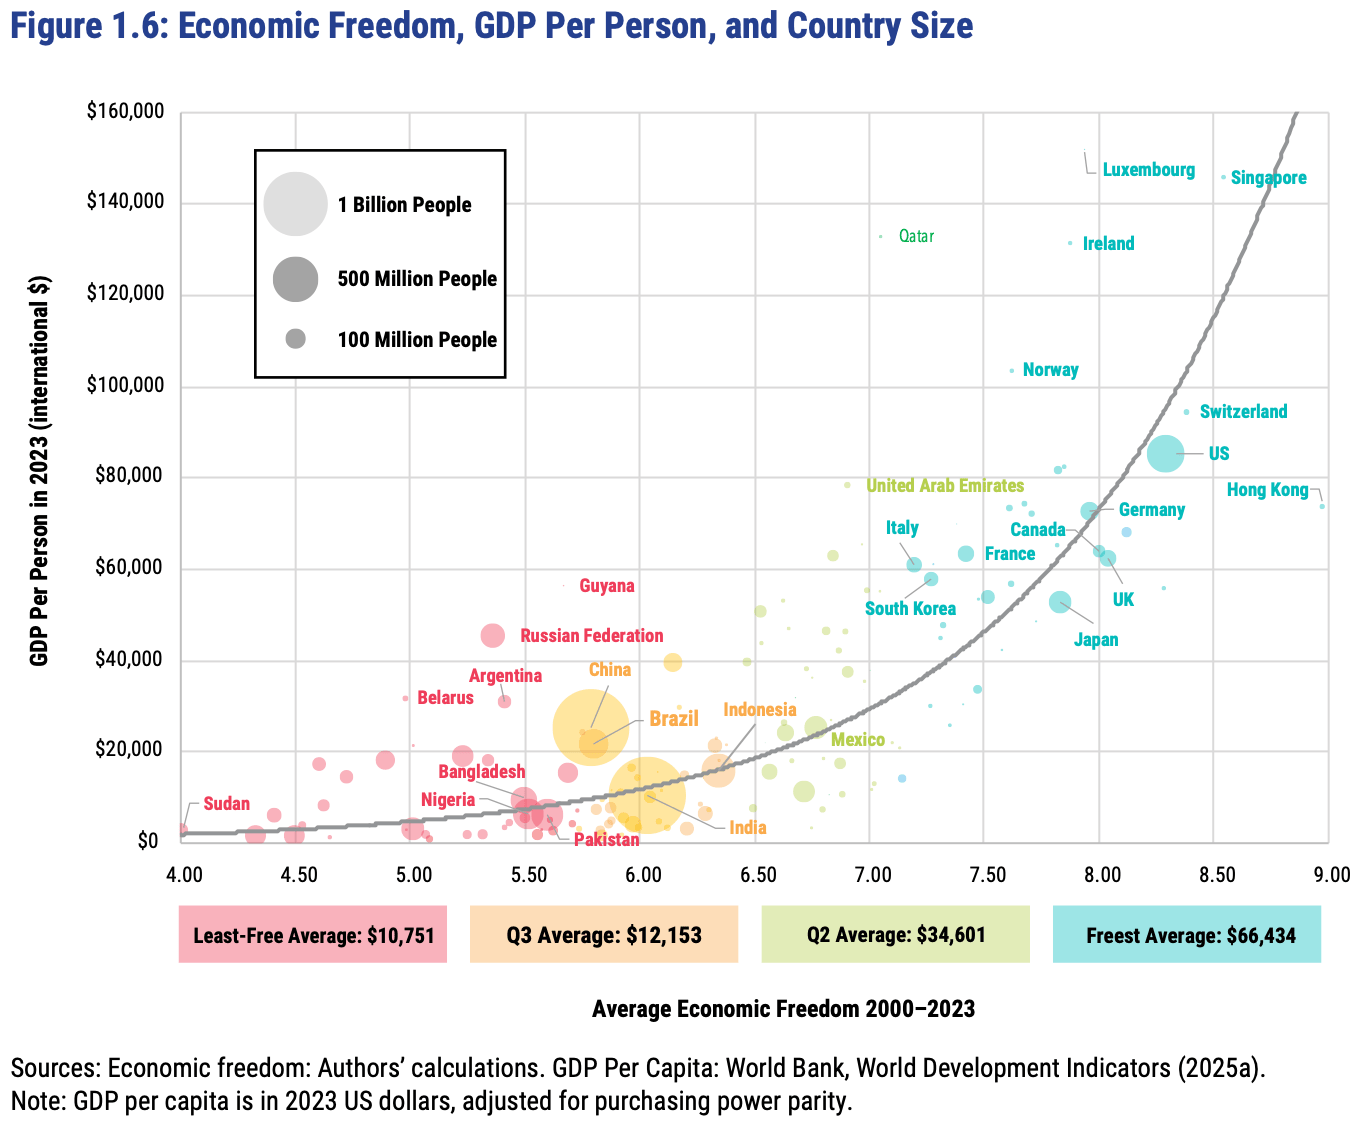
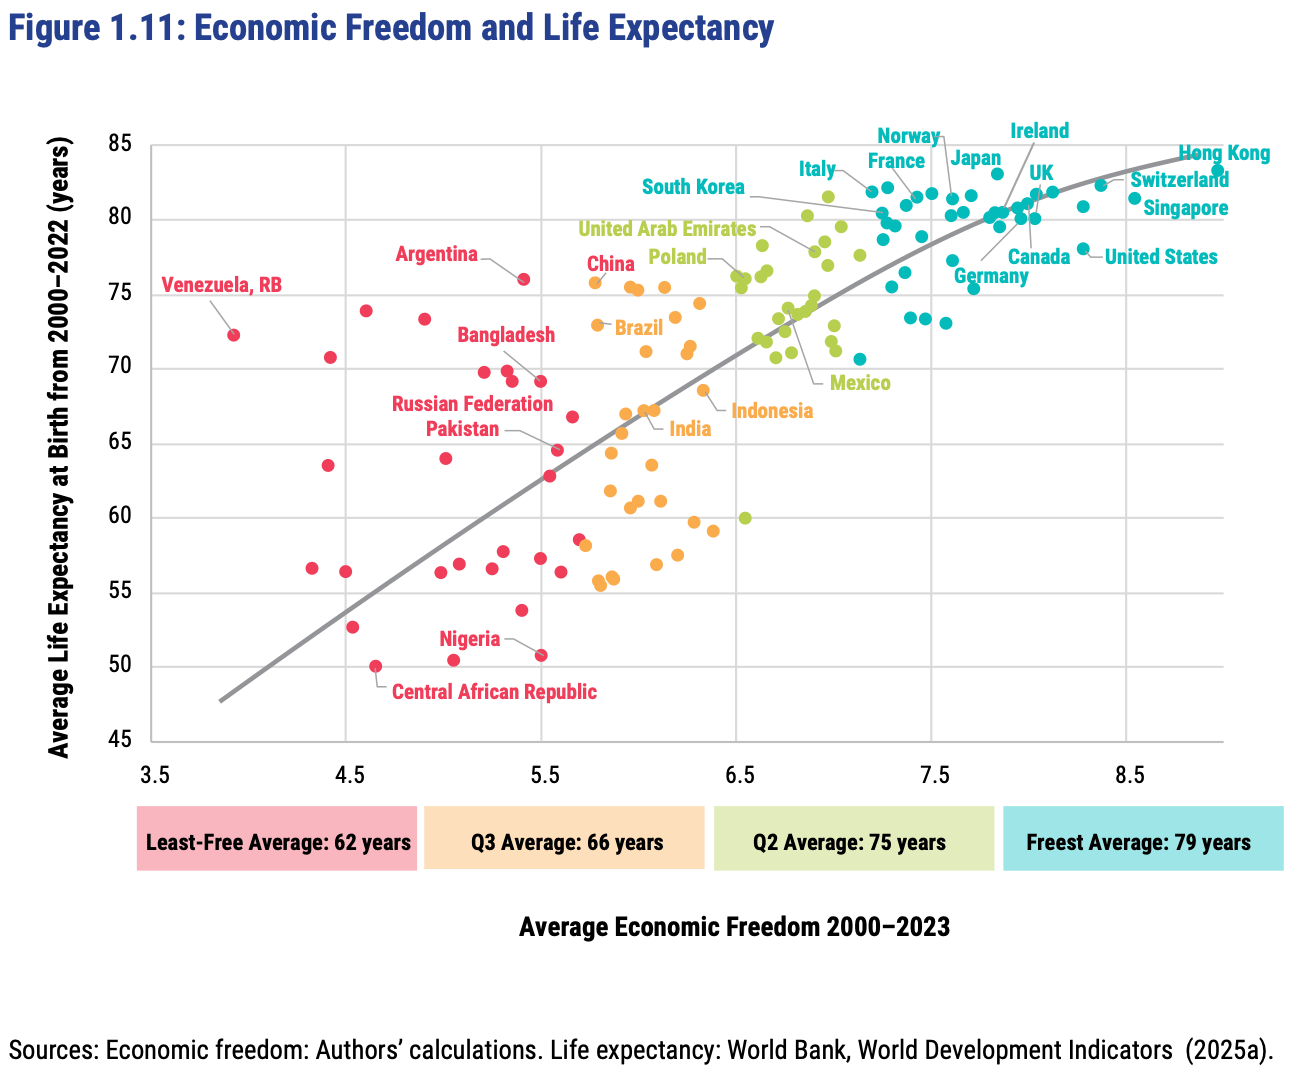
The Fraser Institute released their latest report on the Economic Freedom of the World today, measuring economic policy in all countries as of 2023. They made this excellent Rosling-style graphic that sums up their data along with why it matters:
In short: almost every country with high economic freedom gets rich, and every country that gets rich either has high economic freedom or tons of oil. This rising tide of prosperity lifts all boats:
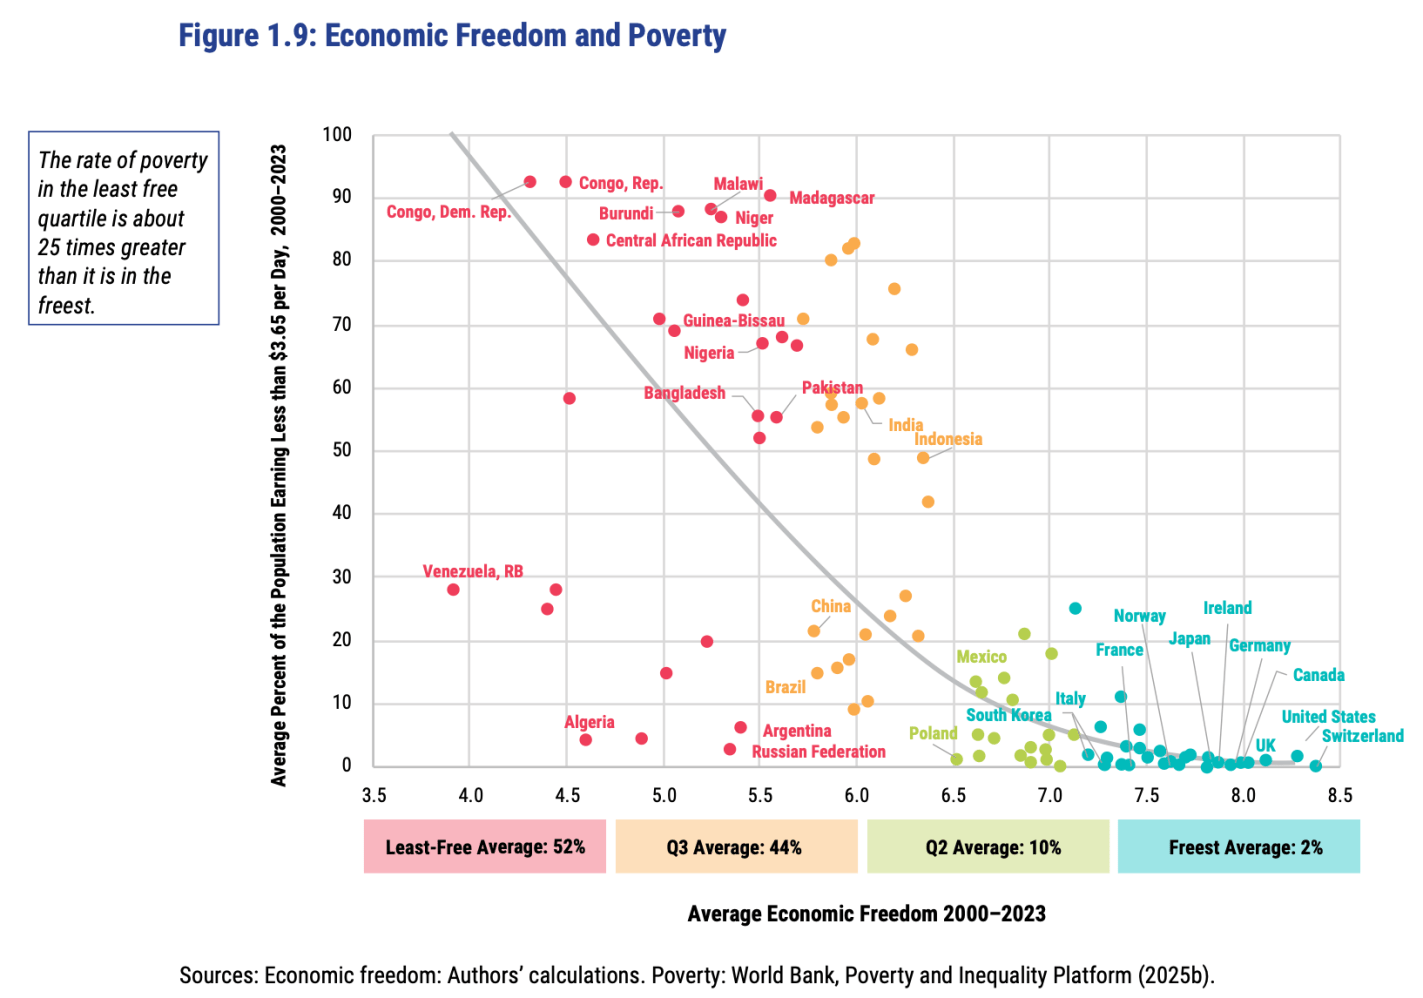
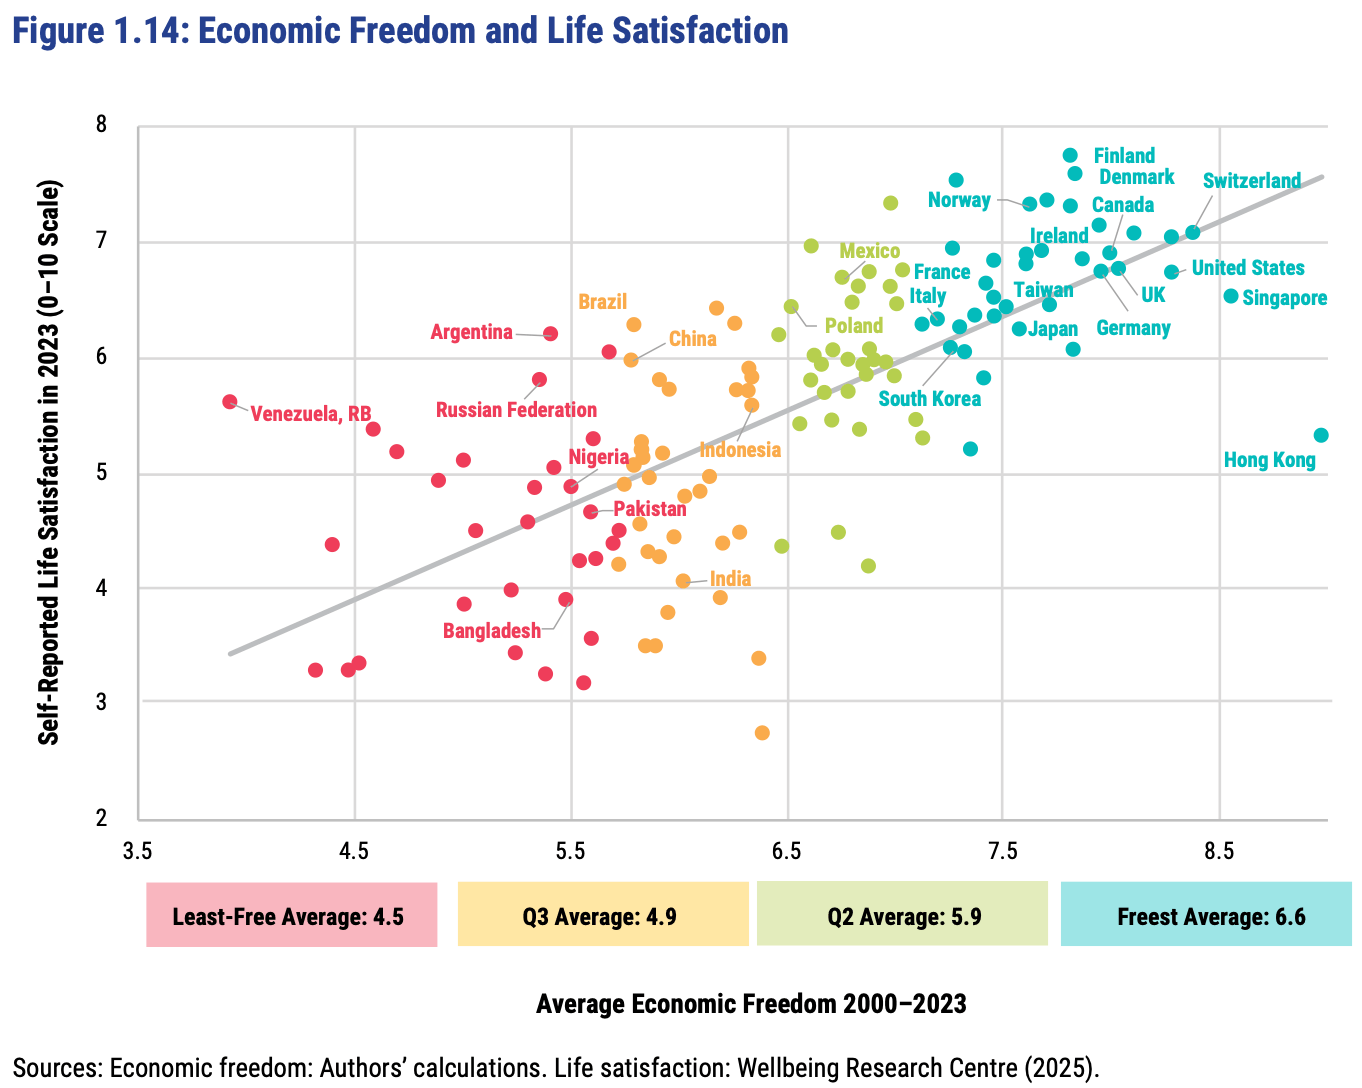
This greater prosperity that comes with economic freedom goes well beyond “just having more stuff”:
The full report, along with the underlying data going back to 1970, is here. The authors are doing great work and releasing it for free, so no complaints, but two additional things I’d like to see from them are a graphic showing which countries had the biggest changes in economic freedom since last year, and links to the underlying program used to create the above graphs so that readers could hover over each dot to identify the country (I suppose an independent blogger could do the first thing as easily as they could…).
FRDM is an ETF that invests in emerging markets with high economic freedom (I hold some), I imagine they will be rebalancing following the new report.
The Fed has had an official inflation target of 2% since 2012, a commitment they reaffirmed just last month after their policy review:
The Committee reaffirms its judgment that inflation at the rate of 2 percent, as measured by the annual change in the price index for personal consumption expenditures, is most consistent over the longer run with the Federal Reserve’s statutory maximum employment and price stability mandates.
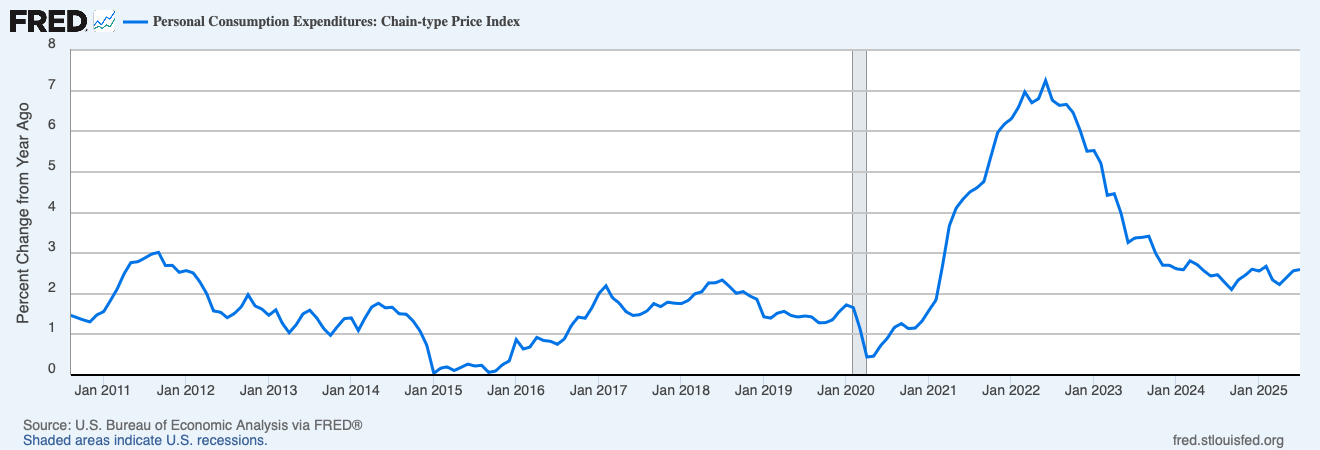
But since 2020, they haven’t been acting like it. Lets look at their preferred measure of inflation, the annual change in the PCE price index:
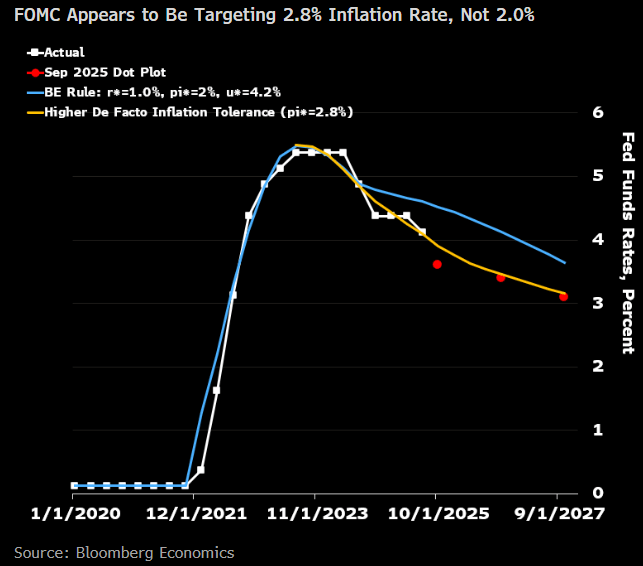
The last time annual inflation was at or below 2.0% was February 2021. The Fed just cut rates despite inflation being at 2.6%. If you didn’t know about their 2% target and were trying to infer their target based solely on their actions, what would you guess their target is?
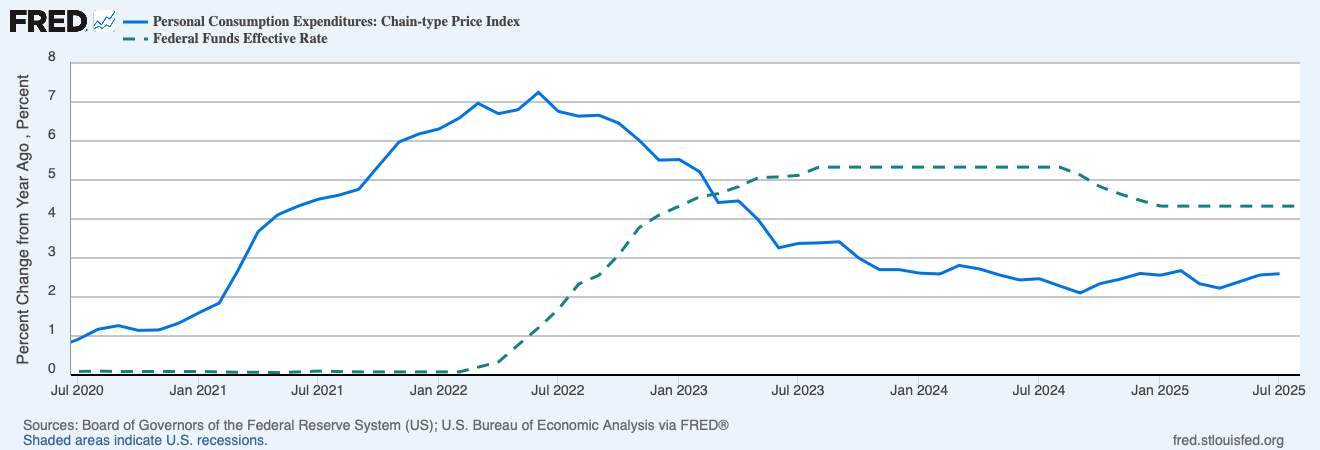
Considering the post-Covid period, I see their actions as being more consistent with a 3% target than a 2% target. They stopped raising rates once inflation got below 3.4%, and started cutting them again once inflation got below 2.4%. The Fed’s own projections show more rate cuts coming despite the fact that they don’t expect inflation to get back to 2.0% until 2028! Bloomberg’s Anna Wong does the math and infers their target is 2.8%:
Perhaps the Fed’s target should be higher than 2%, but if they have a higher target, they should make it explicit so as not to undermine their credibility. Or at least make explicit that their target is loose and they’d rather miss high than low, if that is in fact the case. This is what Greg Mankiw would prefer:
I feel strongly that a target of 2 percent is superior to a target of 2.0 percent….. It would be better if central bankers admitted to the public how imprecise their ability to control inflation is. They should not be concerned if the inflation rate falls to 1.6. That comfortably rounds up to 2. And they should be ready to declare victory in fighting inflation when the inflation rate gets back to 2.5. As the adage goes, that is good enough for government work. Maybe the Fed should even ditch a specific numerical target for inflation and instead offer a range, as some other central banks do. The Fed could say, for example, that it wants to keep the inflation rate between 1 and 3. Doing so would admit that the Fed governors are notquite as godlike as they sometimes feign.
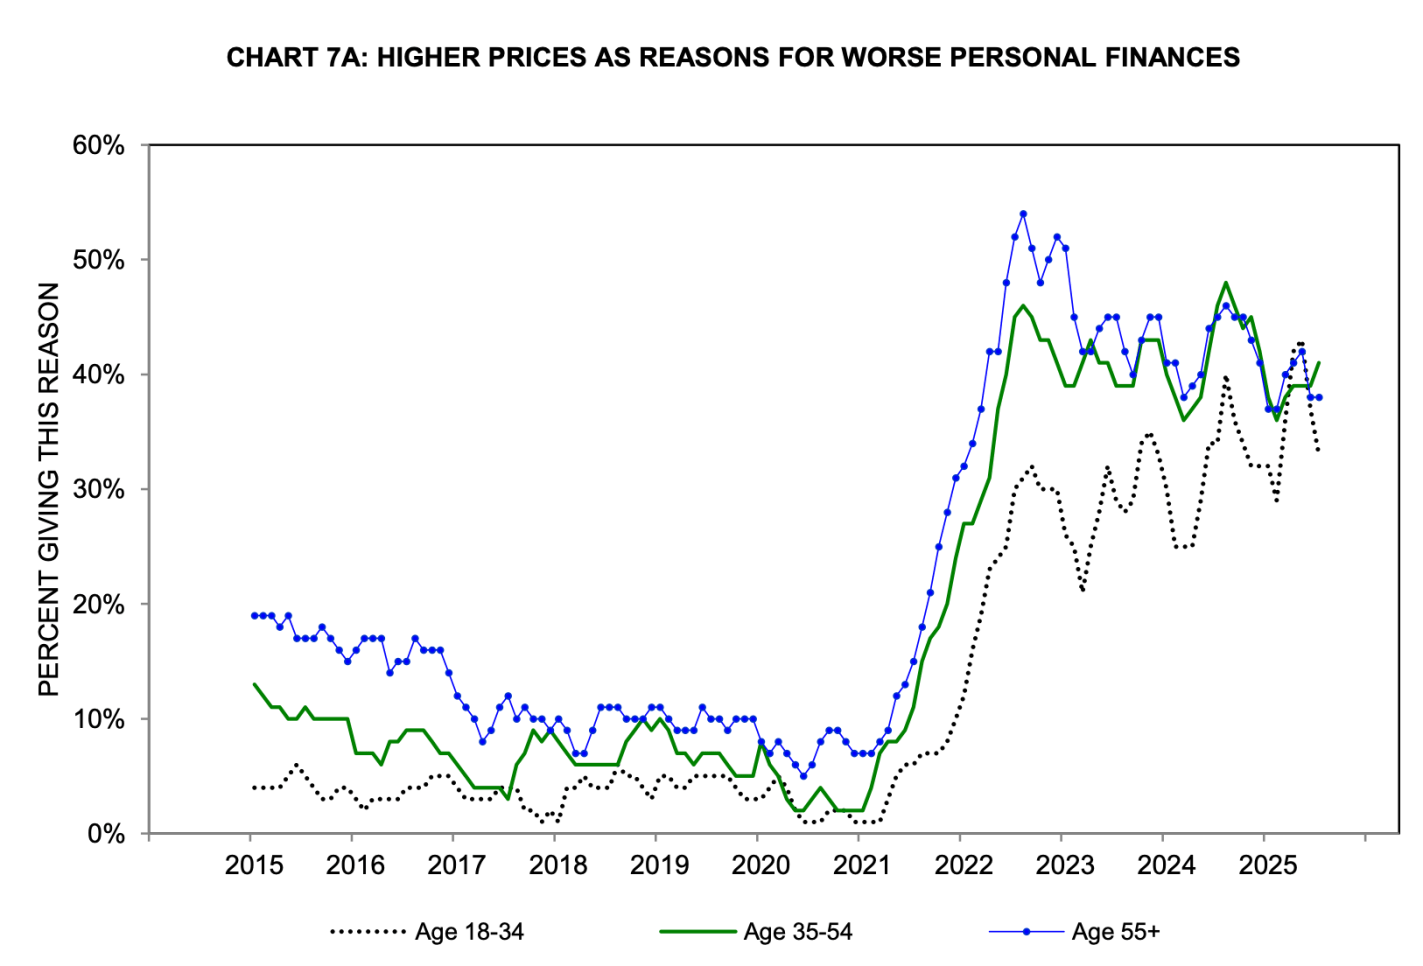
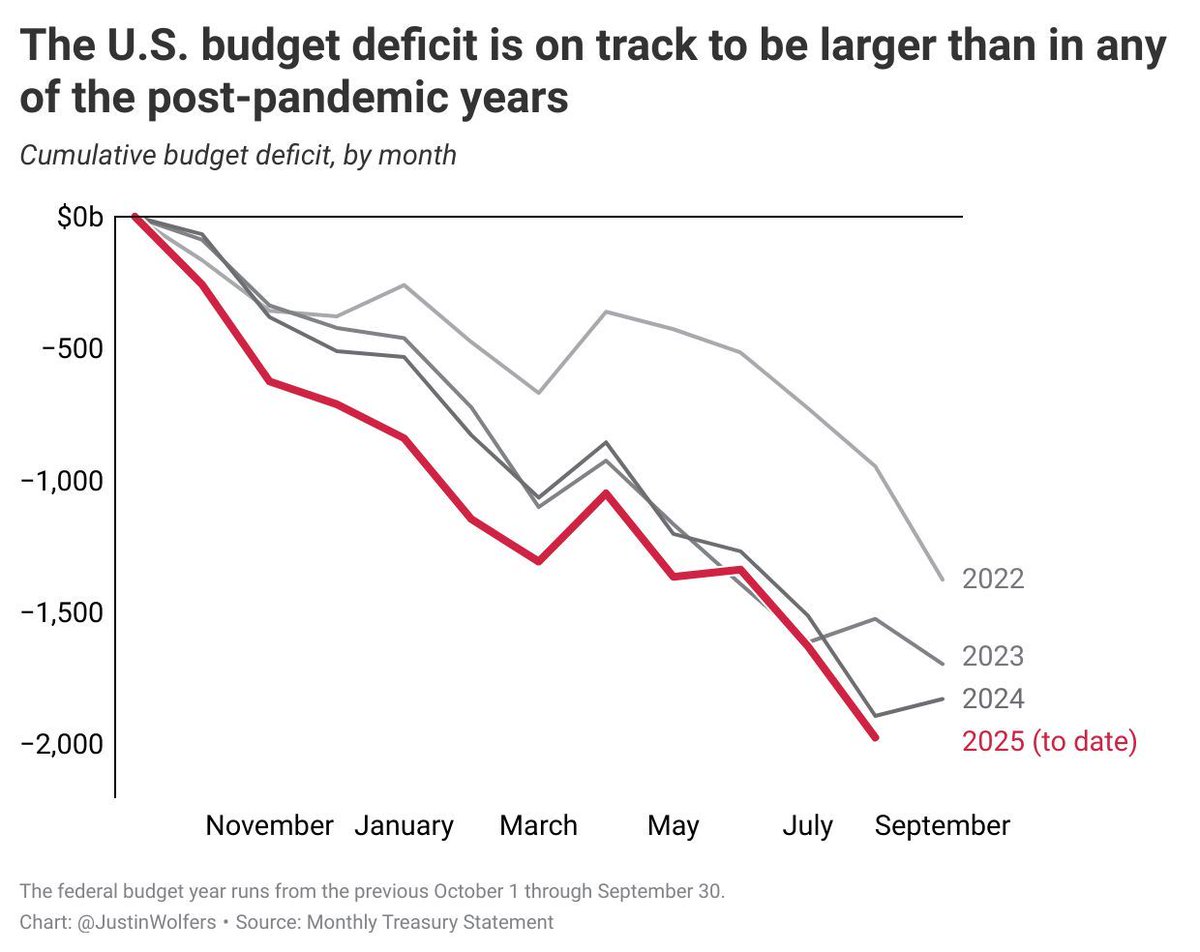
The Fed seems to have taken Mankiw’s approach to heart, except with a preferred range of 2.0-3.5%. I take Mankiw’s point about not being able to fine-tune everything, but given the bigger picture I think the Fed should if anything err on the low side of 2.0%. The Federal deficit is in the trillions and rising, inflation has been above target since 2021, and consumers never got over the Covid-era increase in the price level:
Source: Michigan Consumer Survey
The Fed let inflation stay mostly below 2% during the 2010s, to the detriment of the labor market. They updated their policy framework in 2020 to allow for “Flexible Average Inflation Targeting”, where they would let inflation stay above 2% for a while to make up for the years of below 2% inflation. This is part of why they let inflation get so out of hand in 2022. This made up for the 2010s and then some- our price level is now 3-4% higher than it would be if we’d had 2.0% inflation each year since 2007. But the sudden big burst of inflation in 2022 led the Fed to abandon this flexible targeting idea in the 2025 framework. The lack of “make up” policy latest framework means that they don’t see themselves as needing to do anything to repair their 2022 mistake- “just don’t do it again”.
We’re certainly being stuck with permanently higher prices as a result, and I worry we will be stuck with higher inflation too.
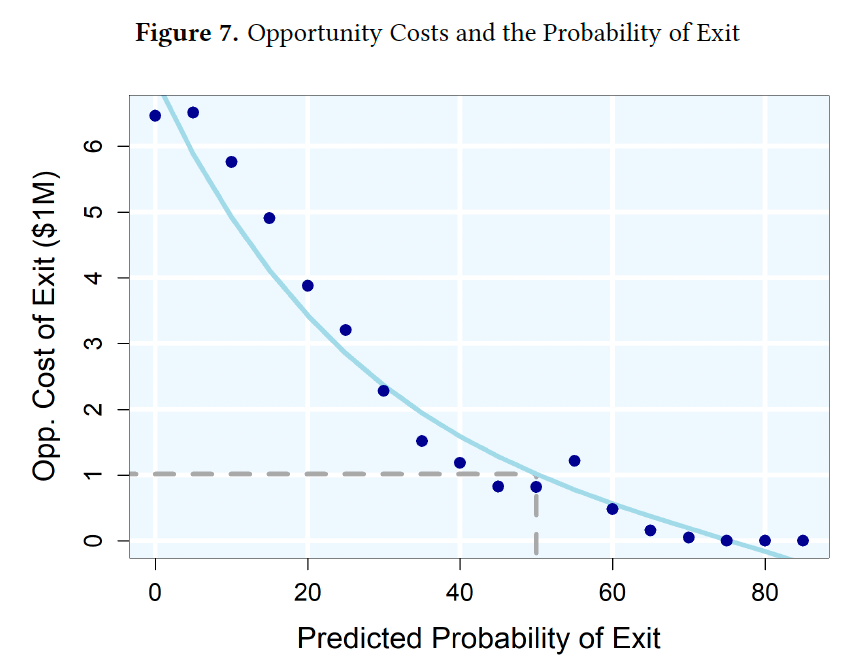
Formerteammates of athletes who died of CTE would require $6 million to offset this disamenity and $1million to be indifferent between exiting and staying in the profession.
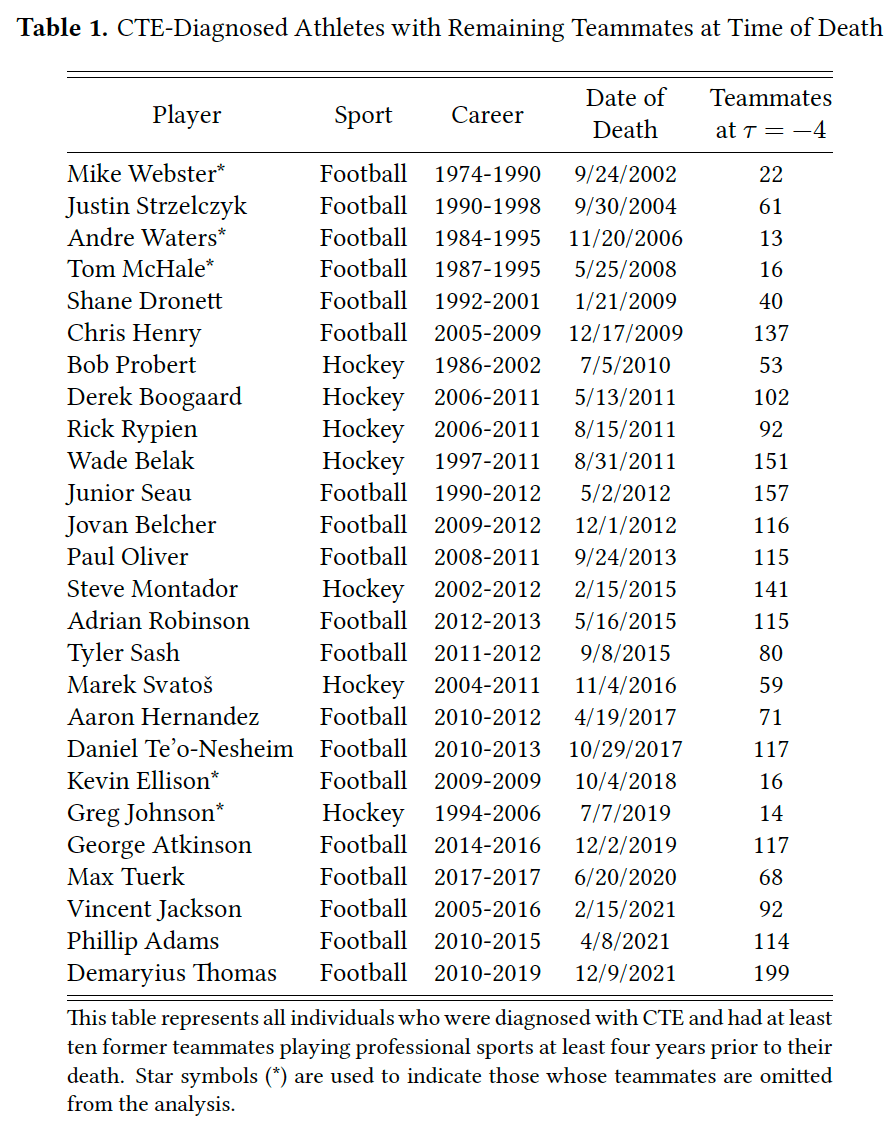
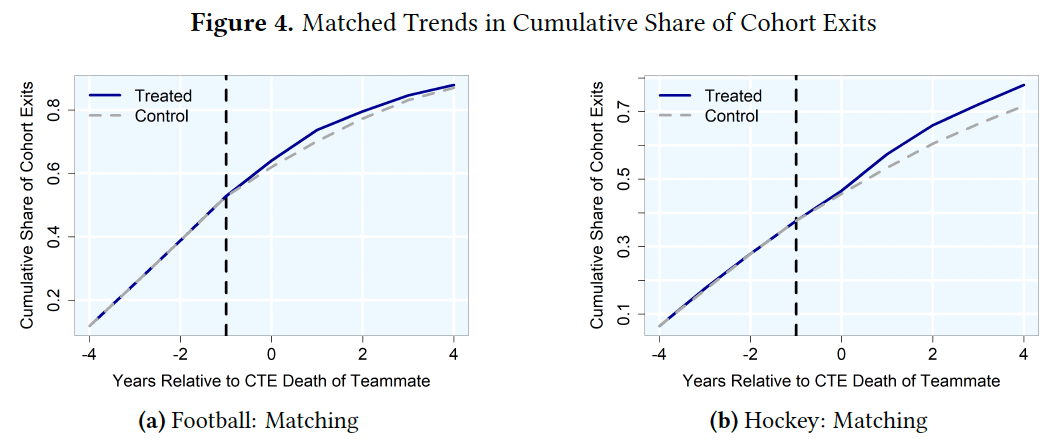
So concludes a paper by Josh Martin. I thought this paper would be about a small group, since CTE deaths mostly happen among long-retired players with few or no former teammates still playing. But it turns out there were a fair number of early deaths, and each player had many teammates who can be affected, totaling 23% of NHL players and 14% of NFL players:
But teams mostly won’t pay worried players enough extra to stay, especially in hockey. So many of them retire early:
Athletes who were teammateswith a former teammate who died with CTE for three or more years and played for a team withthem at least two years before their death are 7.22 percentage points more likely to retire thancharacteristically similar non-treated players in the same years. Relative to the pre-treatmentmean, this represents a 69% increase.
People still respond to incentives though, and if you do pay them enough they mostly take the risk and stay:
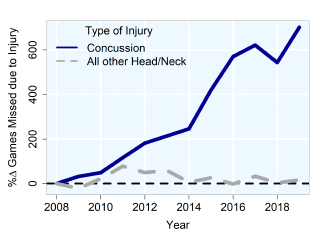
The remaining players will take measures to protect themselves, like skipping games to recover from concussions:
Michael previously pointed out here that these concerns matter more for certain positions, like running backs:
If you want millionaires to show up every week to willingly endure the equivalent of a half-dozen car accidents, you’re going to have to pay them.
This all makes for a good illustration of the theory of compensating differentials, which is sometimes surprisingly hard to observe in the labor market. But sports tend to have the sort of data we can only dream of elsewhere. Which other workers have millions of people observing, measuring, and debating their on-the-job productivity and performance?
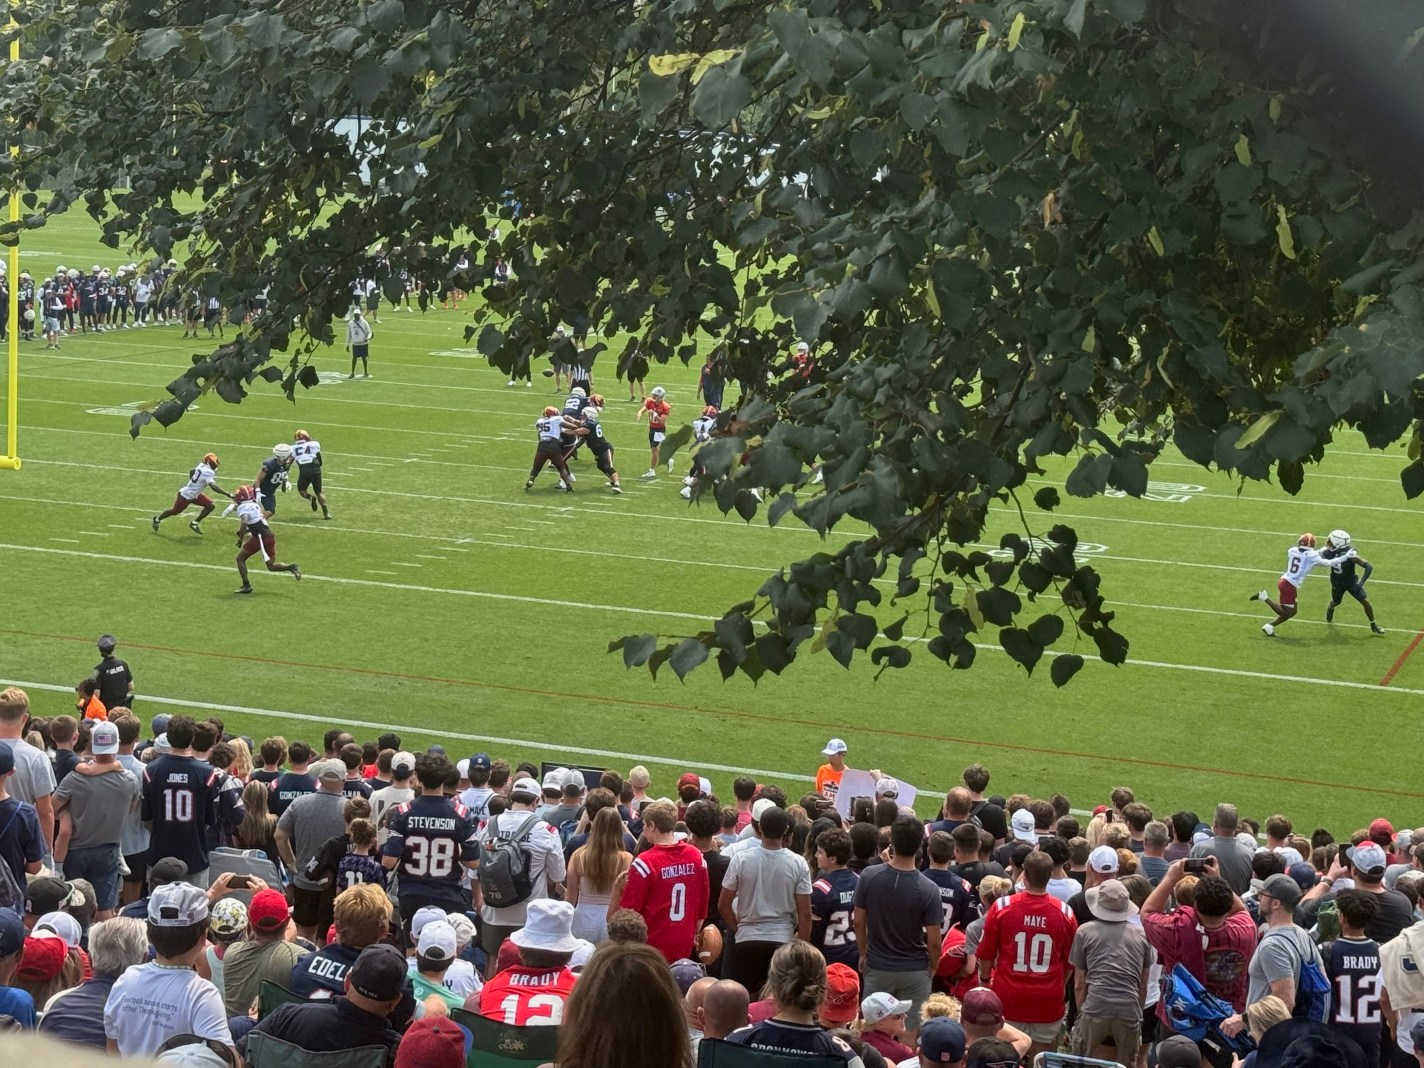
This summer I was one of thousands of people crowding into Foxborough just to watch them practice:
The NFL season kicks off today, and I say the players deserve the millions they are about to earn.
The subjects of two of our posts from 2023 are suddenly big stories.
First, here’s how I summed up New Orleans’ recovery from hurricane Katrina then:
Large institutions (university medical centers, the VA, the airport, museums, major hotels) have been driving this phase of the recovery. The neighborhoods are also recovering, but more slowly, particularly small business. Population is still well below 2005 levels. I generally think inequality has been overrated in national discussions of the last 15 years relative to concerns about poverty and overall prosperity, but even to me New Orleans is a strikingly unequal city; there’s so much wealth alongside so many people seeming to get very little benefit from it. The most persistent problems are the ones that remain from before Katrina: the roads, the schools, and the crime; taken together, the dysfunctional public sector.
Today, New Orleans is smaller, poorer and more unequal than before the storm. It hasn’t rebuilt a durable middle class, and lacks basic services and a major economic engine outside of its storied tourism industry…. New Orleans now ranks as the most income-unequal major city in America…. In areas that attracted investment — the French Quarter, the Bywater and the shiny biomedical corridor — there are few outward signs of the hurricane’s impact. But travel to places like Pontchartrain Park, Milneburg and New Orleans East that were once home to a vibrant Black middle class, and there are abandoned homes and broken streets — entire communities that never regained their pre-Katrina luster…. Meanwhile, basic city functions remain unreliable.
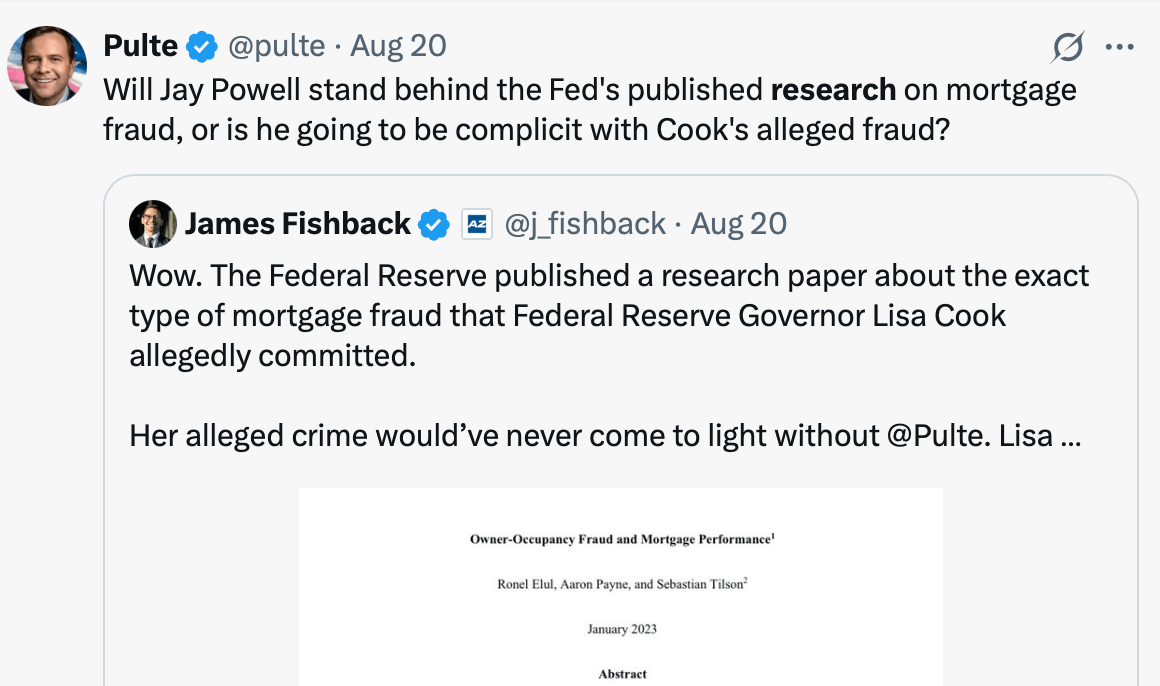
I wrote in 2023 about a then-new Philadelphia Fed working paper claiming that mortgage fraud is widespread:
The fraud is that investors are buying properties to flip or rent out, but claim they are buying them to live there in order to get cheaper mortgages…. One third of all investors is a lot of fraud!… such widespread fraud is concerning, and I hope lenders (especially the subsidized GSEs) find a way to crack down on it…. This mortgage fraud paper seems like a bombshell to me and I’m surprised it seems to have received no media attention; journalists take note. For everyone else, I suppose you read obscure econ blogs precisely to find out about the things that haven’t yet made the papers.
Well, that paper has now got its fair share of attention from the media and the GSEs. Bill Pulte, director of the Federal Housing Finance Agency and chairman of Fannie Mae and Freddie Mac, has been going after Biden-appointed Federal Reserve Governor Lisa Cook over allegations that she mis-stated her primary residence on a mortgage application:
Pulte has written many dozens of tweets about this, at least one of which cited the Philly Fed paper:
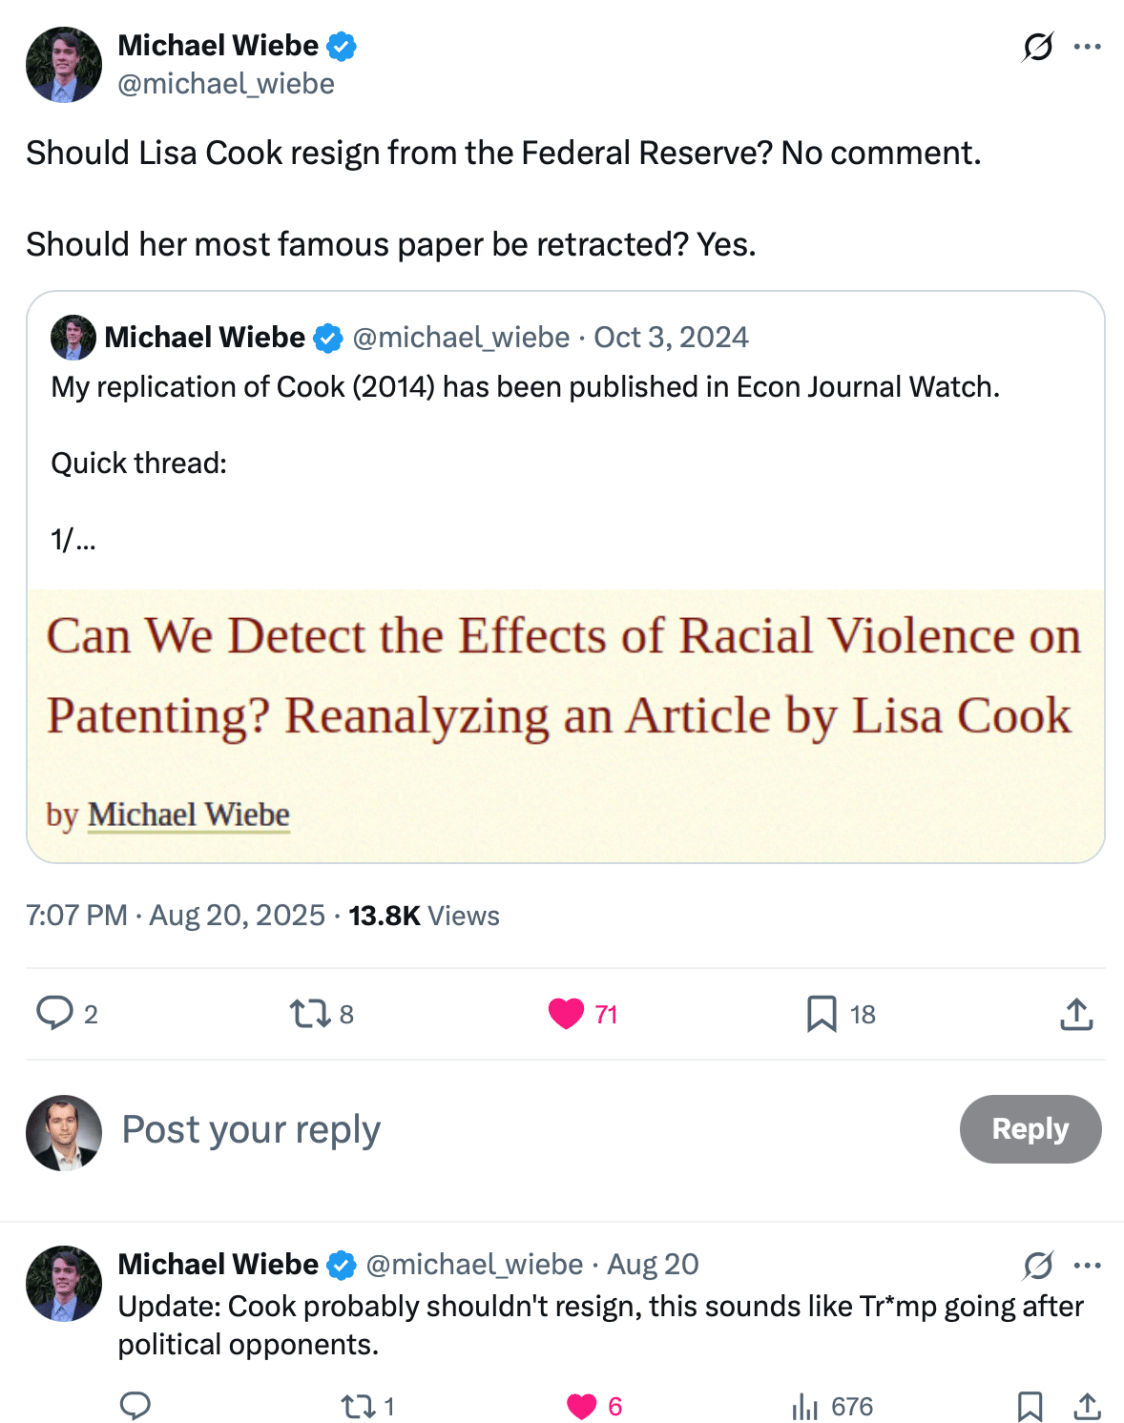
Now President Trump is trying to fire Cook. Federal Reserve Governors can only be fired “for cause” and none ever have been, but Trump is using this alleged mortgage fraud to try to make Cook the first.
The Trump administration seems to have made the same realization as Xi Jinping did back in 2012– that when corruption is sufficiently widespread, some of your political opponents have likely engaged in it and so can be legally targeted in an anti-corruption crackdown (while corruption by your friends is overlooked).
I’m one of a few people hoping for the Fed to be run the most competent technocrats with a minimum of political interference:
The Affordable Care Act was supposed to make it easier for American workers to switch jobs by making it easier to get health insurance from sources other than their current employer. Mostly it didn’t work out that way. But a new paper finds that one piece of the ACA actually made people less likely to switch jobs.
The ACA Dependent Coverage Mandate required family health insurance plans to cover young adults though age 26, when prior to the 2010 passage of the ACA many had to leave the family plan at age 18 or 19. I thought these newly covered young adults would be more likely to switch jobs or start businesses, but there turned out to be absolutely no effect on job switching, and no overall increase in businesses (though it did seem to increase the number of disabled young adults starting businesses, and other parts of the ACA increased business formation among older adults).
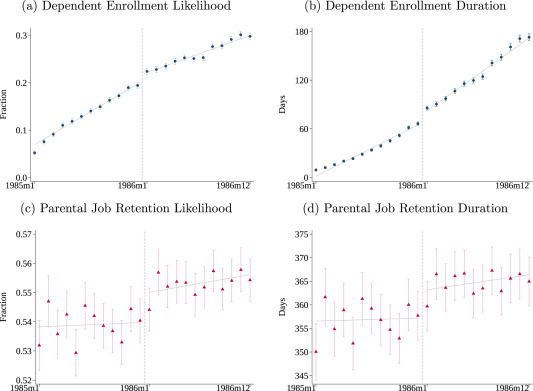
But while the Dependent Coverage mandate seems not to have reduced job lock for young adults, it increased job lock among their parents. That is the finding of a new paper in the Journal of Public Economics by Hannah Bae, Katherine Mackel, and Maggie Shi. Using a large dataset with exact months of age and coverage, MarketScan, allows them to estimate precise effects:
We find that dependents just to the right of the December 1985/January 1986 cutoff—those eligible for longer coverage—are more likely to enroll and remain covered for longer once the mandate is in effect. Dependent enrollment increases by 1.8 percentage points at the cutoff, an increase of 9.2 % over the enrollment rate for dependents born in December 1985. In addition, the enrollment duration increases by 9.7 days (14.6 %). Turning to their parents, we find that parental job retention likelihood increases by 1.0 percentage point (1.8 %) and job duration increases by 5.8 days (1.6 %) to the right of the cutoff. When scaled by the estimated share of dependents on end of year plans, our findings imply that 12 additional months of dependent coverage correspond to a 7.7 % increase in job retention likelihood and a 7.0 % increase in retention duration.
I believe in this parental job lock effect partly because of their data and econometric analysis, and partly through introspection. I plan to work for years after I have the money to retire myself in order to keep benefits for my kids, though personally I’m more interested in tuition remission than health insurance.
On top of working longer though, benefits like these enable employers to pay parents lower money wages. A 2022 Labour Economics paper from Seonghoon Kim and Kanghyock Koh found that the Dependent Coverage Mandate “reduced parents’ annual wages by about $2600 without significant reductions in the probability of employment and working hours.” But at least their kids are better off for it.
Music majors earn more than people who didn’t graduate from college, even if they don’t end up working as musicians
Among musicians, music majors earn more than other majors
But among non-musicians, other majors earn much more than music majors
So on average a music major means higher income if you would be a musician anyway, or if you wouldn’t have gone to college for another major, but lower income than if you majored in something else and worked outside of music. The exact amounts depend on what you control for; this gets complex but this table gives the basic averages before controls:
Source: Table 2 of Bailey and Smith (2025), showing wage plus business income for respondents to the 2018-2022 American Community Survey
For better or worse, a music major also means you are much more likely to be a musician- 113 times more likely, in fact (this is just the correlation, we’re not randomizing people into the major). Despite that incredible correlation, only 9.8% music majors report being professional musicians, and only 22.3% of working musicians were music majors.
Sean Smith had the idea for this paper and wrote the first draft in my Economics Senior Capstone class in 2024. After he graduated I joined the paper as a coauthor to get it ready for journals, and it was accepted at SN Social Sciences last week. We share the data and code for the paper here.
I’m a big fan of Friedrich Hayek. I first read his work in an academic setting. But many people first encounter him via The Road to Serfdom, his book that outlines the political and social consequences of state economic controls. I always meant to go back and read it, but it usually took a back seat to other works. Now, I’m slowly making my way through.
A lovely snippet includes Hayek explaining the popular sentiment that “it’s only money” or that money-related concerns are base or superficial. Such an attitude is especially common when people recount their childhood or family life during times of financial difficulty. The story often goes “times were hard, but we had each other”. Similarly, a popularly derisive trope is that economists ‘only care about money’ [, rather than the more important things].
When every frontier AI model can pass your tests, how do you figure out which model is best? You write a harder test.
That was the idea behind Humanity’s Last Exam, an effort by Scale AI and the Center for AI Safety to develop a large database of PhD-level questions that the best AI models still get wrong.
The effort has proven popular- the paper summarizing it has already been cited 91 times since its release on March 31st, and the main AI labs have been testing their new models on the exam. xAI announced today that its new Grok 4 model has the highest score yet on the exam, 44.4%.
Current leaderboard on the Humanity’s Last Exam site, not yet showing Grok 4
The process of creating the dataset is a fascinating example of a distributed academic mega-project, something that is becoming a trend that has also been important in efforts to replicate previous research. The organizers of Humanity’s Last Exam let anyone submit a question for their dataset, offering co-authorship to anyone whose question they accepted, and cash prizes to those who had the best questions accepted. In the end they wound up with just over 1000 coauthors on the paper (including yours truly as one very minor contributor), and gave out $500,000 to contributors of the very best questions (not me), which seemed incredibly generous until Scale AI sold a 49% stake in their company to Meta for $14.8 billion in June.
Here’s what I learned in the process of trying to stump the AIs and get questions accepted into this dataset:
The AIs were harder than I expected to stump because they used frontier models rather than the free-tier models I was used to using on my own. If you think AI can’t answer your question, try a newer model
It was common for me to try a question that several models would get wrong, but at least one would still get right. For me this was annoying because questions could only be accepted if every model got them wrong. But of course if you want to get a correct answer, this means trying more models is good, even if they are all in the same tier. If you can’t tell what a correct answer looks like and your question is important, make sure to try several models and see if they give different answers
Top models are now quite good at interpreting regression results, even when you try to give them unusually tricky tables
AI still has weird weaknesses and blind spots; it can outperform PhDs in the relevant field on one question, then do worse than 3rd graders on the next. This exam specifically wanted PhD-level questions, where a typical undergrad not only couldn’t answer the question, but probably couldn’t even understand what was being asked. But it specifically excluded “simple trick questions”, “straightforward calculation/computation questions”, and questions “easily answerable by everyday people”, even if all the AIs got them wrong. My son had the idea to ask them to calculate hyperfactorials; we found some relatively low numbers that stumped all the AI models, but the human judges ruled that our question was too simple to count. On a question I did get accepted, I included an explanation for the human judges of why I thought it wasn’t too simple.
I found this to be a great opportunity to observe the strengths and weaknesses of frontier models, and to get my name on an important paper. While the AI field is being driven primarily by the people with the chops to code frontier models, economists still have lot we can contribute here, as Joy has shown. Any economist looking for the next way to contribute here should check out Anthropic’s new Economic Futures Program.