I normally like the Wall Street Journal; it is the only news page I check directly on a regular basis, rather than just following links from social media. But their “Biggest News Stories of 2024” roundup makes me wonder if they are overly parochial. When I try to zoom out and think of the very biggest stories of the past five to ten years, three of the absolute top would be the rapid rise of China and India, together with the astonishing growth in artificial intelligence capabilities.
All three of those major stories continued to play out this year, along with allsorts of otherthings happening in the two most populous countries in the world, and all the ways existing AI capabilities are beginning to be integrated into our businesses, research, and lives. But the Wall Street Journal thinks that none of this is important enough to be mentioned in their 100+ “Biggest Stories”.
To be fair, China and AI do show up indirectly. AI is driving the 4 (!) stories on NVIDIA’s soaring stock price, and China shows up in stories about spying on the US, hacking the US, and the US potentially forcing a sale of TikTok. But there are zero stories regarding anything that happened within the borders of China, and zero that let you know that AI is good for anything besides NVIDIA’s stock price.
Plus of course, zero stories that let you know that India- now the world’s most populous country, where over one out of every six people alive resides- even exists.
AI’s take on India’s Prime Minister using AI
This isn’t just an America-centric bias on WSJ’s part, since there is lots of foreign coverage in their roundup; indeed the Middle East probably gets more than its fair share thanks to “if it bleeds, it leads”. For some reason they just missed the biggest countries. They also seem to have a blind spot for science and technology; they don’t mention a single scientific discovery, and only had two technology stories, on SpaceX catching a rocket and doing the first private spacewalk.
The SpaceX stories at least are genuinely important- the sort of thing that might show up in a history book in 50+ years, along with some of the stories on U.S. politics and the Russia-Ukraine war, but unlike most of the trivialities reported.
I welcome your pointers to better takes on what was important in 2024, or on what you consider to be the best news source today.
Really, our richest in the 1890s? Can this be true? Are the anonymous socialist Twitter accounts correct? Let’s look at the data. But the answer probably won’t surprise you: your intuition is correct, we are much better off today than the 1890s, in almost every way of looking at it economically.
I’ve written before on this blog about “time prices”: the amount of time it takes at a particular wage to buy a specific product. Time prices are especially useful for making historical comparisons of the real price of a good or service. Rather than adjusting historical prices for inflation (which only tells you whether they have increased faster or slower than average prices), time prices give you a real comparison of whether a good has become more or less affordable.
You will notice a few things here. For the median worker, most things are much more affordable in 2024. Some things are dramatically so! For many items, the median worker in 2024 is similar to someone in the top 1% in 2024. Huge improvements in the standard living.
It will probably not surprise you that one major exception is housing. For renters, things are not obviously worse, but they are not better, depending on what size of city you are in (renters also have lower incomes, but that would be true in both time periods). However compared to the average home price, things look much worse in 2024. You can reasonably reply that the home is much larger and better quality in 2024 (as late as 1940, barely half of homes had complete indoor plumbing!), and this is all true. Still, an average house today is much better, but also much less affordable.
Despite the high cost of housing, the average worker today is much better off than 1924. It’s hard to deny it.
But what about more recent times? As a recurring meme likes to date it, what about since 1971?
When you see prices from the past, especially the distant past, your normal reaction is perhaps one of envy or nostalgia. Take for example the Thanksgiving menu from the Plaza Hotel in New York in 1899. As you browse the menu, note that the prices are in cents, not dollars.
The most expensive items on the menu are only a few dollars, while many items can be had for around 50 cents. But hopefully your nostalgia will soon fade when you recall that wages were probably lower back then.
But how much lower?
According to data from MeasuringWorth.com (an excellent resource affiliated with the Economic History Association), the average wage for production workers in manufacturing was 13 cents per hour in 1899. From this we can immediately see that a dish such as Ribs of Prime Beef (60 cents) would take about 4.5 hours of work for a production worker to purchase.
How can we compare these prices and wages from 1899 to today?
Where would you expect Federalism to occur? In other words, where would expect a government to devolve authority to a lower government. Importantly, this is different from freedom vs authoritarianism. The lower government might choose to be more or less free. For example, right now in Florida there is a state-wide constitutional amendment on the ballot that would enshrine each individual’s right to hunt and fish. Ignoring the particulars of what that means, it’s clearly a step toward centralizing policy rather than decentralizing it. Central governments can be strong and protect citizens, or they can strip us of rights. Either way, being small players and far-removed, it’s difficult for us to affect the policy decisions.
That concern is philosophical, however. Maybe my opinion shouldn’t matter (one could easily argue). Even as a matter of prudence, one-size-fits all sets a standard, but the standard may not be a good fit for every locality and circumstance. There is a trade-off between ease of navigating a uniform policy across the land and customized policies that are particular to local priorities. Given that Americans can vote, is there a way for us to think about when a policy will be (should be?) centralized vs decentralized?
There is a great case study by Strumpf & Oberholzer-Gee* on the matter of alcohol policy after the end of national prohibition. The US has a dizzying array of liquor laws across the country and even across states. Some states have a central policy of dry or wet, while others devolve the authority to lower governments. How should we think about that policy? What determines the policy of central versus devolved authority?
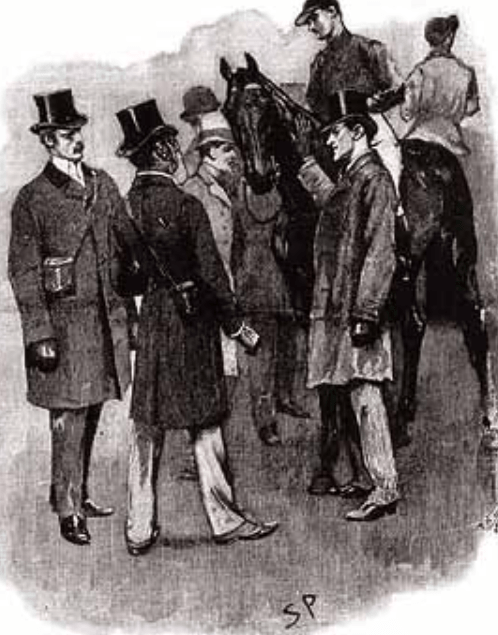
We’d know him anywhere, thanks to that deerstalker cap. This was a practical hat used by hunters and other outdoorsmen in England at the time. It was popular with women as well as men. The front and back brims warded off rain and sun. The ear flaps tied under the chin for cold weather or wind. The flaps were tied at the top when they were not down. Holmes’s hat was apparently in a hounds-tooth tweed pattern of water-shedding wool.
How often did Arthur Conan Doyle feature his detective character wearing this headgear? Actually, he didn’t at all. The stories never once mention Holmes in a deerstalker cap (or an Inverness cape, another Sherlock Holmes trope), although such a hat is not implausible.
When the first sets of Sherlock Holmes stories appeared serialized in the Strand magazine in the early 1890’s, they were illustrated by artist Sidney Paget. Paget is responsible for the deerstalker cap image. Here is the detective and his sidekick on the way to investigate the Boscombe Valley mystery:
It would seem that Sherlock Holmes lived and died by his deerstalker, as evidenced by Paget’s illustration on the detective’s struggle to the death with the arch-villain Professor Moriarity above Reichenbach Falls, in The Final Problem:
( Doyle wrote The Final Problem to kill off his detective character, so the author could move on to more dignified pursuits than writing Sherlock Holmes stories. He did not anticipate the public outcry at the demise of the popular character. Men in London wore black armbands, and subscriptions to the Strand magazine were cancelled in protest. Eventually Doyle brought Holmes back in a further series of stories, with the literary device that Holmes had faked his own death in order to hide out from a criminal syndicate. )
Even Paget did not keep Holmes in this hat all the time. When the great detective was not sleuthing in the outdoors, he was properly dressed for English society. It was unthinkable for a gentleman to appear in public without some kind of hat. For instance, here are two illustrations from The Adventure of Silver Blaze. Holmes is depicted below in his deerstalker when confronting a bad guy at the gate of a neighboring farm, after tracking a horse across the moor:
In the same story, however, Holmes is drawn by Paget at a horse race event wearing a formal top hat like the other gentlemen:
Image: WikipediaHolmes with Silver Blaze (forehead dyed), 1892 illustration by Sidney Paget
If all this leaves you itching for your own deerstalker cap, there are several versions available on Amazon, e.g. here and here.
Bonus: if you yearn to identify with a more contemporary hero, see here for info on Indiana Jones fedoras.
Jared Diamond is a polymath (biochemistry, physiology, ornithology, ecology; MacArthur Genius Grant; etc.) perhaps best known for his Guns, Germs and Steel (1997). In that book (which I read) he proposed that shared learnings and practices across the vast Eurasian continent led to optimized food crops and agricultural practices for Eurasian peoples, which in turn led to dense, stratified societies where technical development could progress. This included Chinese and other Asian societies, not just Europeans. This enabled large military forces equipped with formidable weapons, that could dominate non-Eurasian peoples when they came in contact. The rest is history.
In another popular book (which I also read), Collapse: How Societies Choose to Fail or Succeed (2005), Diamond presented explanations for the collapse or (relative) failure of a number of modern and historical societies. These included the Norse settlers in Greenland, the Maya of Central America, and Easter Island.
Easter Island, known as Rapa Nui by its natives, is the most isolated inhabited landmass on Earth. It lies some 2200 miles west of Chile and 1200 miles east of Pitcairn Island (think: mutiny on the Bounty). The first European contacts were brief visits by various ships in the early 1700’s. At that point, there appeared to be several thousand inhabitants, and no large trees. It seems that Polynesian settlers arrived on the island around 1200 A.D., though perhaps as early as 800. The pollen record and carbon-14 dating showed that large palm trees were present on the island, but disappeared around 1650.
Easter Island is perhaps best known for its many large (20-30 ft high) stone carvings called moai:
Scholars have supposed that a large, hierarchical society was needed to produce the some 1000 moai observed on Easter Island. These statues were later deliberately toppled, for reasons unknown.
Following the suggestions of some early anthropologists, Diamond spun a riveting apocalyptic tale of overpopulation and stupidity: supposedly the population grew to some 15,000 souls, mindlessly chopping down all the trees to transport and erect the huge stone carvings. This deforestation, together with exhaustion of nutrients in the soil, led to a downward spiral in the welfare of the community: no trees = soil erosion and water runoff and no edible nuts; no wood= no boats = few fish. Shifts in trade winds or climate were also implicated. Tribal warfare, class struggle and cannibalism erupted, with mass deaths through violence and starvation, all before the Europeans showed up. The account of internecine conflict was supported by the natives’ oral traditions. This whole story arc was taken to be a parable for our times: if you mess with your ecosystem, society may not stand the strain.
Perhaps jealous of upstart Jared Diamond’s success, some fifteen authors from the professional anthropology guild ganged up and published an attack volume titled Questioning Collapse in 2009. They disputed many of Diamond’s assertions, including his Easter Island collapse scenario.
Results from the past several years have swung the consensus firmly against the ecocide collapse theory. For instance, a carbon-14 dating study of bone and wood artifacts by DiNapoli, et al. indicated a steady growth in population up until European contact in the early 1700s. The same conclusion was reached in a recent study by J. Víctor Moreno-Mayar et al., using DNA measurement from native genomes dating between 1670 and 1950. Also, it seems from mariners’ reports that toppling of the statues did not begin until after European contact. The loss of the trees is now attributed mainly to the Polynesian rats brought with the natives; the rats eat the palm seeds.
What actually did the natives in was a series of raids by Peruvian slave-traders in 1862. They abducted about half of the 3000 inhabitants, including the leaders and cultural carriers. After a public outcry o\in 1865 by the bishop of Tahiti, the embarrassed Peruvian government repatriated the surviving slaves, but they carried back a smallpox infection which killed off most of the rest. “1868 saw the entire social order of Easter Island collapse, there were no more standing Moai statues… In 1877, only 110 impoverished and disheartened inhabitants remained.” Ouch. So, the social order did collapse, but not from climate change or ecological stupidity.
In 1888, Chile took over Easter Island as a protectorate, shielding the inhabitants from further slaver attacks. That began a fitful recovery for the Rapa Nui people, who as of 2017 numbered 3,512. This is roughly the population prior to European contact.
Most of us have read or heard references to flat-earthers. I have always assumed they are some tiny tongue-in-cheek group which is just playing out an elaborate joke on the rest of us. The Greeks figured out by 300 A.D. that the earth was round, and this tidbit was incorporated into medieval scholarship, so there has never been much religious or traditional impetus for a flat earth. I was therefore a bit surprised to learn that flat earth beliefs are very serious to many folks, and that such beliefs seem to be on the rise.
In 2020, it was reported that based on polling by Datafolha, 7% of Brazilians believed in a flat Earth. A 2018 YouGov poll found that around 4% of the population of the United States believed in flat Earth while the POLES 2021 Survey found around 10% of the United States population believed that the Earth is flat. A 2019 YouGov survey found that around 3% of British people supported flat Earth.
Digging into that 2018 YouGov poll finds that 2% of Americans resolutely say the earth is flat, but many others who lean towards a round earth are not quite sure. Flat-earthism is more prevalent in Millennials than in older folks, only 66% of Millennials firmly believe the earth is round :
While an overwhelming majority of Americans (84%) believe that the Earth is round, at least 5% of the public say they used to believe that but now have their doubts. Flat earthers find traction in their beliefs among a younger generation of Americans. Young millennials, ages 18 to 24, are likelier than any other age group to say they believe the Earth is flat (4%).
Apparently, a YouTube channel launched in 2015 by real-life pinball wizard Mark Sargent (“…a competitive video game player, winning one virtual pinball tournament”), which has amassed over two million views, has played a role in popularizing flat earth beliefs. In his brand of geography, the center of the earth-disk is roughly the North Pole, and the edge of the earth-disk lies in what we normally think of the extreme south, and is surrounded by an ice-wall. Several basketball players (Kyrie Irving, Wilson Chandler, Draymond Green) and a rapper (B.o.B) have come out in favor of flatness. The NASA conspiracy of a round earth is crumbling…
I think some of this flat-earth polling is just ignorance, especially those who are not sure. But there are those who “have their reasons”, often citing various (pseudo) scientific arguments to support their beliefs:
Research by Carlos Diaz Ruiz and Tomas Nilsson on the arguments that flat Earthers wield, shows three factions, each one subscribing to its own set of beliefs.
The first faction subscribes to a faith-based conflict in which atheists use science to suppress the Christian faith. … their arguments use the Scripture – word-by-word – to support an argument that enables God to really exist.
The second faction believes in an overarching conspiracy for knowledge suppression. Building upon the premise that knowledge is power, the flat Earth conspiracy argues that a shadowy group of “elites” control knowledge to remain in power. In their view, lying about the fundamental nature of the Earth primes the population to believe a host of other conspiracies. …
The third faction believes that knowledge is personal and experiential. They are dismissive of knowledge that comes from authoritative sources, especially book knowledge.
Belief in geocentricity (i.e., that the earth is stationary and the sun goes around the earth) is even more widespread than belief in a flat earth. From Wikipedia:
According to a report released in 2014 by the National Science Foundation, 26% of Americans surveyed believe that the Sun revolves around the Earth. Morris Berman quotes a 2006 survey that show currently some 20% of the U.S. population believe that the Sun goes around the Earth (geocentricism) rather than the Earth goes around the Sun (heliocentricism), while a further 9% claimed not to know. Polls conducted by Gallup in the 1990s found that 16% of Germans, 18% of Americans and 19% of Britons hold that the Sun revolves around the Earth. A study conducted in 2005 by Jon D. Miller of Northwestern University, an expert in the public understanding of science and technology, found that about 20%, or one in five, of American adults believe that the Sun orbits the Earth. According to 2011 VTSIOM poll, 32% of Russians believe that the Sun orbits the Earth.
Geocentrism seems particularly driven by religious concerns, although I think the polls also heavily reflect plain ignorance. There are passages in the Bible which, if taken literally, seem to mandate a stationary earth and a moving sun. The Roman Catholic church has tiptoed away from its condemnation of Galileo four hundred years ago, and essentially accepted his contention that such passages were never intended to be taken literally. Nevertheless, Catholic layman Robert Sungenis has vigorous argued for geocentricity and Bible literalism, publishing books such as Galileo Was Wrong. On the fundamentalist Protestant side, there is the Association for Biblical Astronomy, with its web site www.geocentricity.com, and apologist Dean Davis.They make arguments to dismiss the usual scientific conclusions on this matter, e.g., that according to relativity, it could be true that the earth is stationary and the entire universe is spinning around the earth.
Geocentricity is somewhat poignant for me, because a good friend of mine from college later became deeply attached to it, to the point that he rejected my thinking as apostate when I disagreed. He was a bright guy and an Ivy League graduate. Which just goes to show that fringe beliefs can have unexpected appeal.
A recent post from the blogger (Substacker?) Cremieux called Rich Country, Poor Country showed how small differences in economic growth add up over time. Because he used nominal GDP growth rates, I don’t think that post is exactly the right way to analyze the question, but I still think it’s a very important one. So in this post I will offer, not necessarily a critique of that post, but perhaps a better way of looking at the data.
For the data, I will use the Maddison Project Database, which attempts to create comparable GDP per capita estimates for countries going back as far as possible… for some, back thousands of years, but for most countries at least the last 100 years. And the estimates are stated in modern, purchasing power adjusted dollars, so they should be roughly comparable over time (if you think these estimates are a bit ambitious, please note that they are scaled back significantly from Angus Maddison’s original data, which had an estimate for every country going back to the year 1 AD). The most recent year in the data is currently 2022, so if I slip up in this post and say “today,” I mean 2022, or roughly today in the long sweep of history.
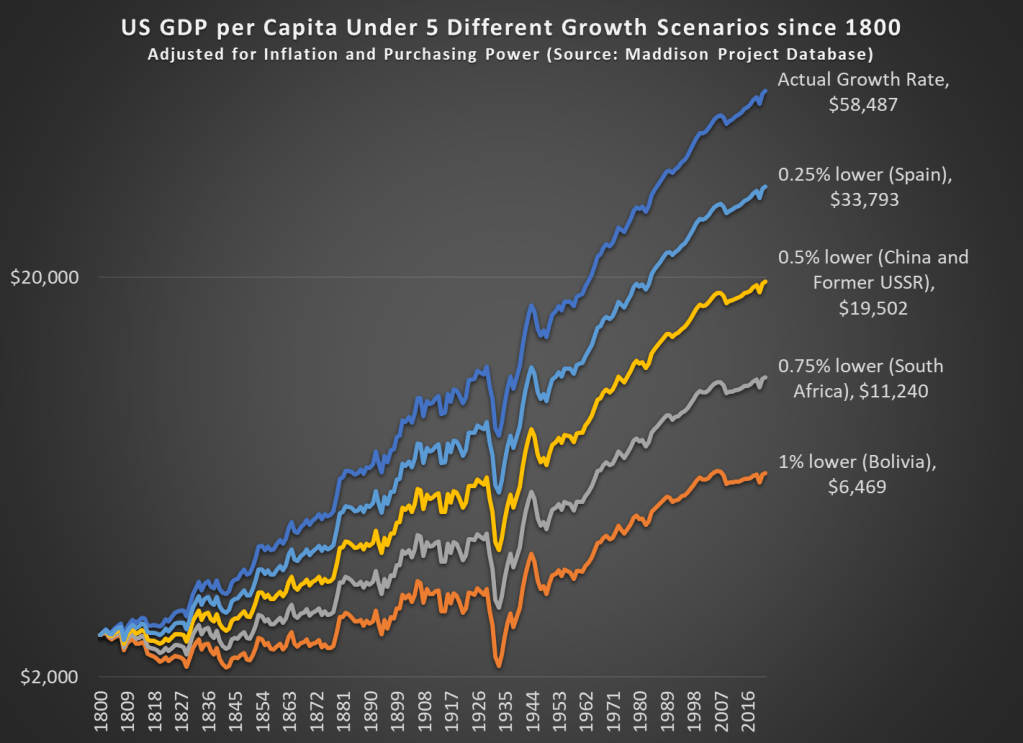
Like Cremieux’s post, I am interested in how much slightly lower economic growth rates can add up over time. Or even not so slightly lower growth rates, like 1 percentage point less per year — this is a huge number, because the compound annual average growth rate for the US from 1800 to 2022 is 1.42%. So let’s look at the data way back to 1800 (the first year the MPD gives us continuous annual estimates for the US) to see how changes in growth rates affect long-term growth.
It probably won’t surprise you that if our 1.42% growth rate had been 1 percentage point lower, the US would be much poorer today, but to put a precise number on it, we would be about where Bolivia is today (that is, ranked 116th out of the 169 countries in the MP Database). Note: I’m using a logarithmic scale, both so it’s easier to see the differences and because this is standard for showing long-run growth rates.
What is very interesting, I think, is that if our growth rate had been just 0.25 percentage points lower per year since 1800, we would be about where Spain is. Now, Spain is certainly a fine, modern developed country (they rank 34th of the 169 MPD countries). But Spain’s growth has not been spectacular lately. Average income in Spain is almost half of the US today (purchasing power adjusted!), which is another way to say that just 0.25 percentage points lower over 222 years reduces your growth rate by half.
That’s the power of economic growth.
And if our growth rate had been 0.5 percentage points lower, we’d be about where the big former Communist countries are today (both China and the former countries of the USSR are about equal today — about 1/3 of the income of the US).
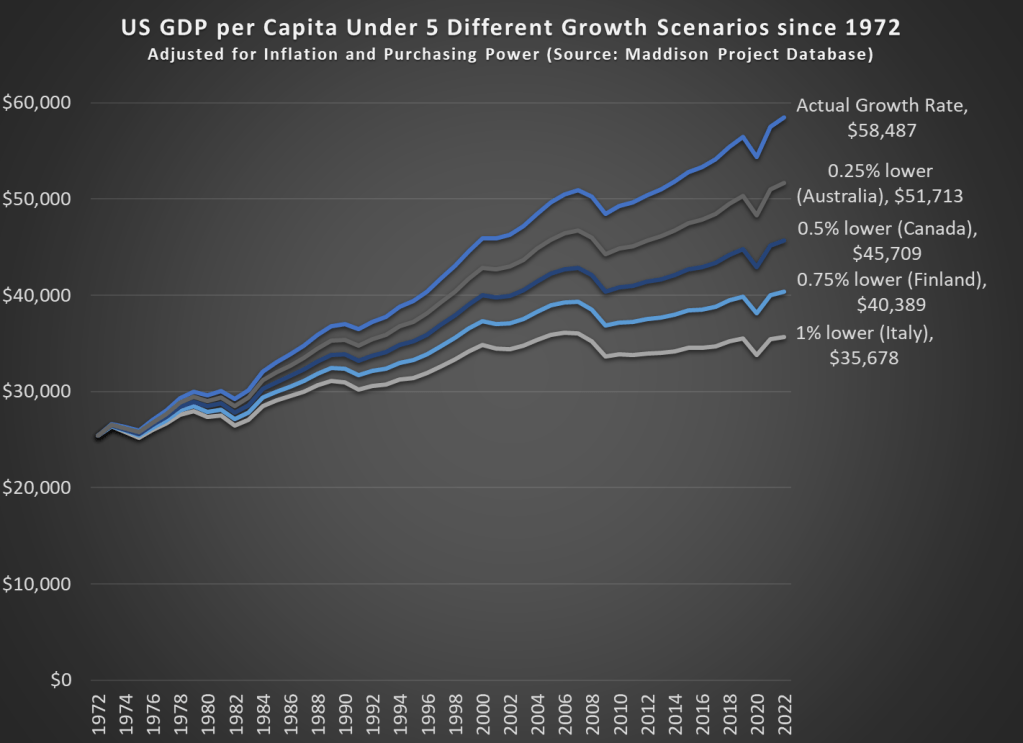
What if we perform the same analysis for a shorter time horizon? If we go back 50 years to 1972, the effects are not quite as dramatic, but still visible.
Our cumulative annual growth rate since 1972 has been a bit higher than the long-run average, around 1.68%. Under these four alternative growth scenarios since 1972, the comparable countries don’t sound so bad. It probably wouldn’t be a huge deal if we were only at Australia’s level, losing just about a decade of economic growth. But it would be a huge failure if we were only at Italy’s current level of development. Under that 1 percentage point lower growth scenario, we would have had no net growth since about year 2000, which has roughly been the case for Italy.
All of these alternative scenarios show the power of economic growth to add up over time, but they do so in pessimistic way: what if growth had been slower. What if we look at the opposite: what if growth had been faster over some time horizon. Sticking with the 1972 medium-run example, if real growth rates had been 1 percentage point higher, our income today would be almost double what it actually is, about $95,000 compared with the current $58,000 (the MPD data is stated in 2011 dollars, so that sounds lower than it actually is now: over $80,000).
What if we went back even further? If our economic growth rate since 1800 had been 1 percentage point higher every year, our average income in 2022 would be an astonishing $517,000 — almost 10 times what it actually was in 2022. That’s a dizzying number to think about, and maybe that’s not a realistic alternative scenario.
But what if it had only been 0.25 percentage points higher since 1800 — that probably is a world that was possible. In that case, GDP per capita would be about double what it actually was in 2022, at over $100,000 (again, stated in 2011 dollars).
That is the title of a 2020 book by Dierdre McCloskey and Art Carden. It attempts to sum up McCloskey’s trilogy of huge books on the “Bourgeois Virtues” in one short, relatively easy to read book. I haven’t read the full trilogy, so I can’t say how good the new book is as a distillation, but I found that it was easy to read and at least makes me think I understand McCloskey’s basic thesis for why the world got rich. I share some highlights here.
Part 1 of the book aims to establish that the world did in fact get richer over recent centuries, plus give a basic explanation of liberal political thought. If you already know this you could skip this part and cut down an easy 189 page read to a very easy 106 page read (part 1 is for some reason written in a way that assumes you disagree with the authors, which grates when you don’t, or perhaps also if you do).
Part 2 gets to what I at least came for- digging into the history to solve the puzzle of why the Industrial Revolution / Great Enrichment took off when and where it did. Which means first, explaining why many things people think made 18th century England special were actually common elsewhere, like markets:


.png)