The Best Investments of the 1970s

The tariffs still have me thinking about buying VIX calls and stock puts (especially when policy changes loom on certain dates like July 8th), and on the bigger question of finding the sort of investments that did well in the 1970’s, another decade of stagflation that was kicked off by a President who broke America’s commitment to an international monetary system that he thought no longer served us.

That’s how I concluded last week. So this week I’ll answer the question- what were the best investments of the 1970’s? When the dollar is losing value both at home and abroad, holding dollars or bonds that pay off in dollars does poorly:

Source: My calculations using Aswath Damodaran’s data

Stocks can do alright with moderate inflation, but US stocks lost value in the stagflation of the 1970’s. Foreign stocks and commodities generally performed better. Real estate held its value but didn’t produce significant returns; gold shone as the star of the decade:

Source: My calculations using Aswath Damodaran’s data

Gold is easy to invest in now compared to the 1970s; you don’t have to mess with futures or physical bullion, there are low-fee ETFs like IAUM available at standard brokerages.

Of course, while history rhymes, it doesn’t repeat exactly; this time can and will be different. I doubt oil will spike the same way, since we have more alternatives now, and if it did spike it wouldn’t hurt the US in the same way now that we are net exporters. Inflation won’t be so bad if we keep an independent Federal Reserve, though that is now in doubt. At any time the President or Congress could reverse course and drop tariffs, sending markets soaring, especially if they pivot to tax cuts and deregulation in place of tariffs ahead of the midterms.

Things could always get dramatically better (AI-driven productivity boom) or worse (world war). But for now, “1970s lite” is my base case for the next few years.

Long-Short Funds Can Mitigate Your Portfolio Gyrations

Here we discuss some stock funds that go down less than stocks in general; the flip-side is that they go up less than plain stocks, as well. Some investors may appreciate the reduction in gyrations, especially after a week like the previous one.

Long-short funds come in two main flavors. When you buy a stock, that is considered being “long”. If you short-sell a stock (borrow shares from some broker, that you plan to pay market price for later, such that you make roughly one dollar for every dollar the stock goes down), that is being short.

 “Equity-neutral” funds are short as much value of stocks as they are long. So, they are net 0% long. Obviously, you would expect the value of such a fund to not decline much in a market crash. But conversely, it would not go up much in a bull market, either. So how is this better than just holding cash in your account? The magic is if the active fund managers can manage to be long a set of stocks which go up more than the stocks that they short. They often try to pair longs and shorts in the same sector. For instance, in 2024 if a fund was long Nvidia and short Intel (another stock in the semiconductor sector), that would have been a big net win. Sometimes this works, and sometimes it doesn’t.

The actual performance of such a fund is very dependent on the active managers’ skill and luck. For instance, here is a ten-year total return plot of two market-neutral funds, one from AQR and the other from Vanguard. The Vanguard fund (VMNIX) muddled along pretty flat from 2015 through 2021, then had a slow rise 2021-2023, then went flat again. The performance of the AQR fund (QMNNX) has been more erratic. It went up 2015-2017, then down a lot (this would have been hard to bear at the time, when the S&P was roaring upward) for 2018-2020. It then roughly matched the Vanguard fund for a couple of years, then pulled way ahead 2023-2025, as it made some great long/short choices:

However, the ten-year performance of these funds fell far short of a simple S&P500 holding (blue line above). Since stocks go up the vast majority of the time, a long-short fund which is net long seems to make more sense.

A plain vanilla net-long long-short fund is FTLS. It seems to be among the best of the long-short ETFs. It is usually about 60% net long. I modeled its performance against a portfolio of 60% S&P 500 stocks and 40% cash (rebalanced periodically), and it performed about the same. That is, FTLS went up and down with moves about 60% of what the S&P did. That is OK, but one might wonder why one would hold such a fund instead of just holding a 60/40 stocks/cash allocation for the same amount of investment. If we look at time periods with appreciable down periods, such as the past three years (see chart below), FTLS does look comforting; its muted dips in 2022 and 2025 compensate for its slower rise in 2023-2024, so it presents as a slow, fairly steady rise with a 3-year total return slightly higher than S&P. It is certainly easier psychologically to hold such a fund, and it might help small investors avoid the deadly mistake of panic-selling during a market downturn.

CLSE is a long-short fund that is often about 70% long. Management there takes a more swashbuckling, risk-taking approach. It went down less than S&P in the bear market of 2022 (as expected), and then it soared high above S&P in the first half of 2024, as it made skillful/lucky picks to go very long tech growth stocks like NVDA. That tech-heavy approach has backfired so far in 2025, since CLSE has fallen as much as S&P in the past several months (NOT what one hopes for a long-short fund). Despite that glitch, however, CLSE still weighs in with a 3-year return far ahead of the broader S&P (39% vs. 23%):

Another strategy to mitigate market ups and downs is for a stock fund to buy and sell put and call options, to create a “collar” effect. Buying puts limits the downward movements; the puts are financed by selling calls, which limits the upward swings. The fund ACIO, for instance, seeks to capture 65% of the S&P’s upside, while limiting loss to 50% of the downside.  In my stock charting, I found it ended up performing about like FTLS.  As of a week ago (Tue, Apr 8), the S&P was down 15% year to date (i.e., since Jan 1), while FTLS and ACIO were only down 8.3 % and 9.6%, respectively.

Standard Disclaimer: This is for information only. Nothing here is advice to buy or sell any security.

The Wild Market of July 8th, 2025

April 2nd drove the point home- when someone in a position to know tells you something big is coming on a precise date, it is a smart time to act. As opposed to doing what I have done, which is think about acting but ultimately do nothing.

Ahead of April 2nd this year, the White House made a big deal of how they had a big announcement on trade coming April 2nd and I thought “this could go better or worse than markets expect, but some big move is coming, this seems like a great time to invest in volatility through something like VIX options expiring shortly after April 2nd”, but then I didn’t buy VIX options. I didn’t totally understand how they worked, didn’t want to buy without finding out, and didn’t make time to find out. My instinct was right though- the VIX more than doubled last week, so the right options on it much more than doubled. 

Ahead of the war in Ukraine in February 2022, US intelligence warned that Russia was planning to invade imminently, and I thought “they don’t have a great recent track record but it is very unusual for them to announce something so big will happen so soon, this is probably happening, this would be a good time to buy puts” but then didn’t buy puts, which of course did great as markets crashed following the invasion.

Yesterday the S&P 500 shot up 9% on the news that most of Trump’s new tariffs were paused. I thought this reaction was excessive given that the tariffs weren’t canceled, merely paused 90 days. Note that an exact date is being offered- July 8th! I sold some stocks last night and put in orders for S&P puts and VIX calls, but the limit options orders didn’t fill today as it seems the market caught up to my take from last night. The S&P is down 4% as I write this. This morning I was was researching which puts to buy, leaning toward SPY or XSP at-the-money puts for July 19 (first options date available after the 90-day tariff delay expires), then markets opened and their prices jumped 20+% in seconds as I watched. They are up over 50% now.

It is possible that the administration will fully clarify their stance on tariffs one way or another before July 8th, or even that Congress takes back their tariff power before then and makes their own deal. But I think it is more likely than not that we get a big announcement from the White House on July 8th about which tariffs will be implemented. In which case July 8th will be another wild market day.

This may already be priced in, but so far this April the situation has been changing so rapidly and touching so many parts of the markets and the real economy that even some of the most efficient markets (like US stock and bond markets) seem to be struggling to process what is happening. My ill-timed post from November praising the S&P has some lines that hold up well:

I’m now back up to 90% belief in efficient markets, at least for stocks.

This efficiency seems to change a lot over time. Probably fewer than 10% of US stocks have obvious mis-pricings right now; really none stand out as super mispriced to a casual observer like me. Instead, it seems like every 10 years or so a broad swathe of the market is driven crazy by a bubble or a crash, and you get lots of mispricing- like tech in 2000, forced/panic selling at the bottom in 2009, or meme stocks in 2021. The rest of the time, the stock market is quite efficient. So, in typical times, just be boring and buy and hold a broad index fund.

Ever since April 2nd, we have not been in typical times. At some point they will return and most people are probably best served by just holding through this (selling at the bottom and never getting back in is a big failure mode in investing). But for now the tariffs still have me thinking about buying VIX calls and stock puts (especially when policy changes loom on certain dates like July 8th), and on the bigger question of finding the sort of investments that did well in the 1970’s, another decade of stagflation that was kicked off by a President who broke America’s commitment to an international monetary system that he thought no longer served us.

When Genius Failed

Myron Scholes was on top of the world in 1997, having won the Nobel Prize in economics that year for his work in financial economics, work that he had applied in the real world in a wildly successful hedge fund, Long Term Capital Management. But just one year later, LTCM was saved from collapse only by a last-minute bailout that wiped out his equity (along with that of the other partners of the fund) and cast doubt on the value of his academic work.

Roger Lowenstein told the story of LTCM in his 2001 book “When Genius Failed“. I finally got around to reading this classic of the genre this year, and I’d say it is still well worth picking up. The story is well-told, and the lessons are timeless-

  • Beware hubris
  • Beware leverage
  • Bigger positions are harder to get out of (especially once everyone knows you are in trouble)
  • In a crisis, all correlations go to one
  • Past results don’t necessarily predict future performance
  • Sometimes things happen that are very different from anything that happened in your backtest window.

The book came out in 2001 but it presages the 07 financial crisis well- not about mortgage derivatives specifically, but the dangers of derivatives, leverage, using derivatives to avoid regulations restricting leverage, and over-relying on mathematical models of risk based on past behavior. If Fed had let LTCM fail, could we have avoided the next crisis? Perhaps so, as their counterparties (most major Wall Street banks) who got burned would have been more careful about the leverage and derivatives used by themselves and their counterparties, and regulators may have taken stronger stances on the same issues.

Perhaps some more recent well-contained blowups foreshadow the next big crisis in the same way, like FTX or SVB?

Some more specific highlights about LTCM:

Continue reading

Trump’s National Sales Tax

Tariffs are going up to levels last seen in the 1930 Smoot-Hawley tariffs that helped kick off the Great Depression:

Tariffs are taxes- roughly, a national sales tax with an exemption for domestically-produced goods and services. I think the words make a difference here- “raising tariffs on countries who we run a trade deficit with” just sounds abstruse to most people, while “raising taxes on goods bought from firms in net-seller countries” sounds negative, but they are the same thing.

Of course, in this case the plan is to raise taxes to at least 10% on goods from all other countries even if they aren’t net-sellers, and raise taxes up to 49% on those that are. This is not a negotiating tactic. We know this from the math- the new tax formula uses net imports from a country rather than a country’s tariff rates, so a country could cut their tariffs on US goods to zero today and it wouldn’t necessarily reduce our “reciprocal” tariffs at all; at best it would reduce them to 10%. We also know it isn’t about negotiating because the administration says it isn’t. Their goal, obviously, is to reduce trade, not to free it.

They say they are doing this to bring manufacturing back to America and to promote national defense. But American manufacturers don’t seem happy. Even before the latest huge tax increase, trade war was their biggest concern:

The National Association of Manufacturers Q1 2025 Manufacturers’ Outlook Survey reveals growing concerns over trade uncertainties and increased raw material costs. Trade uncertainties surged to the top of manufacturers’ challenges, cited by 76.2% of respondents, jumping 20 percentage points from Q4 2024 and 40 percentage points from Q3 of last year.

The National Association of Manufacturers responded to the latest tax increase with a negative statement; so even the one major group that might have benefitted from tariffs is unhappy. Foreign producers and US consumers will of course be very unhappy. I think Trump is making a huge political blunder alongside the economic one- he got elected largely because Biden allowed inflation to get noticeably high, but now Trump is about to do the same thing.

I also see this as a huge national security blunder. For tariffs on China, I at least see their argument- we should take an economic hit today in order to become less reliant on our peer-competitor and potential adversary. But the tariffs on allies make no sense- they are hitting the very countries that are most valuable as economic and/or military partners in a conflict with China, like Canada, Mexico, Japan, South Korea, Vietnam, India, and Taiwan (!!!). One of our biggest advantages vs. China has been that we have many allies and they have few, and we appear to be throwing away this advantage for nothing.

What can you or I do about this? Stock up on durable goods before the price increases hit. Picking investment winners is always hard, but things this makes me consider are gold, stocks in foreign countries that trade little with the US, and companies whose stocks took a big hit today despite not actually being importers. Finally, we can try nudging Congress to do something. The Constitution gives the power to levy taxes to the legislative branch, but in the 20th century they voted to delegate some of this power to the executive. Any time they want, Congress could repeal these tariffs and take back the power to set rates. I have some hope they actually will- just yesterday the Senate voted to repeal some tariffs on Canada, and more votes are planned. The alternative is to risk a recession and a wipeout in the midterms:

Are You A Business, Man? The Surprising Benefits Of A Sole Prop and IRA

I never thought of myself as a businessman- until 2015 when the IRS told me I was, and that I therefore needed to pay them more money to cover the self-employment tax. Naturally I was confused and angry about this at first, but in the long run it turns out they were doing me a favor.

If you make a tiny amount of 1099-MISC or 1099-NEC income on occasion, the IRS is probably* fine with characterizing this as ordinary income from a hobby. But if you earn 1099 income at all regularly, they will likely want to characterize you as a business, and want you to pay a self-employment tax similar to the payroll tax that W2 employees pay (though it will look higher to you, since you will pay both the employee and employer halves of the tax). If you make an intermediate amount of 1099 income, you might have the choice of whether to call this hobby income or business income; I had thought it would be better to avoid the complications and extra taxes of being a business, but it turns out that being a business unlocks new opportunities for deductions than can far outweigh the self-employment tax.

For example, a home office, business-related travel expenses, and advertising expenses can be deductible. For a writer, this could cover conferences, website expenses, computers, and much more. It also means you can start a SEP IRAin addition to a personal IRA if you like. This alone could allow you to deduct thousands of dollars in income per year (technically up to $69k if you make at least $276,000 per year in business income, though if you make that much, you’re the one who should be giving me advice). The SEP IRA has the advantage over a personal IRA of a much higher income limit and, potentially a higher contribution limit, though again the beauty is that you don’t have to choose- you can just do both.

While this post is mainly about business, I also think regular IRAs might still be underrated. I didn’t start one until 2022, but I should have done it much earlier. First I thought I was too poor (low income, then higher income but with student loans to pay off first), then I thought I was too rich (above the income limits). It turns out though that you can still start a personal IRA even when you are above the income limits- it just means you only get one tax benefit instead of two, but that one tax benefit is still pretty good.

Every IRA has the benefit of investments growing tax-free; if you meet the income limits then IRAs get the additional benefit of avoiding income taxes either when you put the money in (for traditional) or when you pull it out (for Roth). But even if you “only” get the benefit of tax free growth, that can still be a huge monetary benefit depending on your investment strategy. It is also a big time benefit- every taxable brokerage account means at least one** extra tax form to deal with every year, while an IRA account avoids this.

Another great benefit to IRAs (SEP or regular) is that you can still start one now and make contributions for the 2024 tax year. I was just doing my taxes and kicking myself for not doing some things differently back in 2024 when it would have helped; but IRAs are like a form of time travel where you can still go back and fix things, at least until April 15th.

*Disclaimer- Not official tax advice, I’m not an accountant, I’m just a 37 year old guy with lifetime 1-1-1 record against the IRS. Three times they have told me I owed them more than I paid on a tax return. Once I won (I told them I owed nothing and explained why, and they agreed). Once I lost (I told them oh shit, you’re right and paid them). For the story I started this post with, I call it a draw (they told me I owed them X, I told them I owed nothing and explained why, then they told me I actually owed them 1/3X and I just paid it).

**More than one if like me you accidentally invest in a partnership and as a result get a K-1 on top of the usual 1099-DIV for that overall brokerage account

HT: Trinette McGoon

Perspective: This Stock Correction Fear, Too, Will Pass

For what it’s worth, I will pass along a couple of points from an optimistic take on the current stock market pullback, by Seeking Alpha author Dividend Sensei. The article is “History Says Shut Up And Buy: 12 Hyper-Growth Blue Chips To Buy Right Now”. His thesis is that corrections come and go as specific fears come and go, but tech stocks only keep going up, so now is a good time to buy.

History seems to be on his side. Below is a 25-year plot of the NASDAQ 100 fund QQQ. It is true that on a really long scale, any significant dip would have been a good buying opportunity. And the run-up since 2016 has been astonishing.  $10,000 invested then would be about $50,000 now. I find it sobering, however, that (just going by eyeball) it took about fourteen years for QQQ to regain its 2000 peak. That might be longer than most investors want to wait. And in the shorter term, these tech stocks lost some 80% of their market value between 2000 and 2002, and revisited that low in 2008. We can look back now from decades later and call this a “dip”, but at the time it felt like an endless investment nightmare.

(I should add that the 2000 peak pricing was not supported by appreciable cash earnings, but by breathless hype about this new thing called the “internet” that was going to change EVERYTHING. This past year has seen similar hyperventilation over AI, but in contrast to 2000, now the big tech firms make ginormous gobs of money, and gobs more each year. So maybe it really is different this time…)

QQQ total return since March 1, 1999; % scale. From Seeking Alpha.

The Psychology of Market Corrections

The author pointed out that every correction is based on some deep fear, and eventually that fear dissipates. I thought this table he showed of the fear factors involved in the 30 or so stock market pullbacks since the March 2009 low was interesting and instructive:

The type here may be hard to read, so I will repeat here the two most recent “fears” listed, both from 2024:

March 28-Apr 19 (5.9% drop): “Stubborn Inflation, Fed Pushing Back Rate Cuts, Iran/Israel Conflict”

July 16-Aug 8 (9.7% drop): “Disappointing earnings results, Recession Fears, Fed Behind Curve”

These are recent enough that any market-engaged reader here will resonate with these concerns which loomed so large at the time. And yet, the collective market shrugged them all off to post a robust 21% gain for all of 2024.

Where do we go from here? I have no idea. As of writing this Tuesday morning, we seem to be bumping along at a level 2-3% higher in QQQ than the lows last week, but still 10-11 % lower than a month ago. This has brought it to levels of about late September, 2024. If I look at a five-year log plot and draw an eyeball-fit straight line through it all, it seems like prices went above that line for Nov-early Feb, in a burst of post-election enthusiasm, but have now come back to the trendline. Barring some macro or geopolitical disaster, therefore, one might expect QQQ to trend 10-15 % higher in the next twelve months (with a standard deviation of another 10% or so around the trendline). But as old-time Yankees catcher Yogi Berra said, “It’s tough to make predictions, especially about the future.”

Disclaimer: Nothing here should be considered advice to buy or sell any security.

Michigan Consumer Surveys: Individual-Response Data

I’ve now posted individual-level responses to the 1978-2025 Michigan Consumer Surveys to Kaggle in CSV and Stata formats. The University of Michigan’s Consumer Surveys are a widely followed source for data on consumer confidence and inflation expectations:

Their official site is good if you just want summary tables or charts like this:

But what if you want detailed crosstabs to see how sentiment differs for different groups, or microdata so that you can run regressions? With enough clicks you can get this from what UMich calls their “cross-section archive“. But it is pretty hidden, my student looking into this thought they just didn’t offer individual-level data; and even once you get their data, it is in an unlabelled CSV file with hard-to-understand variable names and codes. So I wanted to make it clear that the full data with all responses for all years is available, and if you use my Stata version it is even reasonably easy to understand (the code I adapted for labelling it is on OSF). Then you can run your regressions, or make charts like this:

The College-Only Covid Recovery

If you’re new here, a reminder that you can find other cleaned-up versions of popular datasets on my data page.

Is This a Stock Market Correction or a Bear Market?

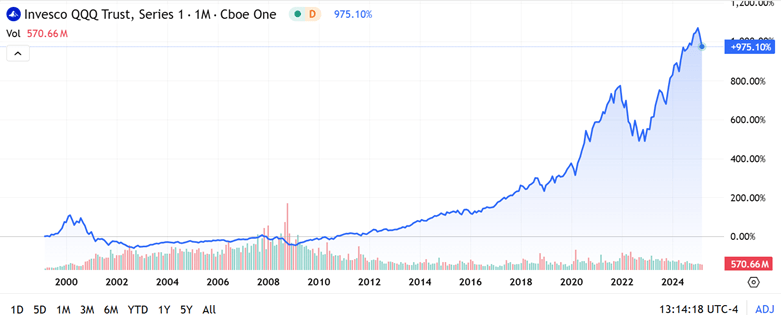
As of the market open today, tech stocks (e.g. the NASDAQ 100 fund QQQ) are down more than 10% from their recent highs. The broader S&P 500 fund SPY is down about 8%. Hands are wringing…what does it all mean?

By applying standard definitions, we can know exactly what it means:

A pullback is a market drop of 5-10% and is very short term.  It is a dip from a recent high during an ongoing bull market while upward momentum is still intact, and is a normal adjustment to a market cycle.

The market is in correction phase” after a drop between 10-20% and can last a few months. These moves are typically met with higher volatility.  Corrections can be violent as investors’ fear levels rise and panic selling may hit the market.

Real time news and social media can intensify this fear as investors may follow the herd mentality.   The average market correction lasts anywhere between two and four months and is frequently accompanied by adverse market conditions.  However, corrections are often seen as ideal times to buy high-value stocks at discounted prices.

So, technically, the S&P has experienced a “pullback”, while the NASDAQ 100 has undergone a “correction”. Just to round out the infernal trinity of market moves with a definition of a “bear market”:

A bear market occurs after a drop of 20+% over at least a two-month time frame.  In a bear market, investor confidence has been shattered and many investors will sell their stocks for fear of further losses.  Trading activity tends to decrease as do dividend yields.

Bear markets tend to become vicious cycles when rallies are sold and not bought This happened in 2000 and 2007 and can typically be seen on charts as the market makes lower lows and lower highs.  Bear markets tend to occur in the contraction phase of the business cycle and last, on average, approximately 16 months.

You don’t know if you are really in a bear market until things get really bad, at which point it is probably too late to sell. (Amateurs get discouraged and sell AFTER stocks have dropped, which is why the average investor does appreciably worse than the accounts of dead people where stocks just sit there without being traded). When stocks recover at least 20% following a bear market over at least a two-month period, that is defined as the start of a new bull market regime.

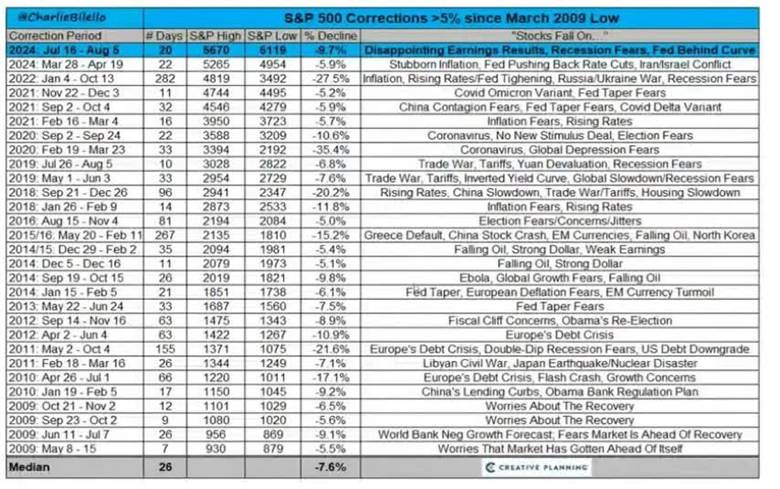
Having a correction (i.e. 10-20% dip) in the middle of a bull market year is pretty normal. Although whole-year market returns have been positive for 34 out of the past 45 years, the typical year experiences a correction averaging 14%.

None of this vocabulary clarification answers the practical question of how bad will the current pullback/correction get? As usual, I read argument on both sides. The bears are saying (a) what they have been saying since 2018 or so, that the market is unrealistically overvalued, and (b) the macroeconomic world is about to fall apart, which they have also been saying for years. This time may be different, with the new administration’s erratic policies, but history shows that so far, the market is not much correlated to who is in the West Wing.

The bulls are saying (a) the market values did get run up unrealistically after the election and with AI hype, so the current pullback is just a healthy reset to a level for resuming further market growth, and (b) despite negative talking, the actual numbers show decent employment and GDP, so macro is OK (and it is very rare to have an actual bear market absent a serious bad macroeconomic driver).

If I really knew the answer here, I would be writing this from my private Caribbean island. But I’ll share how I am playing it. For the past 15 years or so, it has nearly always worked well to buy in after a say 10% correction. What seemed so gut-wrenching and scary at the time almost always turns into just a blip on the endlessly rising market charts in hindsight.

I had set aside some “dry powder” funds specifically to take advantage of buying opportunities like now. So, I am manfully mastering my fears and buying small amounts every couple days of 2X levered funds like SSO and QLD. (See here for discussion of such funds, they go up or down $2 for every $1 the underlying S&P or NASDAQ go up or down, so it’s kind of like being able to buy twice as much stock for the same dollar amount. But as usual, caveat emptor).

But I am not going all-in on any particular day. It is always frustrating to miss buying right at the bottom, but nobody rings a bell there, either. I have searing memories of March 2020 and of 2008 when just when you thought the bottom was in, it dropped out the next day or week.

Disclaimer: Nothing here should be considered advice to buy or sell any security.

Trump’s Economic Policy Uncertainty

I was on a panel of economists last night at an event titled “The Economic Consequences of President Trump”. We each gave a 5-minute summary from our area of expertise and then opened up the floor for questions.  This is a truncated summary of my talk. Since the panel included an investor, two industry economists, and another macro economist, I wanted to discuss something that was distinct from their topics. I’ve published a paper and refereed many articles concerning economic policy uncertainty (EPU) and asset volatility. I wanted to look at the data concerning President Trump – especially in contrast to Presidents Obama and Biden.

EPU matters because uncertainty can cause firms and individuals to delay investment and hiring decisions. Greater uncertainty can also cause divergent views concerning forecasted firm profitability. The result is that asset prices tend to become more volatile when EPU rises. One difficulty is that uncertainty occurs in our heads and concerns our beliefs, making it hard to measure. We try to get at it by measuring how often news media articles include the terms related to uncertainty, policy, and the economy. Since news content tends to report what is interesting, relevant, or salient to customers, there’s good reason to think that the EPU index is a decent proxy.

Using the Obama years as a baseline, the figure below simply charts out EPU. It was relatively low during Trump’s first term and then it was higher during Biden’s term – even after accounting for the Covid spike. The sharp increase toward the end is after Trump won the 2024 election. The EPU series conflicts with my perception of social media and media generally. My experience was that the media was far more attentive to the uncertainty that Trump caused. But, it may just be that the media outlets had plenty to report on rather than it being particularly indicative of EPU. After all, if the president exercises his power, then there is a certain swift decisiveness to it.

But if we look at a couple of particular policy areas, Trump’s administration faired worse. Specifically, Trump caused a ruckus concerning trade policy and immigration. Remember when Biden continued the aggressive trade policy that Trump had adopted? That’s consistent with lower EPU. Similarly, Biden made the immigration process much easier and faster while Trump’s deportation haranguing results in a somewhat stochastic means by which people are deported.  Again, that spike at the end is after Trump won the 2024 election.

Continue reading