The Comeback of Gold as Money

According to Merriam-Webster, “money” is: “something generally accepted as a medium of exchange, a measure of value, or a means of payment.”  Money, in its various forms, also serves as a store of value.  Gold has maintained the store of value function all though the past centuries, including our own times; as an investment, gold has done well in the past couple of decades. I plan to write more later on the investment aspect, but here I focus on the use of physical gold as a means of payment or exchange, or as backing a means of exchange.

Gold, typically in the form of standardized coins, served means of exchange function for thousands of years. Starting in the Renaissance, however, banks started issuing paper certificates which were exchangeable for gold. For daily transactions, the public found it more convenient to handle these bank notes than the gold pieces themselves, and so these notes were used instead of gold as money.     

In the late nineteenth and early twentieth centuries, leading paper currencies like the British pound and the U.S. dollar were theoretically backed by gold; one could turn in a dollar and convert it to the precious metal. Most countries dropped the convertibility to gold during the Great Depression of the 1930’s, so their currencies became entirely “fiat” money, not tied to any physical commodity. For the U.S. dollar, there was limited convertibility to gold after World War II as part of the Bretton Woods system of international currencies, but even that convertibility ended in 1971. In fact, it was illegal for U.S. citizens to own much in the way of physical gold from FDR’s (infamous?) executive order in 1933 until Gerald Ford’s repeal of that order in 1977.

So gold has been essentially extinct as active money for nearly a hundred years. The elite technocrats who manage national financial affairs have been only too happy to dance on its grave. Keynes famously denounced the gold standard as a “barbarous relic”, standing in the way of purposeful management of national money matters.

However, gold seems to be making something of a comeback, on several fronts. Most notably, several U.S. states have promoted the use of gold in transactions. Deep-red Utah has led the way.  In 2011, Utah passed the Legal Tender Act, recognizing gold and silver coins issued by the federal government as legal tender within the state. This legislation allows individuals to transact in gold and silver coins without paying state capital gains tax.  The Utah House and Senate passed bills in 2025 to authorize the state treasurer to establish a precious metals-backed electronic payment platform, which would enable state vendors to opt for payments in physical gold and silver. The Utah governor vetoed this bill, though, claiming it was “operationally impractical.” 

Meanwhile, in Texas:

The new legislation, House Bill 1056, aims to give Texans the ability, likely through a mobile app or debit card system, to use gold and silver they hold in the state’s bullion depository to purchase groceries or other standard items.

The bill would also recognize gold and silver as legal tender in Texas, with the caveat that the state’s recognition must also align with currency laws laid out in the U.S. Constitution.

“In short, this bill makes gold and silver functional money in Texas,” Rep. Mark Dorazio (R-San Antonio), the main driving force behind the effort, said during one 2024 presentation. “It has to be functional, it has to be practical and it has to be usable.”

Arkansas and Florida have also passed laws allowing the use of gold and silver as legal tender. A potential problem is that under current IRS law, gold and silver are generally classified as collectibles and subject to potential capital gains taxes when transactions occur. Texas legislator Dorazio has argued that liability would go away if the metals are classified as functional money, although he’s also acknowledged the tax issue “might end up being decided by the courts.”

But as Europeans found back in the day, carrying around actual clinking gold coins for purchasing and making change is much more of a hassle than paper transactions. And so, various convenient payment or exchange methods, backed by physical gold, have recently arisen.

Since it is relatively easy and lucrative to spawn a new cryptocurrency (which is why there are thousands of them), it is not surprising that there are now several coins supposedly backed by bullion. These include include Paxos Gold (PAXG) and Tether Gold (XAUT). The gold of Paxos is stored in the worldwide vaults of Brinks, and is regularly audited by a credible third party. Tether gold supposedly resides somewhere in Switzerland. The firm itself is incorporated in the British Virgin Islands. Tether in general does not conduct regular audits; its official statements dance around that fact. These crypto coins, like bullion itself or various funds like GLD that hold gold, are in practice probably mainly an investment vehicle (store of value), rather than an active medium of exchange.

However, getting down to the consumer level of payment convenience, we now have a gold-backed credit card (Glint) and debit card (VeraCash Mastercard). Both of these hold their gold in Swiss vaults. The funds you place with these companies have gold allocated to them, so these are a (seemingly cost-effective) means to own gold. If you get nervous, you can actually (subject to various rules) redeem your funds for actual shiny yellow metal.

Corporate Debt by Industry Sector

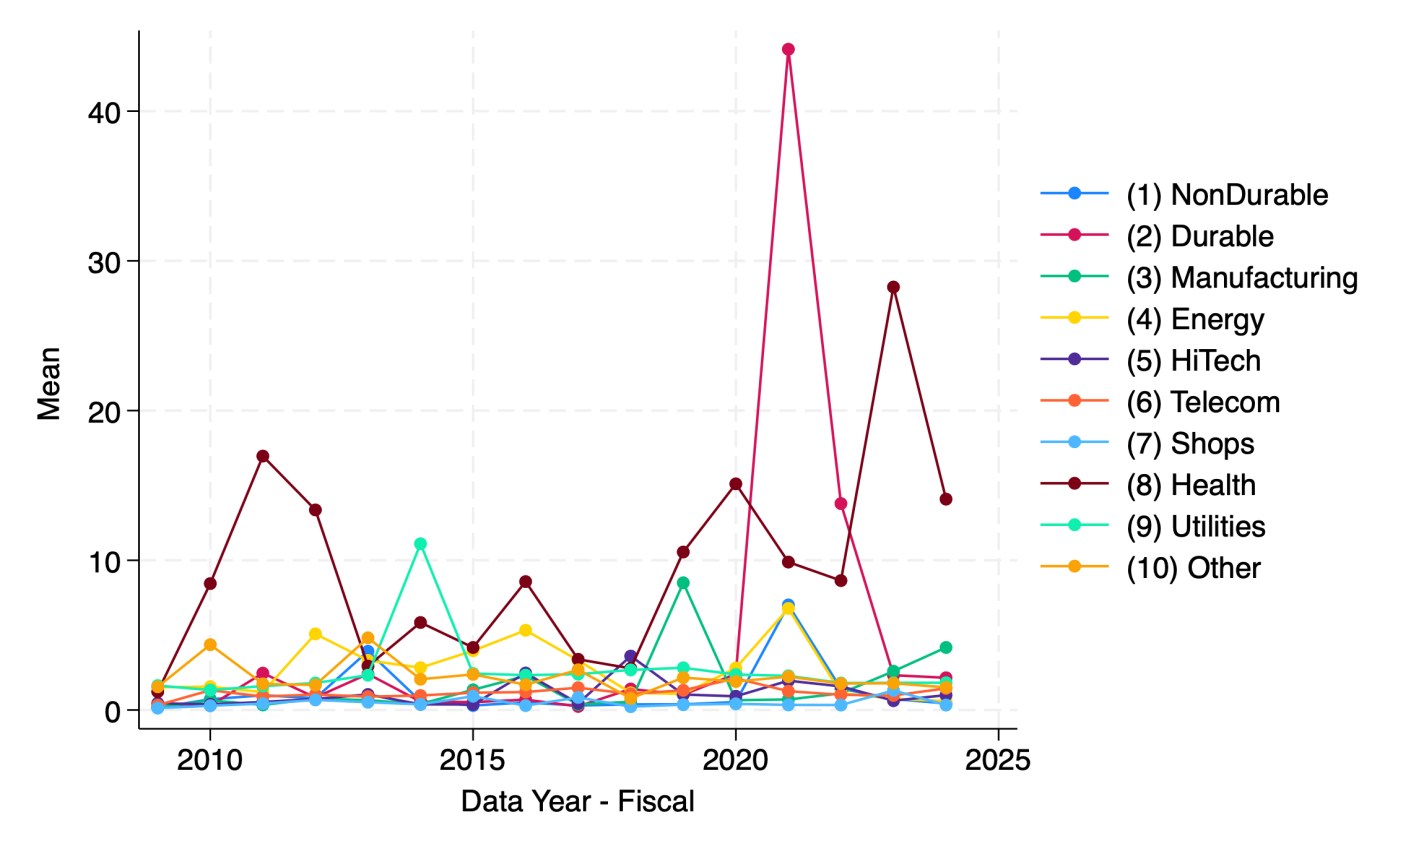
A reporter recently told me she thought there is a national trend toward hospitals issuing more bonds. I tried to verify this and found it surprising hard to do with publicly available data. But once I had to spend an hour digging through private Compustat data to find the answer, I figured I should share some results. Here’s the average debt in millions of companies by sector:

Source: My graph made from Compustat North American Fundamentals Annual data collapsed by Standard Industrial Classification code into the Fama-French 10 sectors

This shows that health care is actually the least-indebted sector, and telecommunications the most indebted, followed by utilities and “other” (a broad category that actually covers most firms in the Fama-French 10). But are health care firms really more conservative about debt, or are they just smaller? Let’s scale the debt by showing it as a share of revenue:

My graph made from Compustat North American Fundamentals Annual data collapsed by SIC code into the Fama-French 10 sectors (dltt/revt).

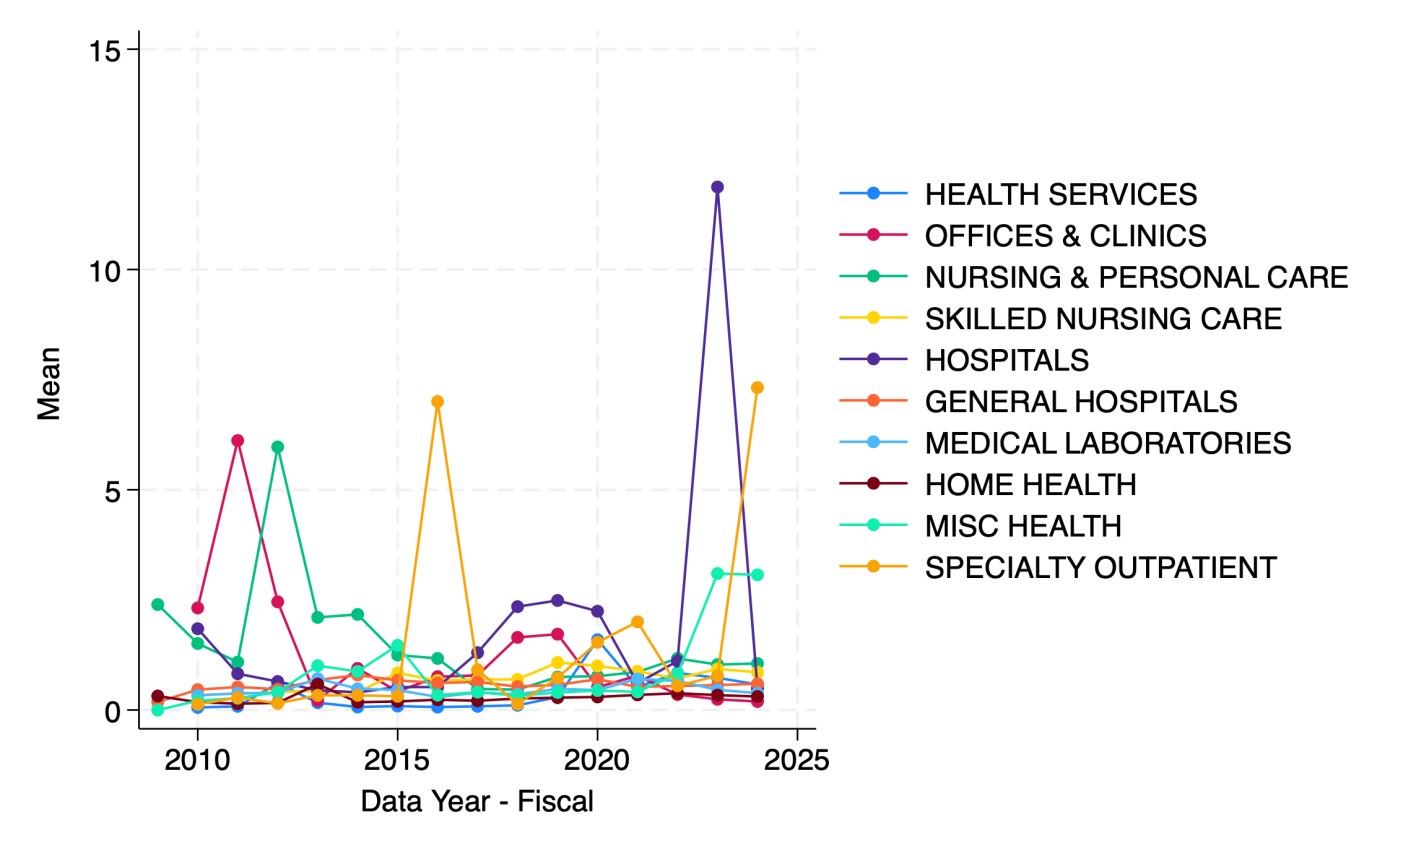
It appears that health care firms are the most indebted relative to revenue since 2023. But which parts of health care are driving this?

Hospitals in 2023 followed by specialty outpatient in 2024. However, seeing how much the numbers bounce around from year to year, I suspect they are driven by small numbers of outlier firms. This could be because Compustat North America data only covers publicly traded firms, but many sectors of health care are dominated by private corporations or non-profits.

I welcome suggestions for datasets on the bond-market side of things that are able to do industry splits including private companies, or suggestions for other breakdowns you’d like to see me do with Compustat.

United Health Care Stock Implodes After Withdrawing Guidance, CEO Suddenly Resigns, and WSJ Alleges DOJ Fraud Probe

The United Healthcare Group (UNH) is a gigantic ($260 B market cap, even after recent dip) health plan provider, which until recently seemed to be the bluest of blue-chip companies. It is a purveyor of essential medical services with a wide moat, largely unaffected by tariff posturing, and considered too big to fail. The ten-year stock price chart shows it steadily grinding up and up, shrugging off market tantrums like 2020 and 2022, and even the tragic gunning down of one of its division presidents in December.

But things really unraveled in the past month. Let’s look at the charts, and then get into the underlying causes.

The year-to-date chart above shows the price hanging around $500, then rising to nearly $600 as the April 17 quarterly earnings report approached. Presumably the market was licking its chops in anticipation of the usual UNH earnings beat. The actual report was OK by most corporate standards, but it failed to match expectations. Revenue growth was a hearty +9.8% Y/Y, but this was $2.02B “miss”. Earnings were up 4% over year-ago Q1, but they missed expectation (by a mere 1%). What was probably much more disturbing was guidance on 2025 total adjusted earnings down to $26 to $26.50 per share, compared to $29.74 consensus.

That took the stock down from $600 to around $450 immediately, and then it drifted below $400 in the following month as investors looked for and failed to find better news on the company. But then two things happened last week. The effects are seen in the 1-month chart below:

On May 13 (blue arrow) the company came out with a stunning dual announcement. It noted that the recently-appointed CEO, Andrew Witty, had suddenly resigned “for personal reasons.” The blogosphere speculated (perhaps unfairly) that you don’t suddenly resign from a $25 million/year job unless your “personal reasons” involve things like not going to prison for corporate fraud. The other stunner was that the company completely yanked 2025 financial guidance, due to an unexpected rise in health care costs (i.e., what they must pay out to their participants). Over the next day or two, the stock fell to about 50% of its value in early April.

Then on May 14 the Wall Street Journal came out with an article claiming that the U.S. Department of Justice is carrying out a criminal investigation into UNH for possible Medicare fraud, focusing on the company’s Medicare Advantage business practices. The WSJ said that while the exact nature of the allegations is unclear, it has been an active probe since at least last summer.

UNH promptly fired back a curt response to the “deeply irresponsible” reporting of the WSJ:

We have not been notified by the Department of Justice of the supposed criminal investigation reported, without official attribution, in the Wall Street Journal today.

The WSJ’s reporting is deeply irresponsible, as even it admits that the “exact nature of the potential criminal allegations is unclear.”   We stand by the integrity of our Medicare Advantage program.

The stock nose-dived again (red arrow, above), touching 251, as investors completely panicked over “Medicare fraud.”  Cooler heads promptly started buying back in, leading to substantial recovery. That includes the new CEO, Steven Hemsley, who was the highly-paid CEO from 2009 to 2017, and since then has been the highly-compensated “executive chairman of the board”, a role created just for him. Pundits were impressed that he stepped in to buy some $25 million of UNH stock near its lows, saying wow, he is really putting some skin in the game. Well, not really: the dude is worth over $1 billion (did I mention high compensation of health care execs?), so $25 mill is hardly heroic. He is already up some 12% or a cool $3 million on this purchase, a tidy little example of how the rich become richer.

Learnings From Trading Short Volatility Funds, 2. Use Leveraged Stock Funds Instead

In last week’s post, I described how short volatility funds work. They are short (as opposed to long) near-term VIX futures. This means that when a market panic hits and VIX (as measure of volatility) spikes, the prices of these short vol funds plunge, along with stock prices. But as optimism returns to the markets, prices of short vol funds start to recover, as do stocks.

Thus, both short vol funds and general stock funds are reasonable ways to play a market panic. If (!!!) you manage to call the bottom and buy there, you can hold for maybe a couple of weeks until prices recover, and then sell at a profit.  I tried to do just that with the market meltdown last month in the wake of the president’s tariff ultimatums: I bought some short vol funds (SVXY, which is a moderate -0.5X VIX fund, and the more aggressive -1X fund SVIX), and also some leveraged stock funds. I discussed leveraged funds here.

I chose to buy into SSO, a 2X leveraged S&P 500 stock fund, whose daily price moves up (or down) by twice the percentage as does the S&P. Obviously, if you think stocks will go up say 10% in the next month, you will make more money by buying a fund that will go up 20% instead, which is why I bought a 2X fund rather than a plain vanilla (1X) stock fund. A related fund, which I did not buy this time, is UPRO, which is a 3X stock fund.

Things are always clear in hindsight. After the smoke of battle clears, you can see right where the bottom was. But it is not clear when you are in the thick of it. I erred by committing much of my dry powder trading funds too early, maybe halfway through the big drop. C’est la vie. It’s hard to improve on that for next time. But a significant learning, that I will act on during the next panic, was how differently short vol versus leveraged stocks recovered from the crash. They both plunged and recovered, but leveraged stocks recovered much better.

It turns out that much of the time, the price movements over say a six-month period of SVXY and SSO largely match each other, so these are useful for comparisons for trading short vol versus leveraged stocks. For instance, below is a chart of SVXY (orange line) and SSO (green line) over the past six months or so. The blue arrow notes the April crash, which bottomed roughly April 8. For November through early April, the price movements of the two funds roughly matched. By April 8, both had plunged to a level some 35% lower than their starting prices. However, by May 12, SSO had recovered to -10% (relative to starting), which is about where it was in late March (green level line drawn in). SVXY, however, remained 21% below its start.

Chart of SVXY ( -0.5X VIX ETF, Orange line) and SSO (2X Stock fund, green line), Nov 2024-May 2024. Blue arrow marks April 2025 volatility spike/stock crash. Chart from Seeking Alpha.

Thus, from its nadir (-35%) to its recovery as of Tuesday, May 12, SSO gained by 38% (i.e., ratioing 0.90/0.65), whereas SVXY gained only 21% (from ratioing 0.79/0.65). Also, it looks like SVXY will not regain its earlier price levels any time soon. So SSO looks like the winner here.

We can do a similar comparison between the -1X VIX fund SVIX and the 3X stock fund UPRO. These two funds are plotted below, along with a plain (1X) S&P 500 stock fund, SPY (in blue). SVIX (orange) and UPRO (green) trend pretty closely for October through March. When the April crash came, SVIX dropped much harder, down to a heart-stopping -59%, compared to -44% for UPRO. SPY dropped only to -15%.  SPY comes to a full recovery (0%) by May 12, while UPRO recovers only to -13% [1].    SVIX has recovered only to -21%. If you managed to buy each of these funds on April 8, and sold them today, you would have made the following gains:

SPY 17% ; UPRO 55%;  SVIX  43%.    Clearly the winner here in short term trading of the April crash is the 3X stock fund UPRO.

Chart of SVIX ( -1X VIX ETF, Orange line), UPRO ( 3X Stock fund, green line), and SPY (1X Stock fund, blue line), Oct 2024-May 2024. Chart from Seeking Alpha.

As a cross check, below is a plot of SVXY (orange) and SSO (green) covering the August, 2024 volatility spike. This was a peculiar event, discussed here, where volatility went crazy for a couple of days, while stock prices experienced only a moderate drop. If (!!!) you timed it just right, and bought at the bottom and sold a week or so later, you could have made good money on SVXY. But zooming out to the larger picture, SVXY never came close to recovering its old highs, whereas SSO just kept going up and up (green arrow). So SSO seems like a safer trading vehicle: it is a reasonable buy-and-hold, whereas SVXY may be hazardous to your portfolio’s health if you don’t get the timing perfect.

Chart of SVXY ( -0.5X VIX ETF, Orange line) and SSO ( 2X Stock fund, green line), Oct 2023-Oct 2024. Blue arrow marks early August 2024 volatility spike. Chart from Seeking Alpha.

Over certain longer (say one-year) periods, there are regimes where short vol could out-perform leveraged stocks (discussed earlier), but that is the exception, rather than the rule.

Disclaimer: Nothing here should be considered advice to buy or sell any security.

ENDNOTE

 [1] While UPRO changes X3 the change of SPY on a daily basis, for reasons discussed earlier, the longer-term performance of UPRO diverges from a simple X3 relationship with SPY. In volatile times, UPRO tends to fall well below a 3X performance over say a six-month period.

Learnings From Trading Short Volatility Funds, 1. The Tantalizing Promise of Quick Riches

The VIX is a calculated measure of stock market volatility, based on the prices of stock options. It spikes up when there is a market upset, then seemingly always settles back down again after a few days or weeks. So, it seems simple to make a quick profit from this behavior: short the VIX when it spikes, and then close your trade when it comes back down. What could possibly go wrong?

VIX Index, May 2024-April 2025. From Seeking Alpha.

It’s a bit more nuanced than that, since you can’t directly buy or sell the VIX. It is just a calculated number, not a “thing.” However, there is a market for VIX futures. The value of these futures is based on expectations for what VIX will be on some specific date. The values of these futures go up and down as the VIX goes up and down, though there is not an exact 1:1 relationship. There are funds that short VIX futures, which are a proxy for shorting the VIX futures yourself.  So, the individual investor could buy them after the VIX spikes (which would drive down the short VIX fund price), then sell them when VIX declines (and the short VIX fund goes back up).

The chart below shows the VIX (% change, orange curve) in the past twelve months prior to May 1.   There were three episodes (Aug 2024, Dec 2024, Apr 2025) where VIX spiked up. These episodes are marked with green arrows. As expected, when VIX spikes up, the short volatility fund SVIX (purple line) drops down. In August and December, if you were clever enough to buy SVIX at its low, you could turn around and sell in a week later for a good profit. The movements of SVIX are dwarfed this plot by the gyrations of VIX in this chart, but a couple of short red horizontal lines are drawn at the bottoming values for SVIX, to show the subsequent rise. A 3x leveraged S&P 500 fund, UPRO, is shown in blue.

There are important nuances with these funds. One is that a long or short VIX futures fund, at the end of the trading day, must buy and sell some futures shares to meet their performance mandate. As of say May 1, the -1X VIX fund SVIX was short 14,311 May VIX futures contracts (expiring 5/20/2025), and short 10,222 June futures (exp. 6/17/2025). To keep its exposure centered at on one month out from the present date, the fund must buy back some near month (here, May) contracts each day, and short some additional next month (June), at the close of every trading day. If the market value of the near month VIX futures contract is lower than the next month contract (being in “contango”), as it generally is during periods of low volatility, this rolling process makes money every day, to the tune of maybe 5% per month. That compounds big time over time, to over a 60% gain in twelve months. That’s the good side. The VIXcentral site shows current and historical VIX futures prices for the next several months out.

A bad side of these short funds is that the day-to-day inverse movements can rachet the fund value down and down, as VIX goes up and down. So even if the VIX ends up in six months at the same value as it is today, it is possible for a short VIX fund to be lower or higher. This can lead to a more or less permanent step down in fund value. Also, in volatile times, the near futures price is higher than the next month out, and so the daily roll works against you.

There is a term that trading pros use for amateurs who jump into volatility funds without really knowing what they are doing: “volatility tourists”. These hapless investors sometimes hear of big profits that have been made recently in vol, and then buy in, often at what turns out to be the wrong time. Then market storms arise, things don’t go the way they expected, and they get shipwrecked.

Such was the case in 2018. SVXY at that time was a fund that moved inversely to volatility futures, on a -1X daily basis. This short vol trade made insane profits in 2H 2016 and in 2017, far outpacing stocks. Someone who bought into SVXY at the start of 2017 would have quintupled their money by the end of the year. (See chart below, orange line).

However, February 5, 2018 is a day that will live in volatility infamy. Because of the roaring success of short VIX in the previous two years, investors had piled into short VIX ETFs. The VIX suddenly doubled that day, and the short vol funds could not do the daily futures trades they needed, and so their value was decimated. This event is known as Volmageddon. The chart below shows the rise (and fall) of the -1X VIX fund SVXY in orange, compared to a stodgy S&P 500 fund SPY (in green).

Folks who bought SVXY looked like geniuses, until Feb 5. Then they lost it all, more or less. The tourists licked their wounds and moved on, and short vol went clean out of fashion for a while. One short VIX fund, XIV, actually an exchange traded note (ETN), went to zero and closed. SVXY itself lost over 90% of its value. After this near-death experience in 2018, SVXY contritely modified its charter from being -1X VIX futures to being -0.5X. That reduces its exposure to vol shocks. That modification served it well in March, 2020 when the world shut down and VIX shot to the moon and stayed there for some time. SVXY lost something like 70% of its value then, but it lived to trade another day, and slowly clawed its way back.

However, short vol has made a comeback in recent years. The -0.5X SVXY was joined in mid-2022 with a new -1X VIX fund, SVIX (for investors who don’t remember what happened to -1X funds in 2018! ). Short vol actually had a very good run in 2022, 2023, and first half of 2024:

The chart above shows SVIX ( -1X, purple) and SVXY (-0.5X, blue), along with the S&P500 (stodgy orange line) over the past three years. The two inverse vol funds totally smoked the S&P through July, 2024. Investors in SVIX were up over 300%, compared to 35% in stocks. Even the more conservative vol fund SVXY was up 165%. Yee-haw!

The volatility tourists poured in, and then came August 5, 2024, with a short, sharp, unexpected spike in volatility. As we noted earlier, it was not so much that stocks cratered, but there was a hiccup in the global financial system, mainly around unwinding of the yen carry trade. The values of the short vol funds got decimated. Then the recent brouhaha over tariffs in April 2025 whacked them again. This drove the value of SVIX below the three-year rise in stocks, although SVXY still outpaces stocks (57% vs 35% rise).

There were dips in SVIX and SVXY in March 2023 (Silicon Valley Bank blowup), October 2023 (Yom Kippur attacks on Israel by Hamas), and April, 2024, corresponding to spikes in VIX. In those cases, it worked great to buy the dip, since within a few months SVIX and SVXY churned to new highs. Many were the articles in the investing world on the wonderful virtues of the daily VIX futures roll. But then August 2024 and April 2025 hit, where there was no complete, rapid recovery from the huge price drops.

What to take away from all this? What comes to my mind are well-worn truisms like:

If it looks too good to be true, it’s probably not true; There is no free lunch on Wall Street; It’s not different this time.

The reason I know this much about these trading products is that I got sucked in a bit by the lure of monster returns. Fortunately, I kept my positions small, and backstopped some trades by using options, so all in all I have probably roughly broken even. That is not great, considering how much attention and nail-biting I have put into short vol trading in the past twelve months.

In an upcoming post, I will report on an alternative way to trade volatility spikes, which has worked out much better.

Disclaimer: Nothing here should be considered advice to buy or sell any security.

The Best Investments of the 1970s

The tariffs still have me thinking about buying VIX calls and stock puts (especially when policy changes loom on certain dates like July 8th), and on the bigger question of finding the sort of investments that did well in the 1970’s, another decade of stagflation that was kicked off by a President who broke America’s commitment to an international monetary system that he thought no longer served us.

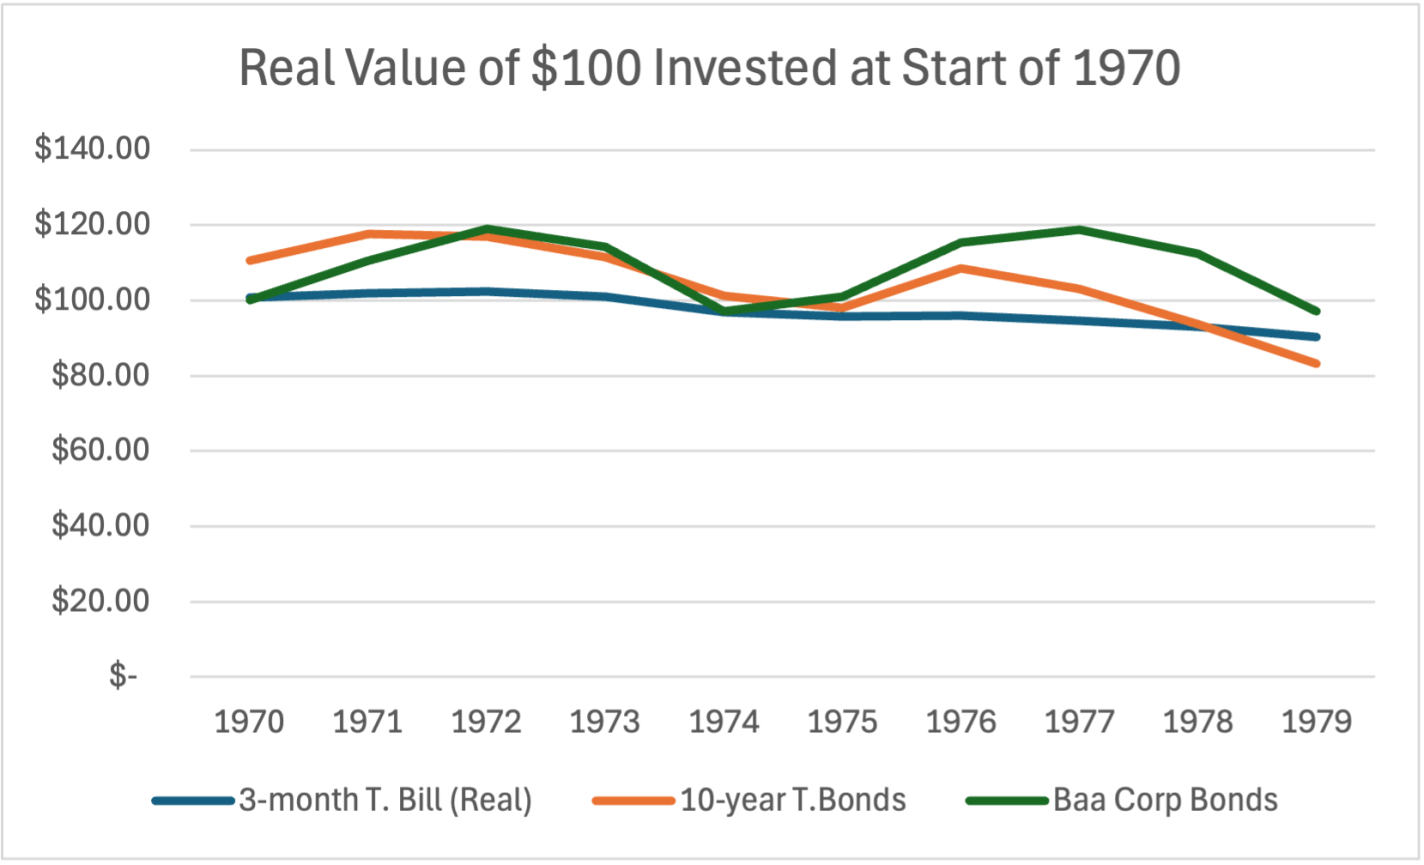
That’s how I concluded last week. So this week I’ll answer the question- what were the best investments of the 1970’s? When the dollar is losing value both at home and abroad, holding dollars or bonds that pay off in dollars does poorly:

Source: My calculations using Aswath Damodaran’s data

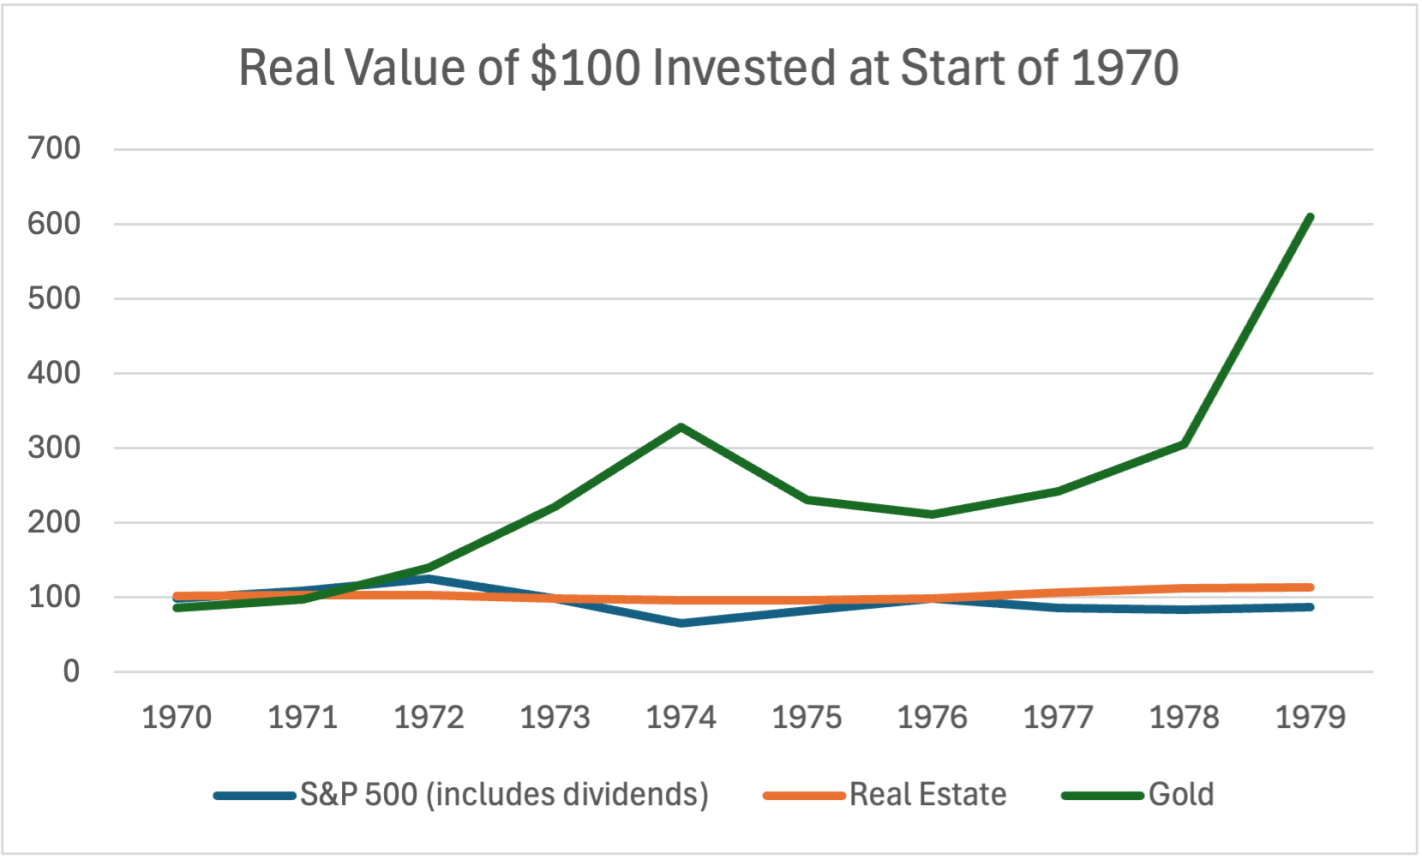
Stocks can do alright with moderate inflation, but US stocks lost value in the stagflation of the 1970’s. Foreign stocks and commodities generally performed better. Real estate held its value but didn’t produce significant returns; gold shone as the star of the decade:

Source: My calculations using Aswath Damodaran’s data

Gold is easy to invest in now compared to the 1970s; you don’t have to mess with futures or physical bullion, there are low-fee ETFs like IAUM available at standard brokerages.

Of course, while history rhymes, it doesn’t repeat exactly; this time can and will be different. I doubt oil will spike the same way, since we have more alternatives now, and if it did spike it wouldn’t hurt the US in the same way now that we are net exporters. Inflation won’t be so bad if we keep an independent Federal Reserve, though that is now in doubt. At any time the President or Congress could reverse course and drop tariffs, sending markets soaring, especially if they pivot to tax cuts and deregulation in place of tariffs ahead of the midterms.

Things could always get dramatically better (AI-driven productivity boom) or worse (world war). But for now, “1970s lite” is my base case for the next few years.

Long-Short Funds Can Mitigate Your Portfolio Gyrations

Here we discuss some stock funds that go down less than stocks in general; the flip-side is that they go up less than plain stocks, as well. Some investors may appreciate the reduction in gyrations, especially after a week like the previous one.

Long-short funds come in two main flavors. When you buy a stock, that is considered being “long”. If you short-sell a stock (borrow shares from some broker, that you plan to pay market price for later, such that you make roughly one dollar for every dollar the stock goes down), that is being short.

 “Equity-neutral” funds are short as much value of stocks as they are long. So, they are net 0% long. Obviously, you would expect the value of such a fund to not decline much in a market crash. But conversely, it would not go up much in a bull market, either. So how is this better than just holding cash in your account? The magic is if the active fund managers can manage to be long a set of stocks which go up more than the stocks that they short. They often try to pair longs and shorts in the same sector. For instance, in 2024 if a fund was long Nvidia and short Intel (another stock in the semiconductor sector), that would have been a big net win. Sometimes this works, and sometimes it doesn’t.

The actual performance of such a fund is very dependent on the active managers’ skill and luck. For instance, here is a ten-year total return plot of two market-neutral funds, one from AQR and the other from Vanguard. The Vanguard fund (VMNIX) muddled along pretty flat from 2015 through 2021, then had a slow rise 2021-2023, then went flat again. The performance of the AQR fund (QMNNX) has been more erratic. It went up 2015-2017, then down a lot (this would have been hard to bear at the time, when the S&P was roaring upward) for 2018-2020. It then roughly matched the Vanguard fund for a couple of years, then pulled way ahead 2023-2025, as it made some great long/short choices:

However, the ten-year performance of these funds fell far short of a simple S&P500 holding (blue line above). Since stocks go up the vast majority of the time, a long-short fund which is net long seems to make more sense.

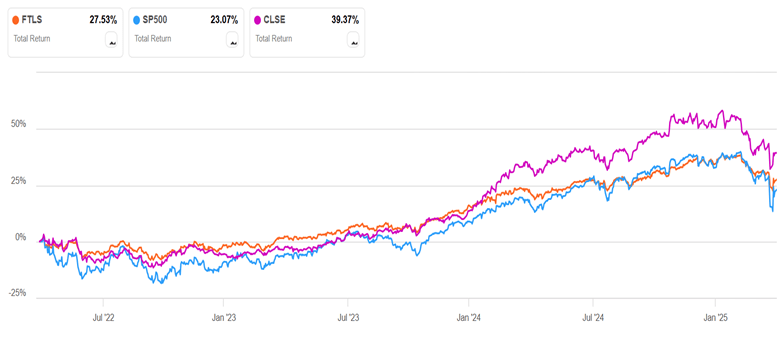
A plain vanilla net-long long-short fund is FTLS. It seems to be among the best of the long-short ETFs. It is usually about 60% net long. I modeled its performance against a portfolio of 60% S&P 500 stocks and 40% cash (rebalanced periodically), and it performed about the same. That is, FTLS went up and down with moves about 60% of what the S&P did. That is OK, but one might wonder why one would hold such a fund instead of just holding a 60/40 stocks/cash allocation for the same amount of investment. If we look at time periods with appreciable down periods, such as the past three years (see chart below), FTLS does look comforting; its muted dips in 2022 and 2025 compensate for its slower rise in 2023-2024, so it presents as a slow, fairly steady rise with a 3-year total return slightly higher than S&P. It is certainly easier psychologically to hold such a fund, and it might help small investors avoid the deadly mistake of panic-selling during a market downturn.

CLSE is a long-short fund that is often about 70% long. Management there takes a more swashbuckling, risk-taking approach. It went down less than S&P in the bear market of 2022 (as expected), and then it soared high above S&P in the first half of 2024, as it made skillful/lucky picks to go very long tech growth stocks like NVDA. That tech-heavy approach has backfired so far in 2025, since CLSE has fallen as much as S&P in the past several months (NOT what one hopes for a long-short fund). Despite that glitch, however, CLSE still weighs in with a 3-year return far ahead of the broader S&P (39% vs. 23%):

Another strategy to mitigate market ups and downs is for a stock fund to buy and sell put and call options, to create a “collar” effect. Buying puts limits the downward movements; the puts are financed by selling calls, which limits the upward swings. The fund ACIO, for instance, seeks to capture 65% of the S&P’s upside, while limiting loss to 50% of the downside.  In my stock charting, I found it ended up performing about like FTLS.  As of a week ago (Tue, Apr 8), the S&P was down 15% year to date (i.e., since Jan 1), while FTLS and ACIO were only down 8.3 % and 9.6%, respectively.

Standard Disclaimer: This is for information only. Nothing here is advice to buy or sell any security.

The Wild Market of July 8th, 2025

April 2nd drove the point home- when someone in a position to know tells you something big is coming on a precise date, it is a smart time to act. As opposed to doing what I have done, which is think about acting but ultimately do nothing.

Ahead of April 2nd this year, the White House made a big deal of how they had a big announcement on trade coming April 2nd and I thought “this could go better or worse than markets expect, but some big move is coming, this seems like a great time to invest in volatility through something like VIX options expiring shortly after April 2nd”, but then I didn’t buy VIX options. I didn’t totally understand how they worked, didn’t want to buy without finding out, and didn’t make time to find out. My instinct was right though- the VIX more than doubled last week, so the right options on it much more than doubled. 

Ahead of the war in Ukraine in February 2022, US intelligence warned that Russia was planning to invade imminently, and I thought “they don’t have a great recent track record but it is very unusual for them to announce something so big will happen so soon, this is probably happening, this would be a good time to buy puts” but then didn’t buy puts, which of course did great as markets crashed following the invasion.

Yesterday the S&P 500 shot up 9% on the news that most of Trump’s new tariffs were paused. I thought this reaction was excessive given that the tariffs weren’t canceled, merely paused 90 days. Note that an exact date is being offered- July 8th! I sold some stocks last night and put in orders for S&P puts and VIX calls, but the limit options orders didn’t fill today as it seems the market caught up to my take from last night. The S&P is down 4% as I write this. This morning I was was researching which puts to buy, leaning toward SPY or XSP at-the-money puts for July 19 (first options date available after the 90-day tariff delay expires), then markets opened and their prices jumped 20+% in seconds as I watched. They are up over 50% now.

It is possible that the administration will fully clarify their stance on tariffs one way or another before July 8th, or even that Congress takes back their tariff power before then and makes their own deal. But I think it is more likely than not that we get a big announcement from the White House on July 8th about which tariffs will be implemented. In which case July 8th will be another wild market day.

This may already be priced in, but so far this April the situation has been changing so rapidly and touching so many parts of the markets and the real economy that even some of the most efficient markets (like US stock and bond markets) seem to be struggling to process what is happening. My ill-timed post from November praising the S&P has some lines that hold up well:

I’m now back up to 90% belief in efficient markets, at least for stocks.

This efficiency seems to change a lot over time. Probably fewer than 10% of US stocks have obvious mis-pricings right now; really none stand out as super mispriced to a casual observer like me. Instead, it seems like every 10 years or so a broad swathe of the market is driven crazy by a bubble or a crash, and you get lots of mispricing- like tech in 2000, forced/panic selling at the bottom in 2009, or meme stocks in 2021. The rest of the time, the stock market is quite efficient. So, in typical times, just be boring and buy and hold a broad index fund.

Ever since April 2nd, we have not been in typical times. At some point they will return and most people are probably best served by just holding through this (selling at the bottom and never getting back in is a big failure mode in investing). But for now the tariffs still have me thinking about buying VIX calls and stock puts (especially when policy changes loom on certain dates like July 8th), and on the bigger question of finding the sort of investments that did well in the 1970’s, another decade of stagflation that was kicked off by a President who broke America’s commitment to an international monetary system that he thought no longer served us.

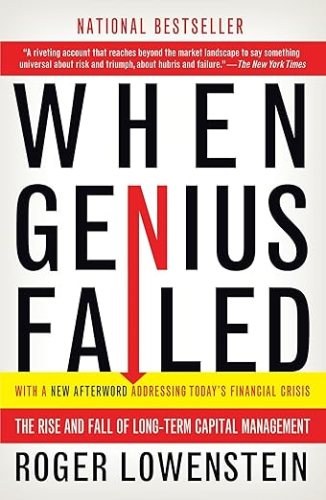
When Genius Failed

Myron Scholes was on top of the world in 1997, having won the Nobel Prize in economics that year for his work in financial economics, work that he had applied in the real world in a wildly successful hedge fund, Long Term Capital Management. But just one year later, LTCM was saved from collapse only by a last-minute bailout that wiped out his equity (along with that of the other partners of the fund) and cast doubt on the value of his academic work.

Roger Lowenstein told the story of LTCM in his 2001 book “When Genius Failed“. I finally got around to reading this classic of the genre this year, and I’d say it is still well worth picking up. The story is well-told, and the lessons are timeless-

  • Beware hubris
  • Beware leverage
  • Bigger positions are harder to get out of (especially once everyone knows you are in trouble)
  • In a crisis, all correlations go to one
  • Past results don’t necessarily predict future performance
  • Sometimes things happen that are very different from anything that happened in your backtest window.

The book came out in 2001 but it presages the 07 financial crisis well- not about mortgage derivatives specifically, but the dangers of derivatives, leverage, using derivatives to avoid regulations restricting leverage, and over-relying on mathematical models of risk based on past behavior. If Fed had let LTCM fail, could we have avoided the next crisis? Perhaps so, as their counterparties (most major Wall Street banks) who got burned would have been more careful about the leverage and derivatives used by themselves and their counterparties, and regulators may have taken stronger stances on the same issues.

Perhaps some more recent well-contained blowups foreshadow the next big crisis in the same way, like FTX or SVB?

Some more specific highlights about LTCM:

Continue reading →

Trump’s National Sales Tax

Tariffs are going up to levels last seen in the 1930 Smoot-Hawley tariffs that helped kick off the Great Depression:

Tariffs are taxes- roughly, a national sales tax with an exemption for domestically-produced goods and services. I think the words make a difference here- “raising tariffs on countries who we run a trade deficit with” just sounds abstruse to most people, while “raising taxes on goods bought from firms in net-seller countries” sounds negative, but they are the same thing.

Of course, in this case the plan is to raise taxes to at least 10% on goods from all other countries even if they aren’t net-sellers, and raise taxes up to 49% on those that are. This is not a negotiating tactic. We know this from the math- the new tax formula uses net imports from a country rather than a country’s tariff rates, so a country could cut their tariffs on US goods to zero today and it wouldn’t necessarily reduce our “reciprocal” tariffs at all; at best it would reduce them to 10%. We also know it isn’t about negotiating because the administration says it isn’t. Their goal, obviously, is to reduce trade, not to free it.

They say they are doing this to bring manufacturing back to America and to promote national defense. But American manufacturers don’t seem happy. Even before the latest huge tax increase, trade war was their biggest concern:

The National Association of Manufacturers Q1 2025 Manufacturers’ Outlook Survey reveals growing concerns over trade uncertainties and increased raw material costs. Trade uncertainties surged to the top of manufacturers’ challenges, cited by 76.2% of respondents, jumping 20 percentage points from Q4 2024 and 40 percentage points from Q3 of last year.

The National Association of Manufacturers responded to the latest tax increase with a negative statement; so even the one major group that might have benefitted from tariffs is unhappy. Foreign producers and US consumers will of course be very unhappy. I think Trump is making a huge political blunder alongside the economic one- he got elected largely because Biden allowed inflation to get noticeably high, but now Trump is about to do the same thing.

I also see this as a huge national security blunder. For tariffs on China, I at least see their argument- we should take an economic hit today in order to become less reliant on our peer-competitor and potential adversary. But the tariffs on allies make no sense- they are hitting the very countries that are most valuable as economic and/or military partners in a conflict with China, like Canada, Mexico, Japan, South Korea, Vietnam, India, and Taiwan (!!!). One of our biggest advantages vs. China has been that we have many allies and they have few, and we appear to be throwing away this advantage for nothing.

What can you or I do about this? Stock up on durable goods before the price increases hit. Picking investment winners is always hard, but things this makes me consider are gold, stocks in foreign countries that trade little with the US, and companies whose stocks took a big hit today despite not actually being importers. Finally, we can try nudging Congress to do something. The Constitution gives the power to levy taxes to the legislative branch, but in the 20th century they voted to delegate some of this power to the executive. Any time they want, Congress could repeal these tariffs and take back the power to set rates. I have some hope they actually will- just yesterday the Senate voted to repeal some tariffs on Canada, and more votes are planned. The alternative is to risk a recession and a wipeout in the midterms: