There are some stories that we tell. These include that we have increasing non-white and non-male participation in many college majors. Here I examine the 25 most popular majors in the 2024 ACS data and I split it up into older and younger cohorts, delineated by age 40 (unweighted).
Race
Below-upper is the distribution of race by college major for people older than 40 years of age, or who mostly graduated more than 15 years ago. It largely conforms to my biases. There were a higher proportion of Asian people in the natural sciences and engineering, but also in Economics. I didn’t really have strong priors about the proportions of black people, but they composed the highest proportions in Criminal Justice, Business, and Liberal arts. Contrary to my expectations, Elementary Education had the highest proportion of white people. Below-lower is the cohort that is age 40 and younger. The entire distribution is similar, but less white.
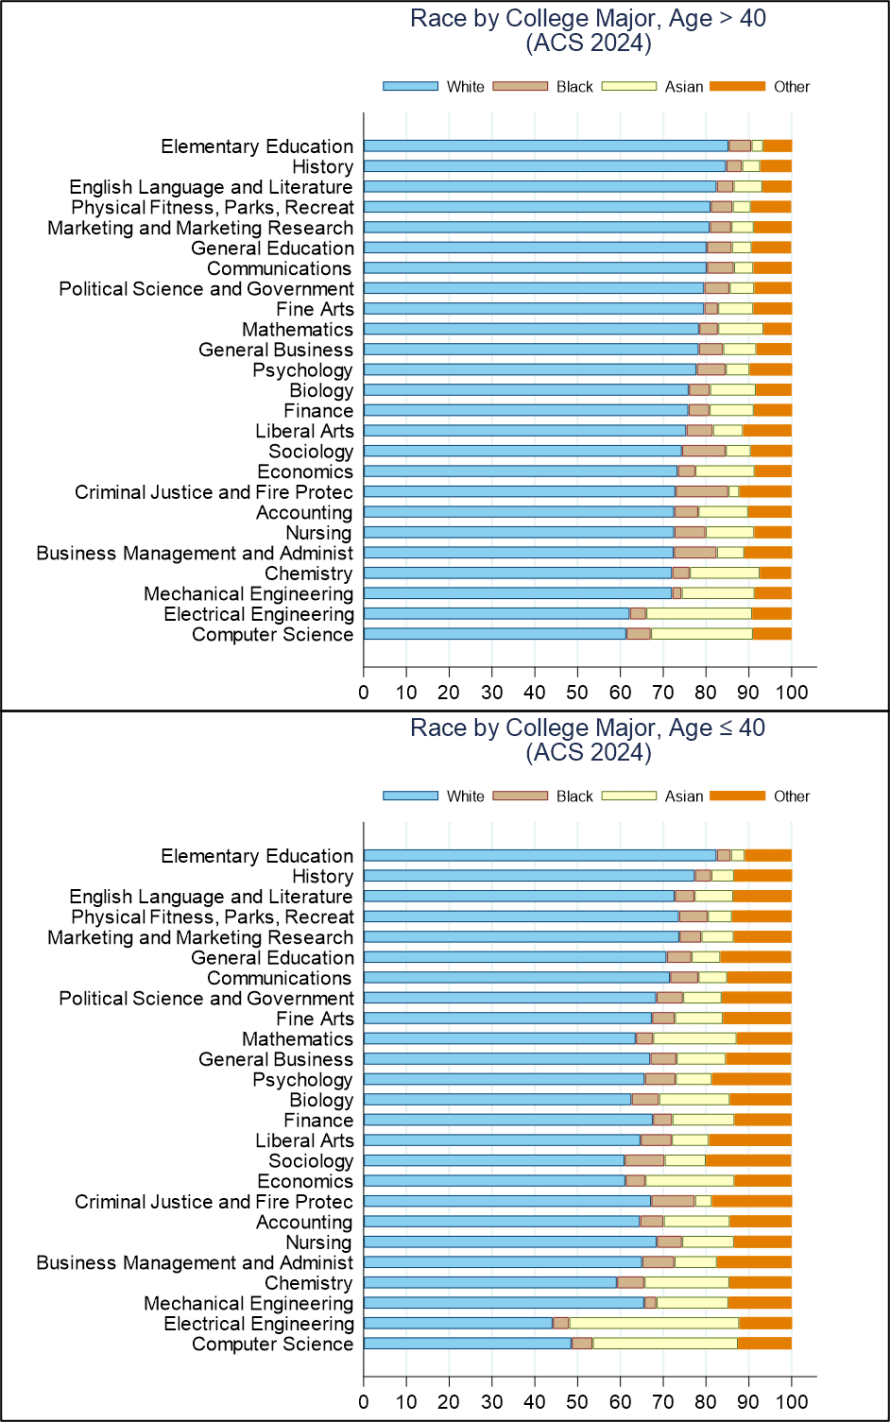
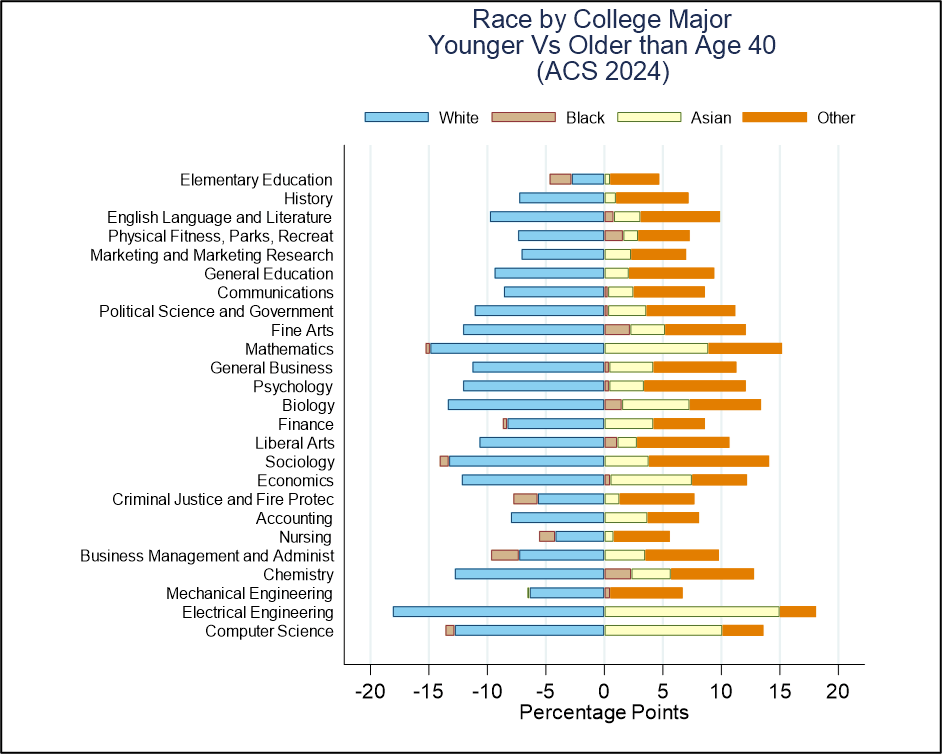
Some of the differences between the two groups are hard to see, so I’ve included those below. What are some general takeaways? 1) There are lower proportions of white people among all degrees. 2) There are higher proportions of Asian people in every field except mechanical engineering, which is unchanged. 3) Whether black people compose a greater proportion depends on the major.
In the younger cohort, black people are now a greater share of bachelor’s in chemistry, Fine Arts, Physical Fitness, Biology, and Liberal Arts. But black people also now compose lower proportions of people with bachelor’s in business management, Criminal Justice, and Nursing.
Interestingly, the whitest college major, Elementary Education, has experienced the least change in racial diversity and has had a decline in the proportion of black degree holders. Economics ties with Sociology with for the 4th lowest proportion of white people among younger graduates at 61%. Most of the criticism in economics has not been due to racial imbalance, but rather due to sex imbalances.
Sex
Because sex has two categories in the census data, I can fit everything into the single graph below. It illustrates the sex split by major among people older than 40 vs the younger cohort. The distribution mostly conforms to my priors. The biggest surprises to me among the older cohort are that Finance and Math were as popular among females as they were. Those are two fields in which I though men would compose a higher proportion, but Math is within a stone’s throw of an even split. Among the younger cohort of majors, the vast majority of degrees are more female now, though Economics is still around 2/3 male.
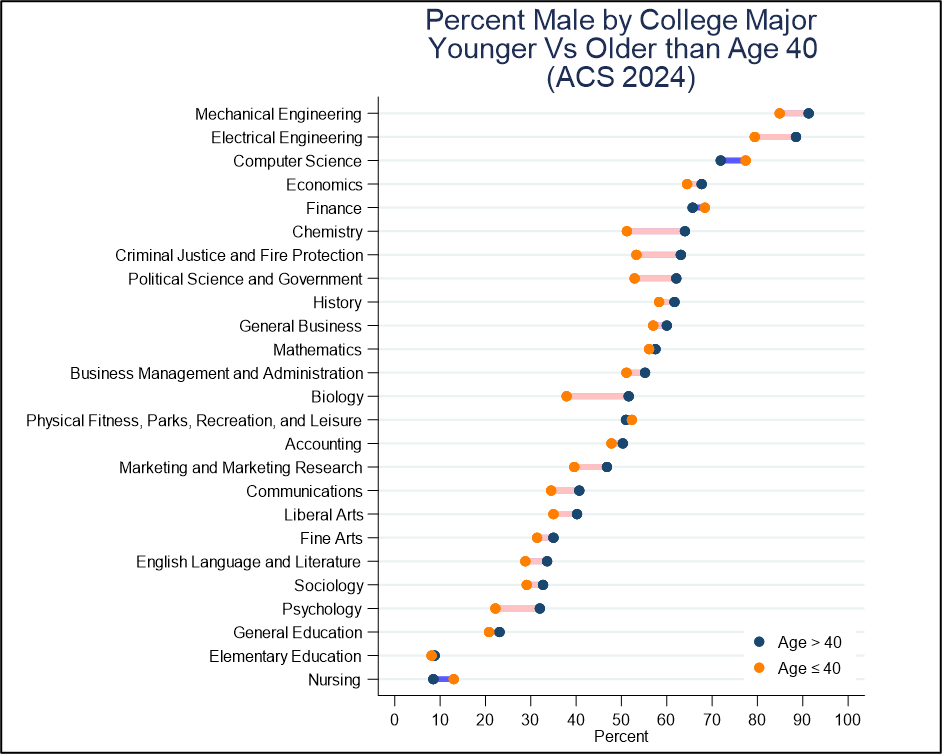
The biggest female shifts have been in Biology and Chemistry. Contrary to general trends, some majors are a *higher* proportion male than they used to be. These include Computer Science and Finance, despite being more male in the first place. Less surprising are Physical Fitness and Nursing – the latter of which was overwhelmingly female in the first place.
Again, the smallest change in diversity occurred among Elementary Education majors, whose sex ratio is practically unchanged and was overwhelmingly female in the first place. What is happening in Elementary Education?! Why is it the most homogeneous and exhibiting the least change? I don’t know the answer. All I have are guesses. Maybe it’s because, paying relatively little, jobs in elementary education supplement the primary earner’s income (often the male) rather than being the primary source of family income. Maybe men don’t care about children as much. Maybe there is stigma against men caring about children. I do not know.
Diversity
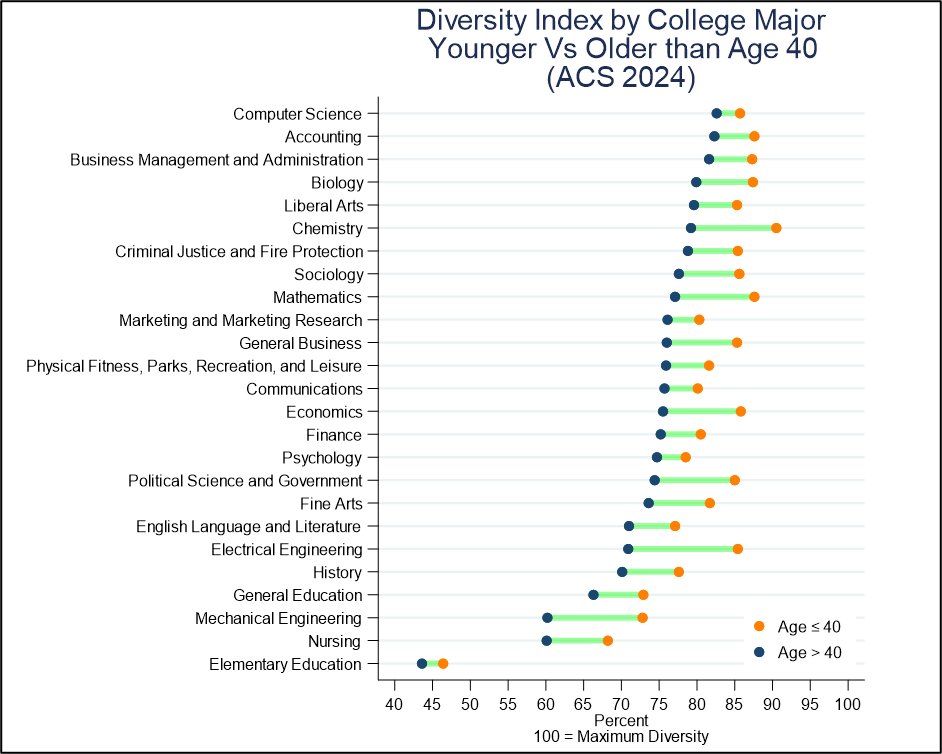
How do we measure diversity? One measure is with the “Diversity Index” which compares the heterogeneity to the uniform distribution. The naïve version assumes that each category of person composes an identical share of a group if there is perfect diversity (See Note). Although that’s impossible, it’s still ok to contrast against that ridiculous standard as a limiting value. When the diversity index reaches 1 (or 100) then there is perfect diversity. When it’s zero, there is only one category of person present within a major.
The below graph measures the diversity among the older and younger cohorts and how they changed. Economics had about the median level of diversity among the older cohort. But, they rank 6th most diverse among the younger cohorts and had the 6th biggest increase in diversity too. Indeed, none of these most popular majors became less diverse. The awkward group in the room is still majors in elementary education. To reiterate, they were the most white, most female, and had the smallest changes on the margins of race and sex. More broadly, they were the least diverse, and they remain the least diverse, having made the smallest increase in diversity. It’s always possible that they’re diversifying by political affiliation or on some other margin not measured here. But I wouldn’t bet on it.
Note:


