Let’s talk about disability. The American Community Survey (ACS) identifies seven broad categories, not including the baseline case of ‘No Disability’. I’ve written before about how disability designations are difficult because many qualifying conditions are a matter of degree. Surely you’ve met a person who is legally blind but can see *some*. How much sight ability can remain while still being considered blind? If a person can identify the sun’s location, but nothing else, then is that person still blind? Similarly, who’s to say whether some physical or cognitive characteristic is disabling? Why not enabling – depending on the task?
Wisely, the ACS side-steps this entire discussion and simply asks respondents whether they have “difficulty”. We can be agnostic about the cause and degree while still trying to get at the heart of the matter. One downside is that people tend to have more difficulty as they age. Since that’s not relevant for earlier life economic outcomes, I only examine ages 24-45. Difficulty with “self care” is too small of a category in the 2024 ACS for the analysis here. Below are the other six difficulties identified:
- Hearing Difficulty (n=6,609)
- Seeing Difficulty (n=8,307)
- Cognitive Difficulty (n=26,792)
- Ambulatory Difficulty (physically getting around) (n=4,568)
- Independent Living Difficulty (n=5,997)
- No Disability (n=885,302)
We should say early on that many of the people who participate in “Deaf” (capitalized) culture do not consider deafness to be a disability and that any such suggestion is motivated by bias and hearing culture. I won’t engage with that here. But I can say that there is a long tradition going back through the 1800s that rejected alms-giving for deafness and instead supported independent living for deaf people. Historically, this manifested as outlawing panhandling while featuring deafness and rejecting government programs that provide simple transfers due merely to deafness. More recently, the push to reject the ‘disability’ label and its baggage has even been the motivation for some deaf people to oppose cochlear implants being covered by medical insurance. For ease, I’ll be using the colloquial terms for all of the above difficulties. Now that you have the greater context, let’s jump into the data (unweighted).
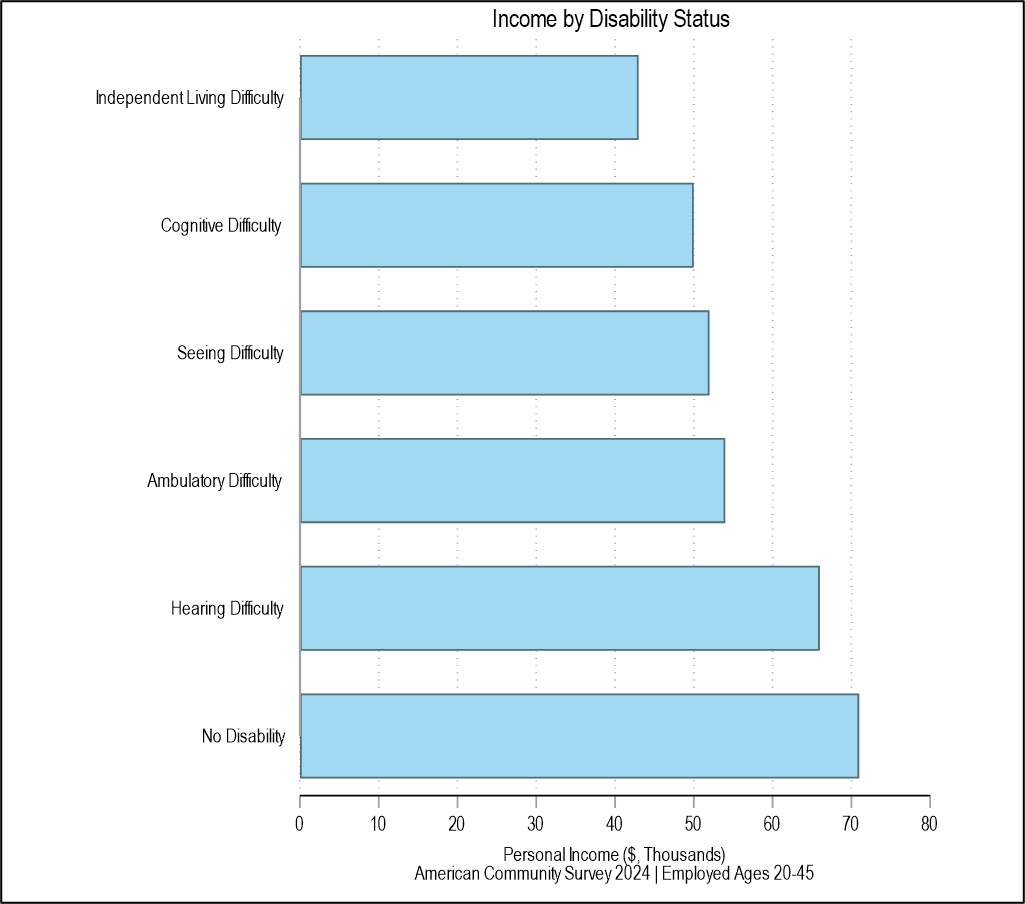
The baseline income chart is above. Given the above description, it should come as no surprise that deaf people have the highest average income among disability groups, conditional on employment. However, it’s also surprising that most of the above disabilities have incomes that I wouldn’t exactly call destitute. Many people who have a disability look much like everyone else. From an economic point of view, we all have a comparative advantage and it’s perfectly consistent with gainful employment and flourishing otherwise.
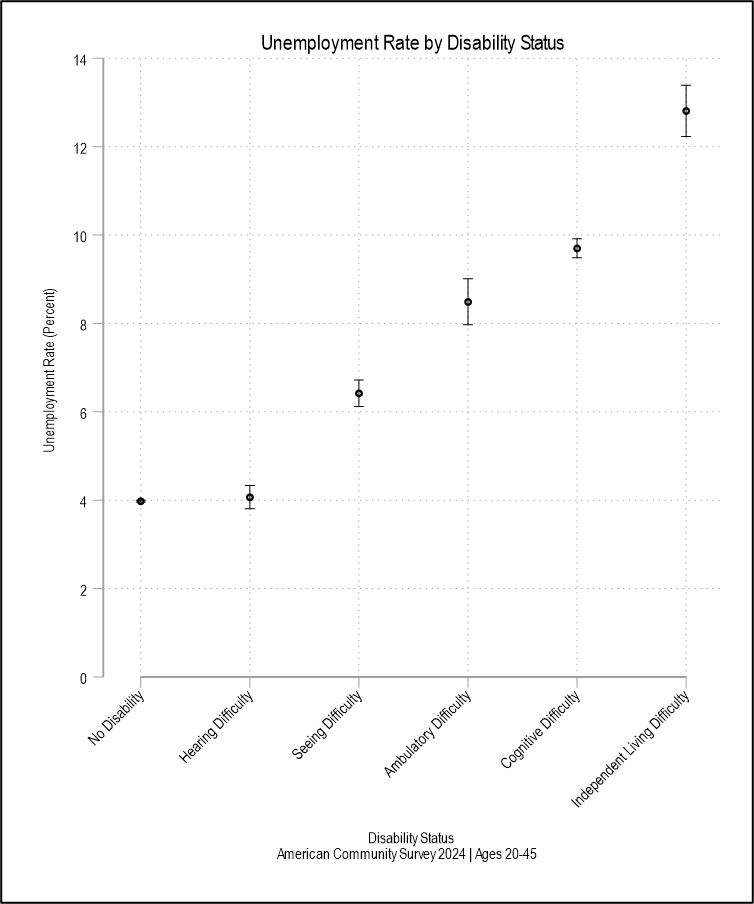
Speaking of gainful employment, above are the unemployment rates. They follow the exact same order as the average incomes. In fact, the average deaf unemployment rate is identical to that of the non-disabled population. Both charts are consistent with being ordered by labor productivity, which determines labor demand. The probability of being unemployed and the average incomes compound to yield an expected income that shares the same ordering. This is also consistent with my research on the 19th century deaf population. If 2024 is similar enough to 1874, then we should expect disability educational achievement to be lower too.
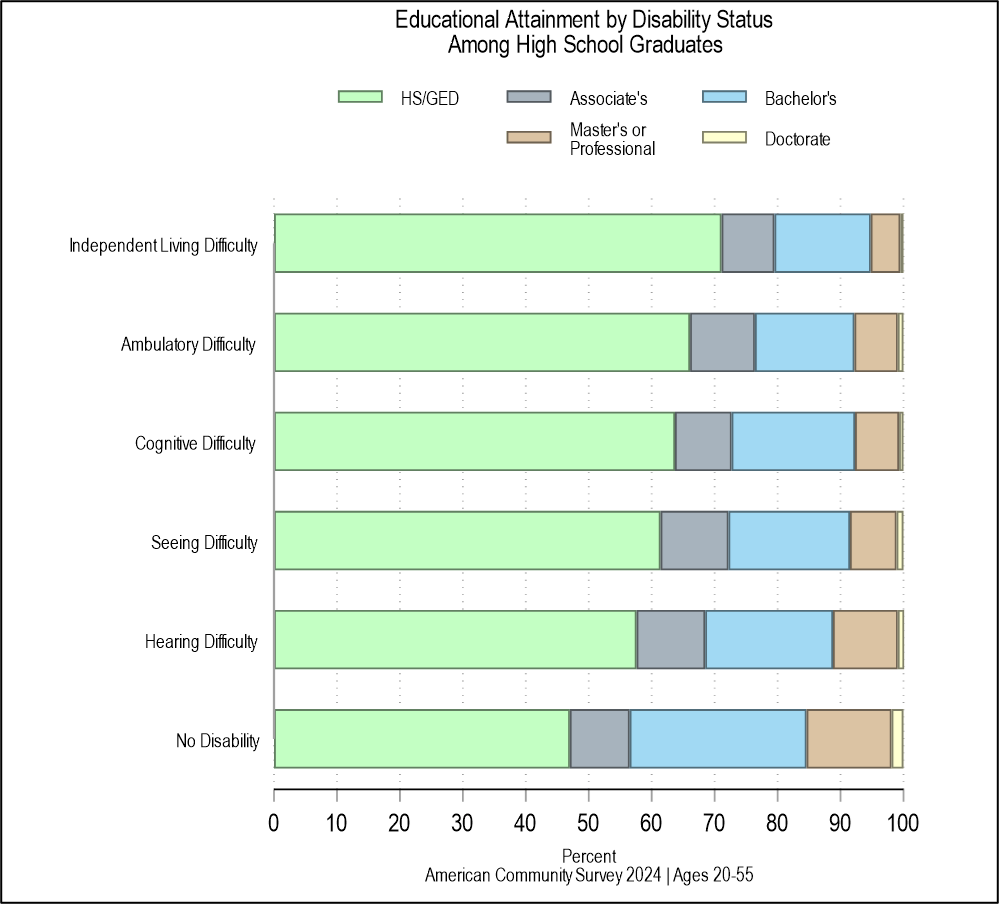
The above chart compares proportions of educational achievement for those who completed high school or the equivalent. This means that we are omitting many, though not all, of the most disabled individuals. Therefore, we’re not counting the lower tail in all groups. Deaf people have the highest proportions of associate, bachelor’s, and master’ degrees among disability groups. Though blind people just barely have more doctorates. Again, deaf people most reflect the non-disabled population. What about incomes by educational achievement? That’s below.
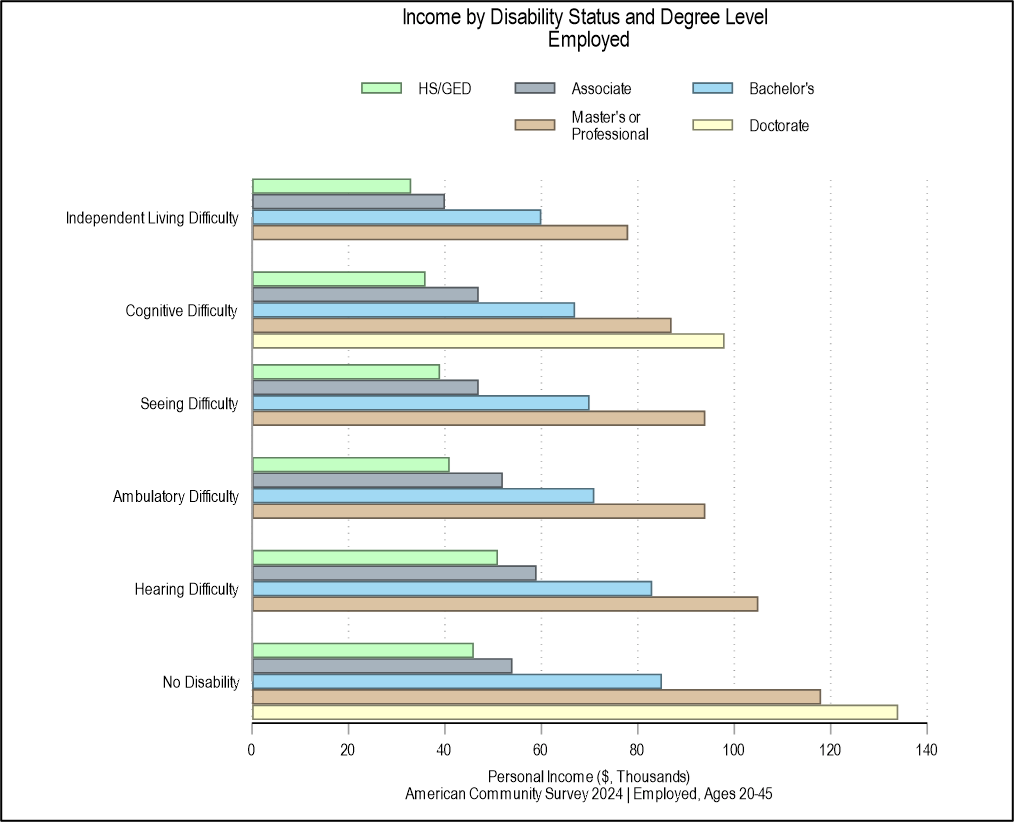
The above chart deviates from others so far. Here, we can see that the deaf population has the highest average incomes among high school diploma and associate’s degree holders – even higher than the non-disabled population! Why? One big reason may be that schools for the deaf have always included substantial vocational training components. So, those high school diploma holders are more productive, on average, and get hired at higher pay. For bachelor’s degrees and greater, the non-disabled sample earns more, though such deaf people still earn the most among disability groups. Those with cognitive difficulty are the only group in the sample that had at least a hundred people with doctorates. They earn about what a non-disabled bachelor’s makes if they major in History or Business Administration.
Finally, I’ll end where I started. Below is income by disability again, but with the source of income detailed. The green portions reflect disability payments from the social security administration and are lowest among blind and deaf people and highest among those who have difficulty living independently. That makes a lot of sense. Many, not all, of those people are unable to work by even the most in generous standards. Consider cases of lissencephaly, people with smooth brains, and often don’t develop mentally beyond the functionality that’s typical of an on-track two-year-old. Those people receive government assistance so that their parents or caretakers can provide care.
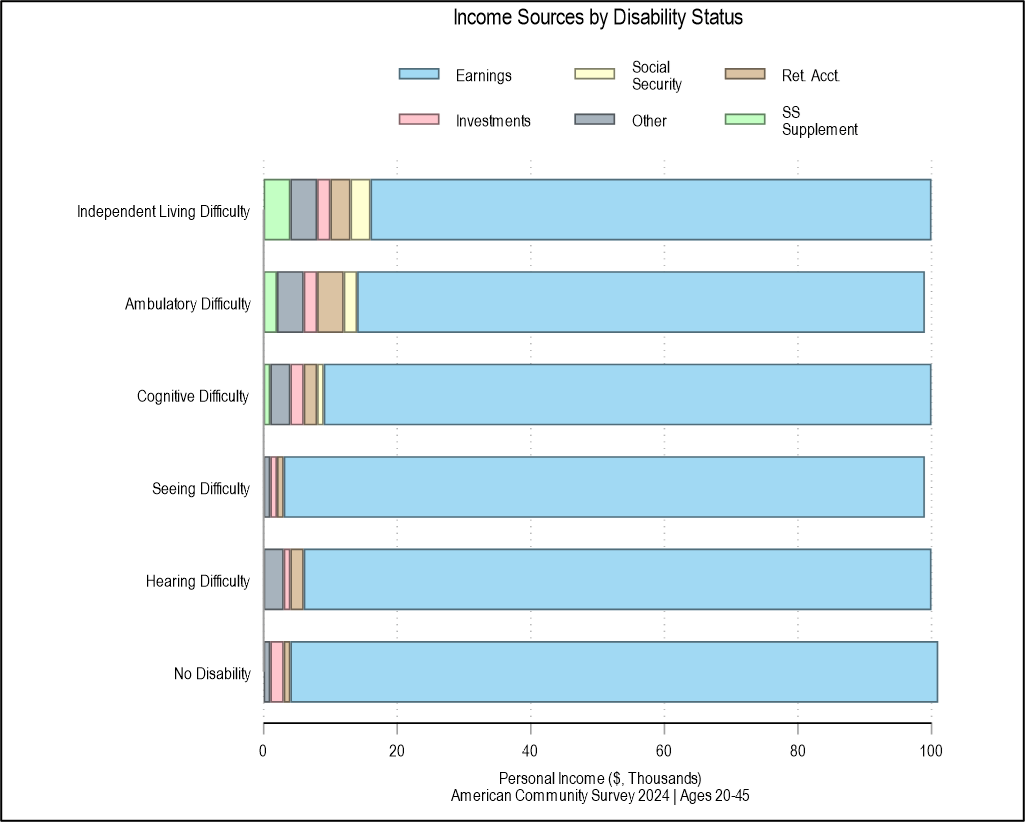
Also in the chart above is a clear divide among the non-disabled, deaf people, blind people, and everyone else. Deaf and blind people don’t generally receive the social security supplement categorically. They earn a greater part of their incomes by working, just like those with sight and hearing. Neither group, however, earns as much investment income as the non-disabled group. One mystery above is the source of “other” income. That’s a residual category in the ACS that represents income not accounted for in the other categories. Blind people had ‘typical’ amounts of other income, but it’s quite large for all of the other disability groups, including deaf people. It’s possible that those groups are subsidized by some private means, but it’s also possible that a diversity of incomes can cause some reporting confusion. That makes sense, except for the deaf group, which is otherwise pretty similar to the blind and non-disabled groups.

