But as Jeremy often points out here, young adults have actually been doing pretty well at building wealth. So why are they so gloomy?
Since I’ve now aged out of the young adult category, I’m obligated to start by wondering if kids these days are just whinier, and need to quit doomscrolling and toughen up. But if I try to see things their way, here’s what I can come up with for why their pessimism could be rational:
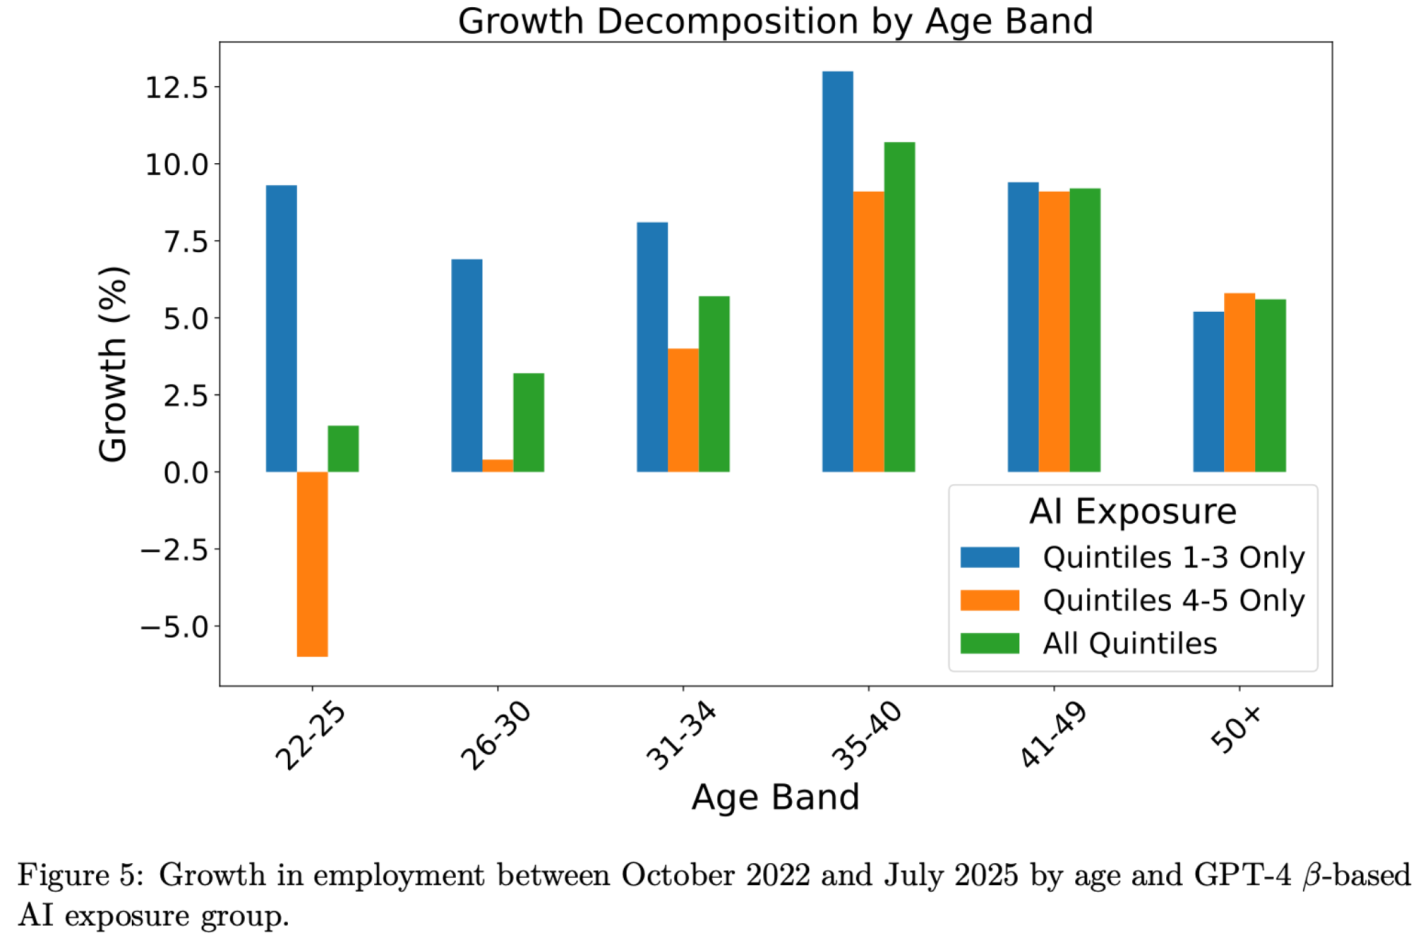
It’s About The Future: Sure things have been fine, but that is about to change. The more farsighted youth know they will be the ones expected to pay back the big deficits the Federal government is running. They have student loans to pay today now that payments have fully resumed. I predicted after the 2022 student loan forgiveness that we would be back to all-time highs in student debt by 2028, but in fact we are there already. The youth unemployment rate is now 10.5%, up from 6.6% in April 2023, and could rise a lot more if AI really starts displacing jobs:
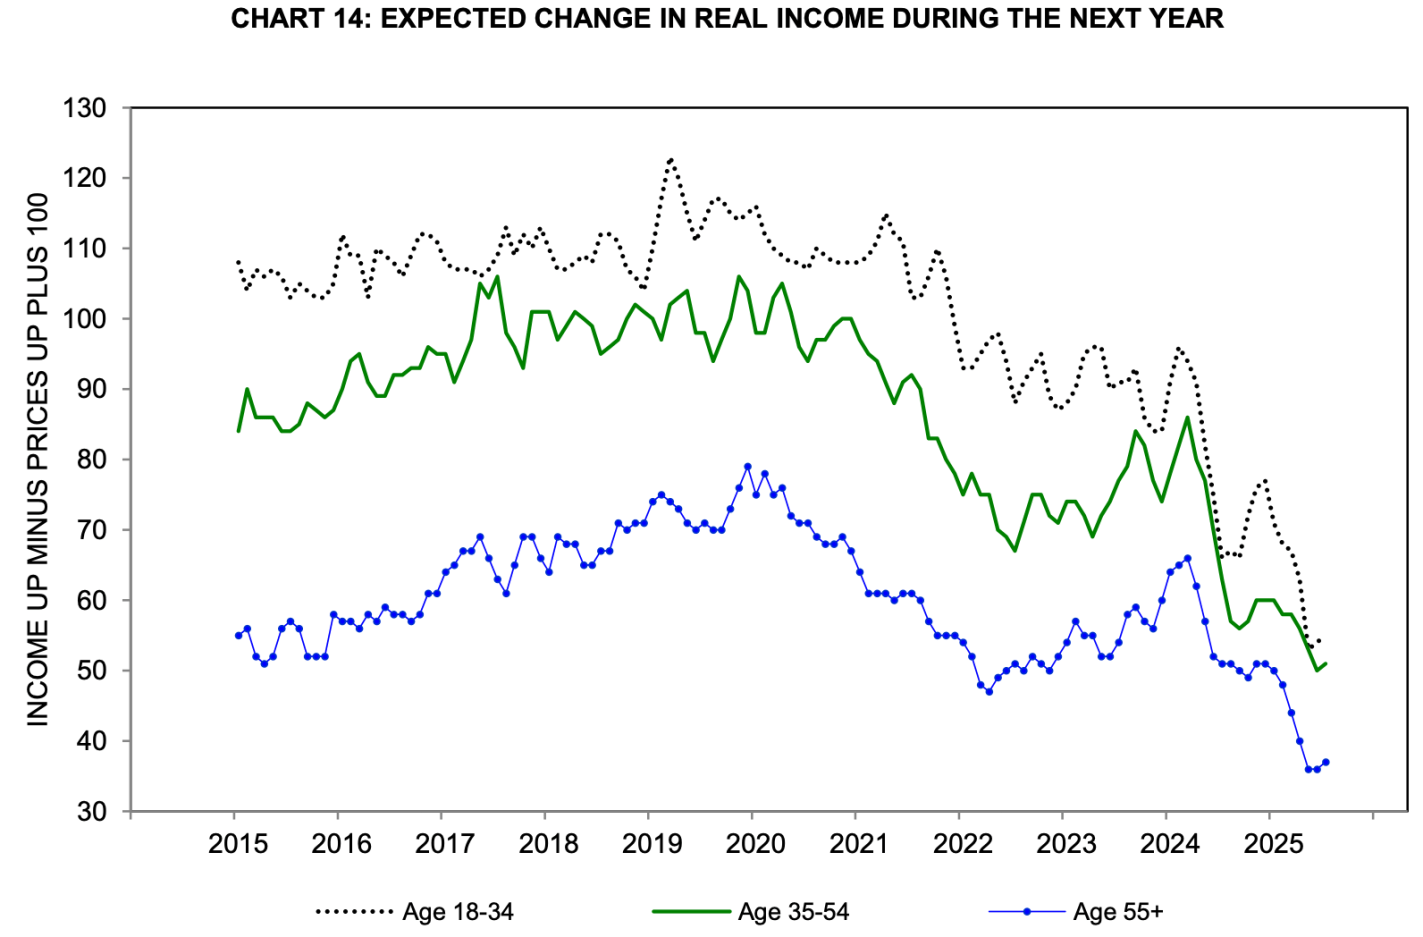
Source: Brynjolfsson, Chandar and Chen 2025.Source: Michigan Consumer Survey
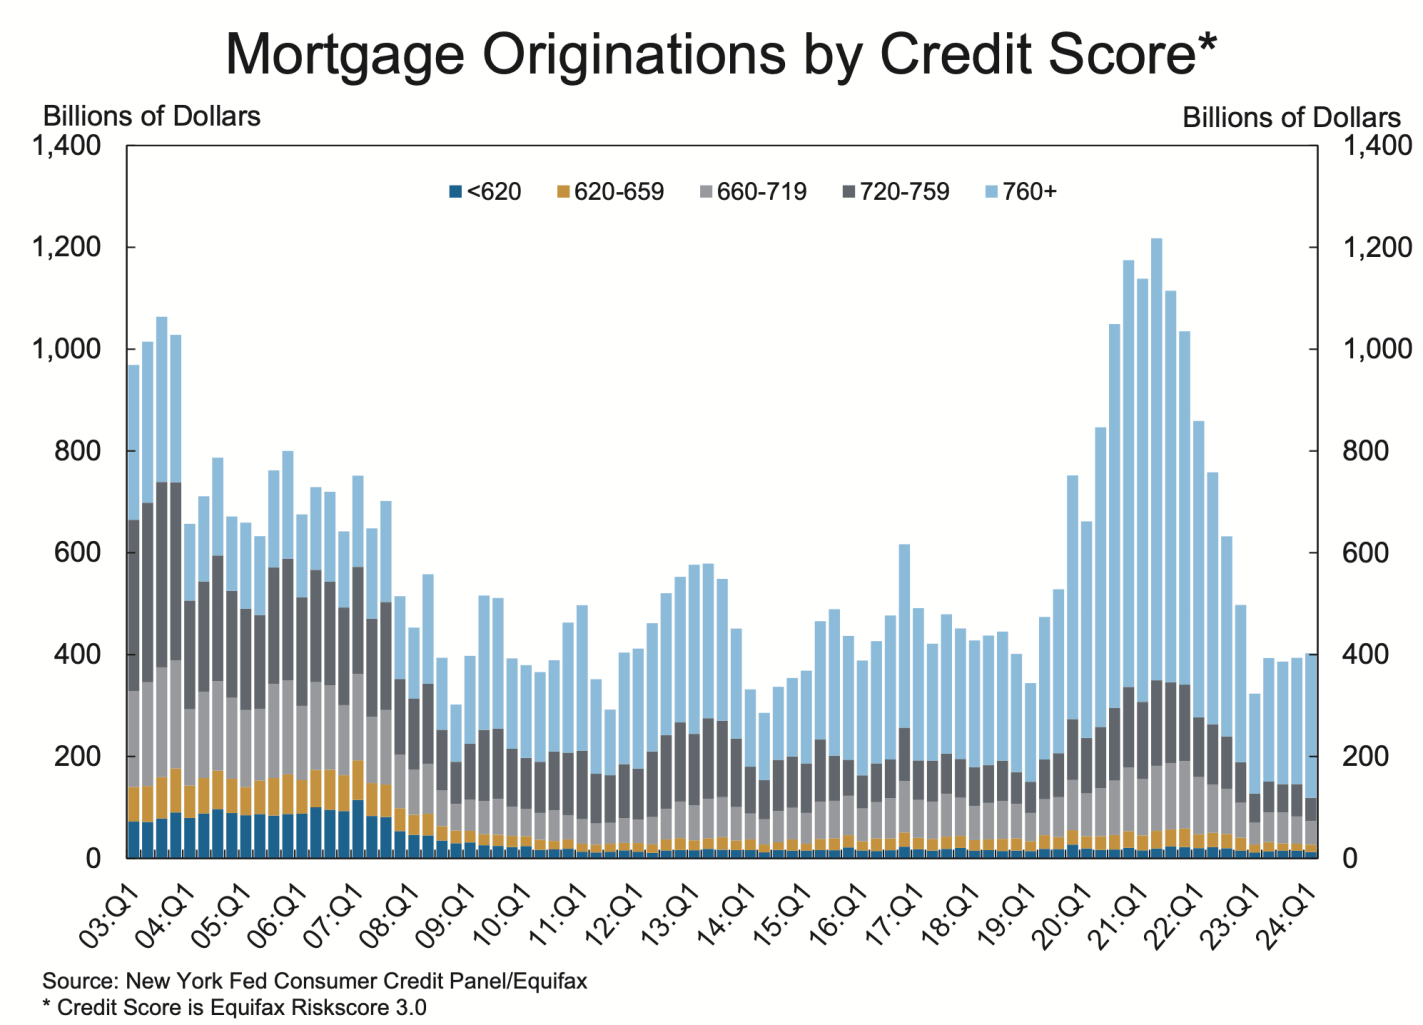
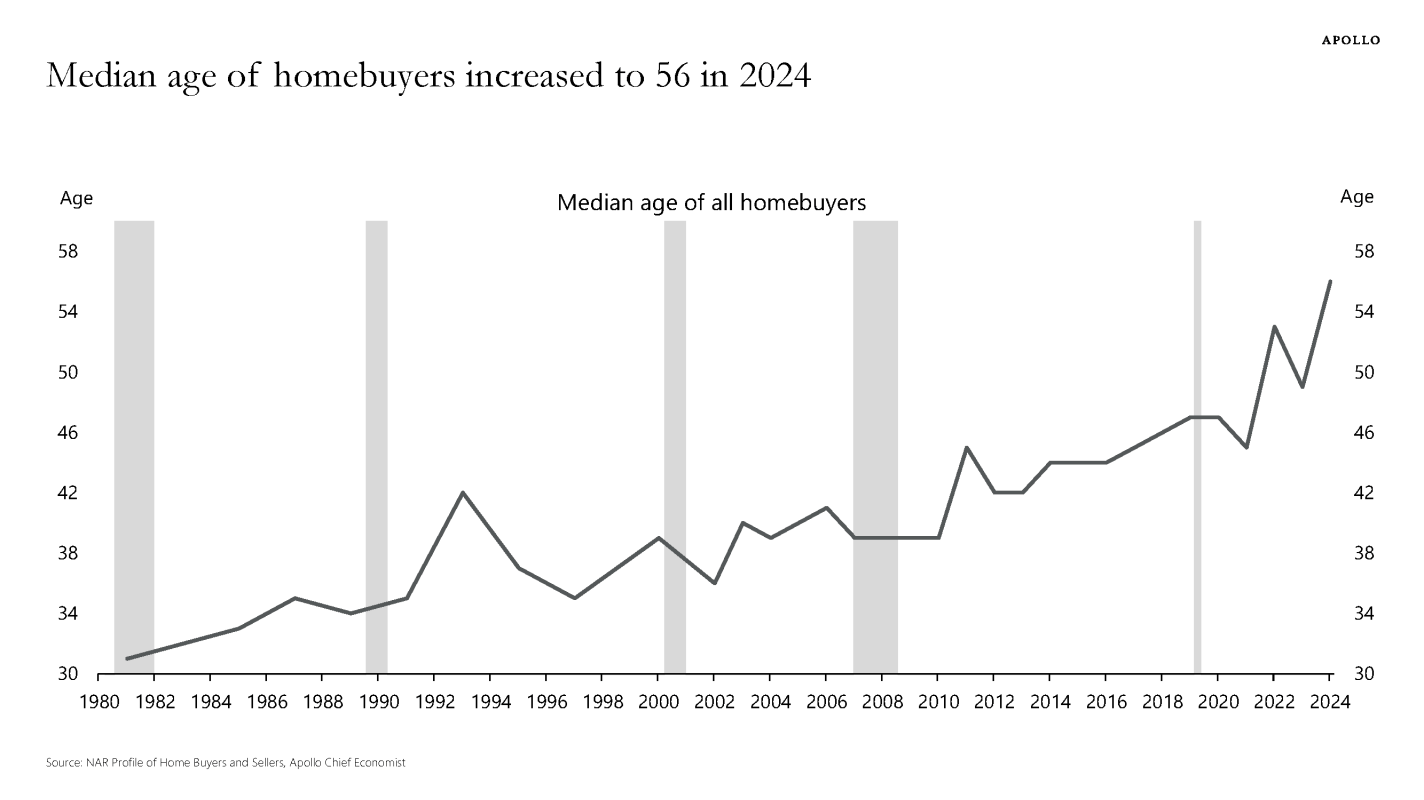
2. It’s About Housing: House prices are at all time highs (far above the prices during the 2000s “bubble”). Mortgage rates remain high, and to the extent that Fed rate cuts push them down, they will likely push prices higher, leaving homes hard to afford. High credit standards post-Dodd-Frank mean younger buyers in particular find it hard to get a mortgage; homeownership rates are falling while the average age of homeowners shoots upward. Most older people already own a house, while most young people want to buy but see that as increasingly out of reach.
Good luck getting a mortgage without super-prime creditEveryone thinks it’s a bad time to buy a house, but this matters most if you’re young and don’t already own oneThe median American is 39 years old but the median homebuyer is 56
It will be interesting to see if this ends up taking a place in the set of Fed surveys that are always driving economic discussions, like the Survey of Consumer Finances and the Survey of Professional Forecasters. If they keep it up and start putting out some graphics to summarize it, I think it will. My quick impression (not yet having spoken to Fed people about it) is that it will be the “quick hit” version of the Survey of Consumer Finances. It asks a smaller set of questions on somewhat similar topics, but is released quickly after each quarter instead of slowly after each year. If they stick with the survey it will get more useful over time, as there is more of a baseline to compare to.
But a year later the survey now has what I hoped for: a solid baseline for comparisons, and pre-made graphics to summarize the results. It continues to show complex and mixed economic performance in the US. People think the economy is getting worse:
They are cutting discretionary (but not necessity) spending at record levels:
They are worried about losing their jobs at record levels:
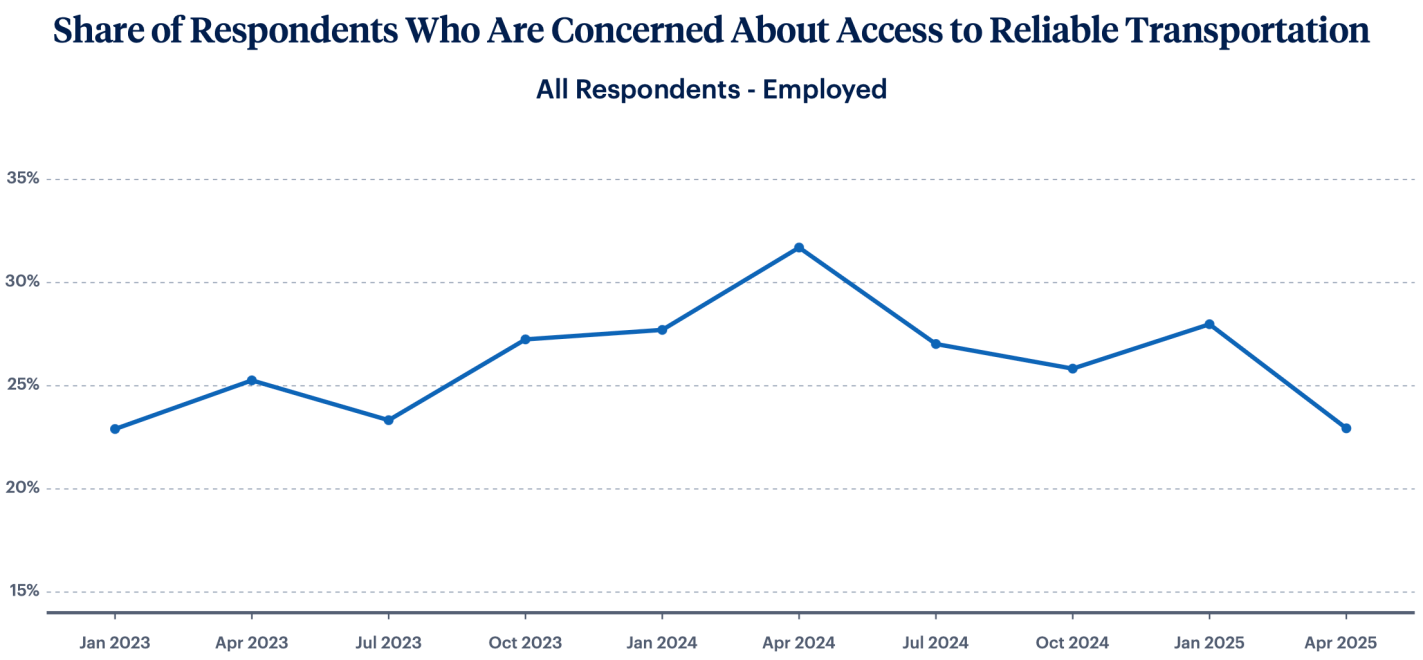
But key areas like housing, childcare, and transportation are stabilizing:
Overall I think we can synthesize these seemingly contradictory pictures by saying that Americans’ finances are fine now, but they are quite worried that things are about to get worse, perhaps due to the tariffs taking effect. You can find the rest of the LIFE survey results (including all the non-record-setting ones) here.
I’ve now posted individual-level responses to the 1978-2025 Michigan Consumer Surveys to Kaggle in CSV and Stata formats. The University of Michigan’s Consumer Surveys are a widely followed source for data on consumer confidence and inflation expectations:
Their official site is good if you just want summary tables or charts like this:
But what if you want detailed crosstabs to see how sentiment differs for different groups, or microdata so that you can run regressions? With enough clicks you can get this from what UMich calls their “cross-section archive“. But it is pretty hidden, my student looking into this thought they just didn’t offer individual-level data; and even once you get their data, it is in an unlabelled CSV file with hard-to-understand variable names and codes. So I wanted to make it clear that the full data with all responses for all years is available, and if you use my Stata version it is even reasonably easy to understand (the code I adapted for labelling it is on OSF). Then you can run your regressions, or make charts like this:
The College-Only Covid Recovery
If you’re new here, a reminder that you can find other cleaned-up versions of popular datasets on my data page.
Lately many journalists and folks on X/Twitter have pointed out a seeming disconnect: by almost any normal indicator, the US economy is doing just fine (possibly good or great). But Americans still seem dissatisfied with the economy. I wanted to put all the data showing this disconnect into one post.
In particular, let’s make a comparison between November 2019 and November 2023 economic data (in some cases 2019q3 and 2023q3) to see how much things have changed. Or haven’t changed. For many indicators, it’s remarkable how similar things are to probably the last month before anyone most normal people ever heard the word “coronavirus.”
First, let’s start with “how people think the economy is doing.” Here’s two surveys that go back far enough:
The University of Michigan survey of Consumer Sentiment is a very long running survey, going back to the 1950s. In November 2019 it was at roughly the highest it had ever been, with the exception of the late 1990s. The reading for 2023 is much, much lower. A reading close to 60 is something you almost never see outside of recessions.
The Civiqs survey doesn’t go back as far as the Michigan survey, but it does provide very detailed, real-time assessments of what Americans are thinking about the economy. And they think it’s much worse than November 2019. More Americans rate the economy as “very bad” (about 40%) than the sum of “fairly good” and “very good” (33%). The two surveys are very much in alignment, and others show the same thing.
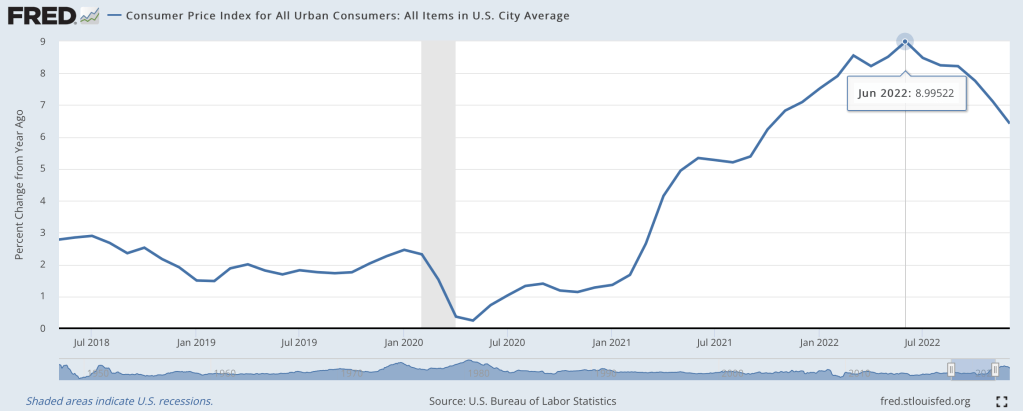
Last June I wondered if we were seeing the peak of inflation, and by at least one major measure I called the peak exactly:
At the moment, though, I’m feeling more confused than prophetic. The big question a year ago was how long it would take the Fed to get inflation down to reasonable levels, and how much collateral damage they would do to the real economy in that effort. Today most current indicators make it look like they pulled off the miraculous “soft landing”. Inflation over the last 12 months is still high, but over the last 6 months we’re nailing the Fed’s 2% annualized target. This has hit a few sectors of the real economy hard, with housing slowing dramatically and tech doing mass layoffs, but the overall picture is great: GDP growth was around 3% the last 2 quarters, and the 3.4% unemployment is the lowest since 1969.
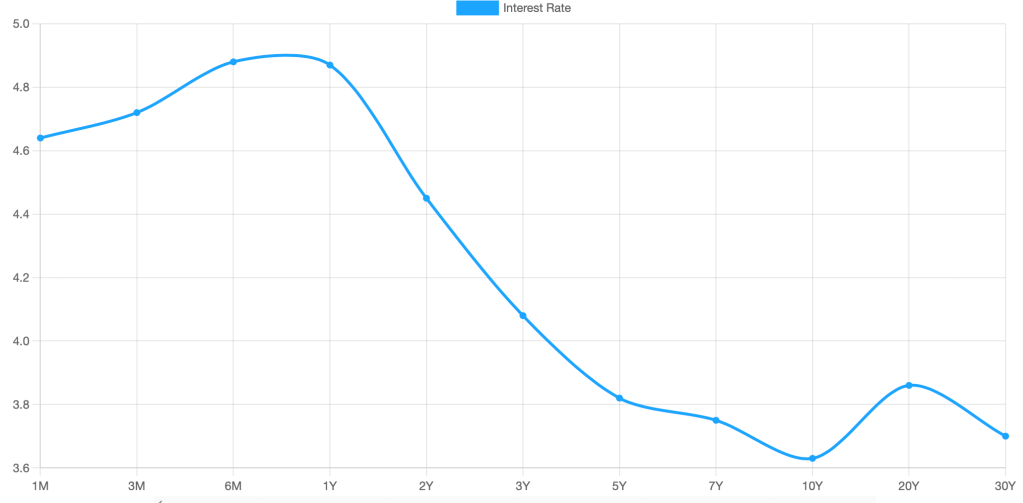
What’s confusing about this is that we have a hard time believing we really got this lucky. Its like your plane lost power, you diverted course for an emergency crash landing, and once you touch down and find yourself seemingly unharmed you look around and wonder if the plane is about to explode. Consumer sentiment is worse than it was in the depths of Covid; business sentiment has been falling for over a year and is almost down to March 2020 levels. Betting markets forecast a 50% chance of a recession in 2023, and the yield curve is strongly inverted (one of the best predictors of a recession, though the guy who first noticed this says it might not work this time):
Finally, M2 money supply is shrinking for the first time since at least 1960, and I believe the first time since the Great Depression. This bodes well for inflation continuing to moderate, but its also one more indicator of a potential recession.
To sum up, most of the indicators of the current state of the economy look great, while most indicators of its near-term future look awful. So which do we trust?
My guess is that we avoid recession in 2023, but honestly this is mostly the gut feeling of an optimist. There’s no one knock-down piece of data I’d point to in support; its more that things are currently going well, and usually the best prediction is that tomorrow will be like today unless you have a good reason to think otherwise. The main reason people expect a slowdown is because of the Fed’s actions to fight inflation. The Fed itself predicts that they will cause a slowdown, but not a recession. Their most recent summary of economic projections from December predicts GDP growth slowing to 0.5% in 2023 and unemployment rising to 4.6%.
I think the “so what” outlook is also murky. Stocks have already fallen a lot from their highs and a recession already seems somewhat ‘priced in’, so even if I thought one was coming I wouldn’t necessarily sell stocks. On the flip side US stocks are still quite expensive by historical standards, so I don’t want to buy more on the assumption that they’ll rise more on good economic news this year. You might want to lock in decent rates on long-term bonds if you think the Fed will cut rates in response to a recession, but the inverted yield curve shows this is already somewhat priced in. 1-year bonds yielding almost 5% seems decent in either scenario, I have some and I’ll probably buy more, but 5% returns are nothing to get excited about. I’d like to hear suggestions but to me the small direct betting market on a potential recession is the clearest “so what” for anyone who does have a confident view about this year’s macro picture.