Anyone who reads financial headlines knows that gold prices have soared in the past year. Why?
Gold has historically been a relatively stable store of value, and that role seems to be returning after decades of relative neglect. Official numbers show sharply increased buying by the world’s central banks, led by China, Poland, and Azerbaijan in early 2025. Russia, India and Turkey have also been major buyers. There is widespread conviction that actual gold purchases are appreciably higher than the officially-reported numbers, to side-step President Trump’s threatened extra tariffs on nations seen as de-dollarizing.
I think the most proximate cause for the sharp run-up in gold prices in the past twelve months has been the profligate U.S. federal budget deficit, under both administrations. This is convincing key world actors that the dollar will become increasingly devalued over time, no matter which party is in power. Thus, it is prudent to get out of dollars and dollar-denominated assets like U.S. T-bonds.
Trump’s erratic and offensive policies and statements in 2025 have added to the desire to diversify away from U.S. assets. This is in addition to the alarm in non-Western countries over the impoundment of Russian dollar-related assets in connection with the ongoing Russian invasion of Ukraine. Also, there is something of a self-fulfilling momentum aspect to any asset: the more it goes up, the more it is expected to go up.
This informative chart of central bank gold net purchasing is courtesy of Weekend Investing:
Interestingly, central banks were net sellers in the 1990s and early 2000s; it was an era of robust economic growth, gold prices were stagnant or declining, and it seemed pointless to hold shiny metal bars when one could invest in financial assets with higher rates of return. The Global Financial Crisis of 2008-2009 apparently sobered up the world as to the fragility of financial assets, making solid metal bars look pretty good. Then, as noted, the Western reaction to the Russian attack on Ukraine spurred central bank buying gold, as this blog predicted back in March, 2022.
Private investors are also buying gold, for similar reasons as the central banks. Gold offers portfolio diversification as a clear alternative from all paper assets. In theory it should offer something of an inflation hedge, but its price does not always track with inflation or interest rates.
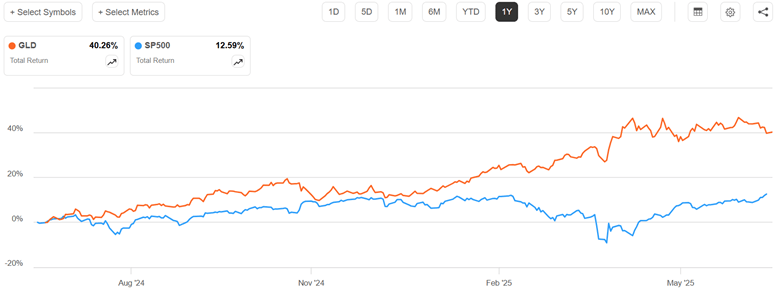
Here is how gold (using GLD fund as a proxy) has fared versus stocks (S&P 500 index) and intermediate term U. S. T-bonds (IEF fund) in the past year:
Gold is up by 40%, compared to 12.6% for stocks. That is huge outperformance. This was driven largely by the fact that gold rose strongly in the Feb-April timeframe, while stocks were collapsing.
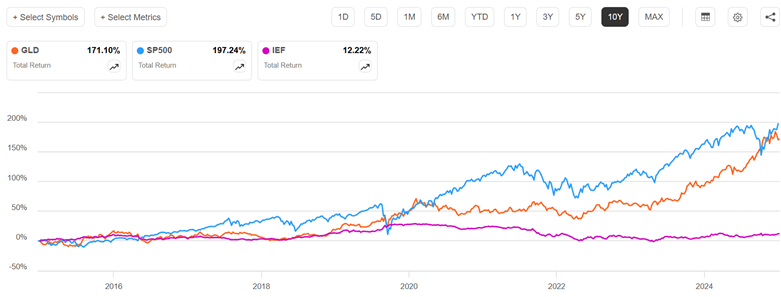
Below we zoom out to look at the past ten years, and include the intermediate-term T-bond fund IEF:
Gold prices more than doubled from 2008 to 2011, then suffered a long, painful decline over the next two years. Prices were then fairly stagnant for the mid-2010s, rose significantly 2019-2020, then stagnated again until taking off in 2023. Stocks have been much more erratic. Most of the time stock returns were above gold, but the 2020 and 2024 plunges brought stocks down to rough parity with gold. Since about 2019, T-bonds have been pathetic; pity the poor investor who has been (according to traditional advice) 40% invested in investment-grade bonds.
How to invest in gold? Hard-core gold bugs want the actual coins (no-one can afford a full bullion bar) to rub between their fingers and keep in their own physical custody. You can buy coins from on-line dealers or local dealers. Coins are available from the U.S. Mint, but reportedly their mark-ups are often higher than on the secondary market.
An easier route for most folks is to buy into a gold-backed stock fund. The biggest is GLD, which has over $100 billion in assets. There has long been an undercurrent of suspicion among gold bugs that GLD’s gold is not reliably audited or that it is loaned out; they refer derisively to GLD as “paper gold” or gold derivatives. The fund itself claims that it never lends out its gold, and that its bars are held in the vaults of the custodian banks JPMorgan Chase Bank, N.A. and HSBC Bank plc, and are independently audited. The suspicious crowd favors funds like Sprott Physical Gold Trust, PHYS. PHYS is claimed to have a stronger legal claim on its physical gold than GLD. However, PHYS is a closed-end fund, which means it does not have a continuous creation process like GLD, an open-end ETF. This can lead to discrepancies between the fund’s share price and the value of its gold holdings. It does seem like PHYS loses about 1% per year relative to GLD.
Disclaimer: Nothing here should be taken as advice to buy or sell any security.
Everybody follows a different path. Sometimes that path includes a late start on saving for retirement. Say that you have $0 in your retirement account right now. Is it too late? What can you get as a result of contributing $100 per month? Maybe more than you think.
Let’s start with an annuity equation that tells us our balance at retirement with some assumptions baked in. Let’s assume that we have zero dollars saved and contribute $100 per month. What rate of return do we earn? The S&P earns an average of 10% per year, which may not keep happening. We can conservatively assume 7.5%, but there are other concerns. Taxes and inflation will both eat away at that. Let’s subtract 2.5% for inflation with the Fisher approximation, leaving a real rate of return of 5%. We’ll chop off 20% due to taxes*. Below is the annuity equation that tells us the balance at retirement, depending on how many years from now you retire.
Assuming that you retire at 65 years of age, the graph below describes your balance at retirement depending on the age at which you started saving $100 per month. Of course, it’s not the balance that most people are worried about. Rather, we care about the implied monthly retirement check. The graph describes that on the right axis too, assuming that constant real payments will be made forever as perpetuity payments. We can see that getting started early matters a lot. But starting at age 40 still gets you real monthly retirement payments that are just shy of $200. That’s not too shabby.
Of course, nobody receives all of the perpetuity payments.
Over the winter break I was able to catch up on a lot of podcasts. I also began listening to the Marginal Revolution podcast (which is phenomenal). I especially enjoyed the final episode of season 1 about options and how many transactions can be characterized as giving someone an option. Here, the term option echoes a financial option. You pay today for the ability to do something in the future. In financial markets, you can purchase the right to buy or sell at a particular price in the future.
But lots of things count as options. Staying in the financial context, purchasing a stock gives you the option to sell that stock at the future spot price. So, in this way, something can be characterized as an option even though we are not accustomed to describing as such explicitly. More mundane transactions can also be interpreted as options. Assume that you buy a can opener. You are buying the option to have that tool on hand in the future and to open some shelf-stable food. You can choose to exercise the option simply by opening your kitchen drawer.
But financial options often include the possibility of losing money. It may be that your grocery purchases never include canned items and that you never have occasion to use your can opener. Maybe that’s a bad investment. You sunk your money into something that you never used. Except… You did in fact have the option to use the can opener. Maybe you had peace of mind that you were well prepared just in case a guest arrived with a can of something. Buying a can opener is like buying an option.
Returning to the realm of finance, let’s discuss buying on margin. Buying an asset on margin is when you borrow from your broker in order to purchase a financial asset. It’s not entirely free money. They have rules about the amount you can borrow and, of course, you must pay back the loan with interest.
Typically, the federal government spends more than it takes in. This has been going on for decades. At moderate levels, i.e. moderate debt/GDP ratios, this is not cause for concern. Presumably the national economy will grow enough to service the debt.
Historically, deficit spending would temporarily increase during some crisis like a major recession or major war, then it quickly tapered back down again. There was a general understanding, it seems, among most voters and most politicians that huge deficits were not healthy; one would not want to burden future generations with a lot of debt.
During the 2020-2021 epidemic experience, however, politicians found they got instant popularity by handing out trillions in stimulus money; anyone who squeaked that we couldn’t afford this much largesse got run over. And this spend-big, tax-small mentality has now become entrenched. Both presidential candidates have been traversing the nation promising juicy tax cuts. Apparently, we the people have decided to vote ourselves lots of free money right now, and the heck with future generations.
Here is a forecast from the Congressional Budget Office, with the optimistic assumption that we will never get another recession, showing that the recent levels of deficit are much higher than historical norms:
This is just the yearly deficit, not the exponentially-growing accumulated debt. The influence of the total debt may be seen in the mushrooming interest outlays. Below is another chart with data from the St Louis Fed, displaying both deficit level and unemployment over the past 80 years. Again, deficit spending would ramp up during recessions, due to reduced tax revenue and increased spending on unemployment benefits, etc., but then it would ramp right back down again. It failed to come back down completely after the 2008-2009 recession, and indeed started ramping up around 2016, even with low unemployment.
I don’t see this trend changing, and so investors need to take this into account. Here I will summarize some key points from analyst Lyn Alden Schwartzer in her article on the Seeking Alpha investing site titled Why Nothing Stops The Fiscal Train.
She notes that besides the primary deficit, the interest paid on the federal debt is a transfer of money to mainly the private sector, and so is further stimulus. This is one factor that has helped keep the economy stronger, and inflation higher, than it would otherwise be.
Some key bullet points in the article are
The U.S. faces structurally high fiscal deficits driven by unbalanced Social Security, inefficient healthcare spending, foreign adventurism, accumulated debt interest, and political polarization.
Investment implications suggest favoring equities and scarce assets over bonds, with defensive positions in T-bills, gold, and inflation-protected Treasury notes.
Fiscal dominance will likely lead to persistent inflation, asset price volatility, and potential stagflation, making traditional recession indicators less reliable.
A neutral-to-negative outlook on U.S. stocks in inflation-adjusted terms, with better prospects for international equities and cyclical mid-sized U.S. stocks.
She suggests looking to the recent histories of emerging economies to see what happens in nations with perhaps stagnating real economies kept afloat by ongoing federal deficits. Her tentative five-year outlook for investing is bearish on the major U.S. stock indices (gotten overpriced) and on government bonds (real returns, in light of anticipated ongoing inflation, will be low), but bullish on international stocks, inflation-protected bonds, short-term T-bills, gold, and bitcoin (again, all mainly driven by expected stubborn inflation as the money supply keeps growing):
-For U.S. stocks, I have a neutral-to-negative view on the major U.S. stock indices in inflation-adjusted terms. They’re starting from an expensive baseline, and with a high ratio of household investable assets already stuffed into them. However, I do think that among the universe of more cyclical and/or mid-sized stocks that make up smaller portions of the U.S. indices, there are plenty of reasonably priced ones with better forward prospects.
-For international stocks, I think the 2024-2025 Fed interest rate cutting cycle is one of the first true windows for them to have a period of outperformance relative to U.S. stocks for a change. It doesn’t mean that they certainly will follow through with that, but my base case is for a meaningful asset rotation cycle to occur, with some of the underperforming international equity markets having a period of outperformance. At the very least, I would want some exposure to them in an overall portfolio, to account for that possibility.
-For developed market government bonds, like the U.S. and elsewhere, I don’t have a positive long-term outlook in terms of maintaining purchasing power. A ten-year U.S. Treasury note currently yields about 3.7%, while money supply historically grows by an average of 7% per year, and $20 trillion in net Treasury debt is expected to hit the market over the next decade. So I think the long end of the curve is a useful trading sardine, but not something I want to have passive long exposure to.
-A five-year inflation-protected Treasury note, however, pays about 1.7% above CPI, and I view that as a reasonable position for the defensive portion of a portfolio. T-bills are also useful for the defensive portion of a portfolio. They’re not my favorite assets, but there are worse assets out there than these.
-Gold remains interesting for this five-year period, although it might be tactically overbought in the near-term. It has had a nice breakout in 2024, but is still relatively under-owned by most metrics, and should benefit from the U.S. rate cutting cycle. So I’m bullish as a base case.
-Bitcoin has been highly correlated with global liquidity, and I expect that to continue. My five-year outlook on the asset is very bullish, but the volatility must be accounted for in position sizes for a given portfolio and its requirements.
I’ll add two comments on this list. First, the bond market is usually pretty good about figuring things out, and has evidently realized that endless huge deficits mean endless huge bond issuance and ongoing inflation. Thus, even though the Fed is lowering short-term rates, bond buyers have started demanding higher rates on long-term bonds. And so long-term government bonds may not be as bad as Schwartzer thinks.
Second, for reasons described in The Kalecki Profit Equation: Why Government Deficit Spending (Typically) MUST Boost Corporate Earnings, when you work through the various sectoral balances in the macro economy, most of the huge deficit spend dollars will end up in either corporate earnings or in the foreign trade deficit. So the ongoing deficits will continue to buoy up U.S. corporate earnings, and hence U.S. stock prices.
Economics as a discipline really likes to boil things down to their essentials. There are plenty of examples. How many goods can one consume? Just two, bread and not bread. How can you spend your time? You can labor or leisure. How do you spend your money? Consume or save. It’s this last one that I want to emphasize here.
First, all income ultimately ends up being spent on consumption. Saving today is just the decision to consume in the future. And if not by you, then by your heirs. One determinant of inter-temporal consumption decisions is the real rate of return. That is, how many apples can you eat in the future by forgoing an apple eaten today? The bigger that number is, the more attractive the decision to save.
Further, since most saving is not in the form of cash and is instead invested in productive assets, we can also characterize the intertemporal consumption problem as the current budget allocation decision to consume or invest. The more attractive capital becomes, the more one is willing to invest rather than consume. The relative attractiveness between consumption and investment informs the consumption decision.
How attractive is investment? I’ll illustrate in two graphs. First, if the price of investment goods falls relative to consumption goods, then individuals will invest more. The graph below charts the price ratio of investment goods to consumption goods. Relative to consumption, the price of investment has fallen since 1980. Saving for the future has never been cheaper!
Of course, as in a price taker story, I am assuming that individuals don’t affect this price ratio. Truly, prices are endogenous to consumption/investment decisions. For all we know, it may be that the prices of investment goods are falling because demand for investment goods has fallen. But that doesn’t appear to be the case.
I say what economists are supposed to say. I tell everyone who will listen that they should invest in index funds and then don’t check their balances. I explain that abnormal returns stem from abnormal information. Individuals are unlikely to have abnormal insight about publicly traded companies because other people have more time and resources to find that information. Further, even if a professional has abnormal insight, it’s not likely to persist over time. Index funds get around the problem of idiosyncratic risk and the brevity of abnormal insight by riding on the back of the more informed. I say all of this and I believe it in my heart.
I teach macroeconomics and I’ve published about asset volatility. I know more about inflation and the macroeconomy than the typical investor. From mid-2020 through now the S&P500 has gained 11.3% annually. My personal return has been 21% annually. It’s true, however, that the first half of 2022 was rough. But I can’t help but feel happy and confident.*
This post is to share some observations that may be helpful to readers who, like me, were rudely surprised by the simultaneous steep decline in both bonds and stocks in the past year.
Bonds and Stocks Are No Longer Inversely Correlated
Back in the day before routine, massive Federal Reserve interventions, say before the 2008 Great Recession, there was a more or less routine business cycle. In an expansionary phase, GDP would increase, there was greater demand for loans, company profits would rise and so would stock prices and interest rates. When interest rates go up, bond prices go down. When the cycle rotated to the recessionary downside, all this would reverse. Stocks would go down, interest rates would decline and investors would flee to bonds, raising their prices.
Thus, bonds served as a good portfolio diversifier, since their prices tended to move inversely to stocks. Hence, the traditional 60/40 portfolio: 60% stocks, 40% bonds, with periodic rebalancing between the two classes.
This approach still worked sort of OK from 2008-2021 or so. The Fed kept beating interest rates lower and lower, and so bond prices kept (fitfully) rising. But at last we hit the “zero bound”. Short- and long-term interest rates went to essentially zero in the U.S. (and actually slightly negative in some other developed countries). Rates had nowhere to go but up, and so bond prices had no place go but down, no matter how stocks performed.
Trillions of dollars of federal deficit spending to pay out various COVID-related benefits in 2020-2021, along with supply chain interruptions, ignited raging inflation in 2022, which the Fed belated addressed with a series of rapid rate hikes and reductions in its bond holdings. The end of easy (nearly no-interest) money and the prospect of a recession knocked stock prices down severely in 2022. However, the rise in both short term and long term interest rates also cratered bond prices. The traditional 60/40 portfolio was decimated. Thus, in an inflationary environment with active Fed intervention, bonds are much less useful as a portfolio diversifier.
Both the stock and bond markets seem to be now driven less by real-world considerations and more by expectations of Fed (and federal government) reactions to real-world occurrences. Pundits have noted the “bad news is good news” effect on stock prices: if GDP dips or unemployment rises (which used to be considered recessionary bad news), the markets cheer, assuming that if any real economic pain occurs, the federal government will flood us with benefits and the Fed will lower rates and buy bonds and otherwise facilitate the renewed deficit spending. (See The Kalecki Profit Equation: Why Government Deficit Spending (Typically) MUST Boost Corporate Earnings for an explanation of why deficit spending normally causes a rise in corporate profits, and hence in stock prices.)
In 2022, there was practically no place to hide from investment losses. Petroleum-related stocks furnished one of the few bright spots, but that was partly a function of economies recovering that year from COVID lockdowns. There is no particular reason to believe that petroleum stocks will rise in the next market downturn. Oil and gas stocks, along with gold and other commodities, might offer a certain degree of diversification, but none of these can be assumed to normally rise (or even stay steady) when the general stock market falls.
Managed Futures Funds as Portfolio Diversifiers
It turns out that there is one class of investable assets that does tend to rise during an extended market downturn, while typically rising slowly or at least staying level during stock bull markets. That is managed futures funds. These funds observe pricing trends across a wide range of commodities and currencies and bond markets, and buy or sell futures to try to profit. If they (or their algorithms) guess right, they make steady, small gains. If there is a new, strong trend that they can buy into, they can make a lot of money quickly. Such was the case for most of 2022. It was obvious that the Fed was going to raise rates heavily that year, which would drive up interest rates and the value of the dollar versus other currencies, and would crush bond prices. The managed futures funds shorted the Euro and bonds, and made a ton of money January-November last year. Investors who held these funds were glad they did. Charts to follow.
The first chart here shows the total returns for the S&P 500 stock index (blue) and a general bond fund, BND (purple), for the past three years, ending Feb 13, 2023. (Ignore the orange curve for the moment). This chart captures the short but very sharp drop in stock prices in early 2020, as COVID lockdowns hit, but government aid was promised. Bonds did not greatly rise as stocks fell then, although after a bit of wobble they stayed fairly steady in early 2020. However, when stocks slid down and down during most of 2022, bonds went right down with them (purple drawn-in arrow), giving no effective diversification. Both stocks and bonds rose in early 2023, showing what is now a positive correlation between these two asset classes.
The next chart (below) omits the bonds line, showing just the blue stocks curve and the orange curve, which is for a managed futures fund, DBMF. The drawn-in red arrows show how DBMF only dipped a little during the COVID crash in early 2020, and it rose greatly in 2022, as stocks (blue arrow) collapsed. This shows the power of managed futures for portfolio diversification.
There was a surprising break in futures trends in November, 2022, as markets suddenly started pricing in an early Fed pivot towards easing in 2023, and so interest rates rose, and bonds and the U.S. dollar tumbled. All the managed futures funds took a sharp hit Nov-Dec 2022; some of them recovered better than DBMF, which kept drifting down for the next few months. Without getting too deep in the weeds, DBMF is an exchange-traded fund (ETF) with favorable fees and taxation aspects for the average investor. However, its holdings are chosen by observing the recent (past few weeks) behavior of other, primary managed futures funds, and trying to match the average performance of these funds. Some of these other, similar funds are EBSIX, PQTNX, GIFMX and AMFNX. These are mutual funds, rather than ETFs, with somewhat higher fees and higher minimum purchases, depending on which “class” of these funds you go with (A, C, or I).
This average matching technique is good, because the performance of any single one of the major managed futures funds can be really good or really any particular year. Some of these individual funds have done consistently horribly, so you’d be in bad shape if you happened to pick one of those. But the average of all those funds, as quantified by a relevant index, does OK and so does DBMF. However, as observed by Seeking Alpha author Macrotips Trading, because of its backwards-looking matching methodology, DBMF can be appreciably slower than other funds to adjust its positions when trends change. KMLM is another managed futures ETF, which tends to be more volatile than DBMF; higher volatility may be desirable for this asset class.
One Fund to Rule Them All
A recommended application of these managed futures funds is to replace maybe a third of your 40% bond holdings with them. Back testing shows good results for say a 15 managed futures/25 bonds/ 60 stocks portfolio, which is periodically rebalanced.
What if there was a fund which combined stocks and managed futures under one wrapper? There is one I have found, called REMIX. It has an “institutional” class, BLNDX, with higher minimum purchase and slightly lower fees, which I have bought into. The chart below shows the past three years of performance for the hybrid REMIX (orange) compared to stocks (blue) and the managed futures-only fund DBMF. We can see that REMIX stayed fairly flat during the COVID blowout in 2020, and it rose along with stocks in 2021, and went roughly flat in 2022 instead of dropping with stocks (see thick drawn-in yellow arrows). The performance of REMIX is actually better than a plain average of stocks (blue curve) and DBMF (purple), so this is an attractive “all-weather” fund. A similar hybrid (multi-asset) fund is MAFCX, which has higher fees but perhaps slightly higher returns to date. MAFCX buys stock (S&P500) futures rather than the stocks themselves, which is a leveraged play – – so for $100 investment in MAFCX you get effectively $100 worth of managed futures plus $50 worth of stock investment.
Managed futures put in an outstanding performance in 2022 because there was a well-telegraphed trend (Fed raising interest rates) in place for many months, which allowed them to make easy profits at the same time that stocks were crashing. But we cannot assume that managed futures will always go up when stocks go down. That said, managed futures will likely be reasonable diversifiers, since they should at least stay roughly level when stocks go down. The trick is to not grow impatient and dump them if their prices stagnate during a long bull stock market phase. Holding them in the form of a multi-asset fund like REMIX may help investors hang in there, since it should go up in a bull market (due to its stock component), while offering protection in a bear.
For instance, below is a five-year chart of a managed futures fund ( EBSIX, purple line ), the S&P 500 stock index (blue line), and a multi-asset fund that combines stocks and managed futures ( MAFIX, orange line. This is the institutional version of MAFCX). The charting program did not account properly for the Dec 2022 dividend of MAFIX, so I extended its curve with a short red line at the right-hand side to show what it should look like if plotted on a consistent total return basis.
With perfect hindsight, I chose a managed futures fund (EBSIX) which has performed among the best over the years; many other such funds would have looked far worse. There was a period of nearly two years (mid-2020 -early 2022) when this fund lagged far behind stocks. It was only when the 2022 catastrophe arrived that the managed future fund EBSIX proved its worth and shot up. The multi-asset fund MAFIX, which is similar to REMIX but with higher fees, basically kept up with stocks in their bull phase, then held more or less steady for 2022, and ended much higher over five years than either SP500 or the plain EBSIX.
Gordon starts by recapping four recent financial bubbles:
The commercial real estate bubble of the mid-1980s
The internet stock craze of the late 1990s (with the highest price/earnings valuations ever – – e.g., a startup called Netbank possessed nothing but a website, yet was valued at ten times book value; and went bankrupt a few years later)
The mid-00s housing bubble.
The 2020/2021 COVID bubble: “The trifecta of a ‘disruptive business model’ stock bubble, SPACs and crypto. You know how this story is ending.”
Gordon then presents an explanation of why humans keep doing financial bubbles, despite the experiences of the past. He suggests that there are both bubble addicts, who have a need to chase bubbles and therefore create them, and bubble enablers who are only too happy to make money off the addicts.
THE BUBBLE ADDICTS
The greedy. Some of us just think we deserve more. I think of an acquaintance who said he was approached to invest with Bernie Madoff, who famously promised steady 10% returns. My friend turned down the offer because he required 15% returns.
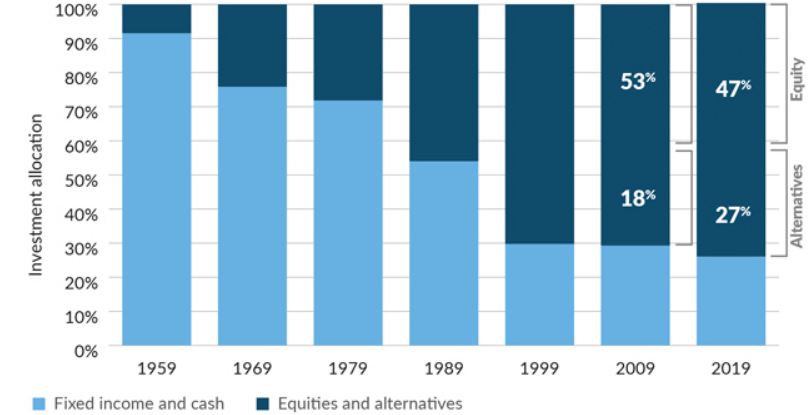
Pension funds. This $30 trillion pool of investment dollars targets about a 7% return in order to meet future pension obligations. If pension fund managers can’t consistently earn at least 7%, they have to go to their sponsor – a state government, a corporate CEO, etc. – and ask for more money, or for pension benefits to be cut. And probably lose their job in the process.
Back in the day, bonds were the mainstay pension fund investment. But over the past 20 years, bond yields haven’t gotten the pensions anywhere close to 7%. So increasingly they have invested in stocks and alternative investments like private equity, as this chart shows:
And venture capital fundraising, in large part from pension funds, has soared since the pandemic…
How many great new ideas are out there for venture capitalists to invest in? [Obviously, not an unlimited number]. So their investments are by necessity getting riskier. But if the pension funds back away from the growing risk, they have to admit they can’t earn that 7%. Then bad things happen, to retirees and to pension plan sponsors and then to pension fund managers. So pension fund managers are pretty much addicted to chasing bubbles.
The relatively poor. The “absolutely poor” have income below defined poverty levels. The “relatively poor” feel that they should be doing better, because their friends are, or their parents did, or because the Kardashians are, or whatever. Their current income and prospects just aren’t getting them to the lifestyle they aspire to. [Gordon provides example of folks chasing meme stocks and crypto, and getting burned]. …But can the relatively poor just walk away from chasing bubbles? Not without giving up dreams of better lifestyles.
THE BUBBLE FEEDERS
Bubbles don’t just spontaneously occur; they require skilled hands to shape them. And those skilled hands profit handsomely from their creations. Who are these feeders?
Private equity and venture fund managers. They typically earn a 2% management fee plus 20% of profits earned. That adds up fast. A $10 billion venture fund could easily generate $400 million a year in income, spread among a pretty small group of people. VC News lists 14 venture capitalists who are billionaires.
SPAC sponsors. [ A SPAC (Special Purpose Acquisition Company) is a shell corporations which raises money through stock offerings, for the purpose of going out and buying some existing company. SPAC sponsors make a bundle, and so are motivated to promote them. SPACs proliferated in 2020-2021, and for a while pumped money into acquiring various small-medium “growth” companies. But now it is clear that there are not a lot of great underpriced companies out there for SPACs to buy, so SPACs are fizzling]
Wall Street earns fees from (A) raising funds for private equity, venture capital and SPACs, (B) buying and selling companies, (C) trading bubble stocks, crypto, etc., and (D) other stuff I’m not thinking of right now.
The Federal Reserve. Part of the Federal Reserve’s mandate is to reduce unemployment. Lowering interest rates increases stock values, which creates wealth, which drives the “wealth effect”. The wealth effect is the estimate that households increase their spending by about 3% as their wealth increases. More spending increases GDP, which reduces unemployment, which makes the Fed happy, and politicians happy with the Fed.
In my view, the wealth effect is why the supposed economic geniuses at the Fed never figure out that bubbles are occurring, so they never take steps to minimize them.
Social media and CNBC certainly benefit from more viewers while bubbles are blowing up [i.e., inflating].
INVESTING IN CURRENT MARKET ENVIRONMENT
Gordon sees us still in recovery from the recent bubble of “disruptor companies” and crypto, and so the market may have more than the usual choppiness in the next year. So he advises being nimble to trade in and out, and not mindlessly commit to being either long or short. “Value stocks are probably the best near-term bet, even if they can’t offer the adrenaline jolt offered by bubble stocks.”
There’s still a few more days left in the year, but at this point it is safe to say, unfortunately, that it was a very bad year for investing. This Google chart shows most of the bad news. Note: nothing in this post is investment advice about the future, just a summary of the past.
The S&P 500, the typical benchmark for US equities, was down 20%. Bonds, usually a safe haven, were down over 14% as measured by the Vanguard Total Bond fund (more on bonds later).
Gold, the traditional hedge against bad times, was flat. I guess that’s not so bad. But gold is also traditionally considered a hedge against inflation, and inflation will probably end up being somewhere in the range of 5-7% this year (depending on your preferred index). So in real terms, even gold was down. And the supposed new hedge against fiat currency? Bitcoin is down 65% (crypto has other potential redeeming features, but inflation hedging was supposed to be one of them).
Did anything do well? Oil was basically flat too, starting and ending the year in the $75-80 range. Of course, oil companies did very well this year — Exxon is up over 70%, since prices were elevated for much of the year. But picking individual stocks is always fraught with danger. For example, you might think electric car companies would have done well in the past year, given the high gas prices for much of the year, yet Tesla was down over 70% (I won’t speculate here about why, but it may have other idiosyncratic explanations).
There is one boring, sleeper investment that would have earned you a decent return. Not a massive return, but one that will likely be slightly higher than the rate of price inflation (once we have complete inflation data). And the investment is totally safe, and by April you would have known exactly your rate of return for the full year: 8.5%.
That investment? Series I Savings Bonds, issued by the US Treasury. Series I Bonds pay a fixed rate of return for 6 months, which you know at the time you buy it. The interest rate rests every 6 months based on the rate of CPI inflation. If you invested in these bonds in January 2022, you would have earned 3.56% for 6 months, and then you would have earned 4.81% for the second half of 2022. And this was all known as early as April 2022 (though not officially confirmed by the Treasury until May).
While a lot of people were talking about the possibility of high inflation at the beginning of 2022, I don’t recall many people advising anyone to buy these bonds. It’s not a super well known investment, and not super exciting. Plus each investor is capped at $10,000 per year in most cases, so you couldn’t have moved all your money into I Bonds. Another restriction is that you lose some of the interest if you pull the money out before 5 years.
Still, this was one bright spot in an otherwise terrible year for most broad investment types.


