Every semester in my intro STAT course I have my students create a variety of survey questions. After I combine their questions into a single survey, they collect responses from the student body at Ave Maria University. Most of the questions are vanilla. Other are not. They typically get in excess of 100 responses from the ~1,100 person student body.
While exploring the data, I found a really beautiful example for the week that we spend on multiple regression and dummy variables. The survey results illustrate a clear, linear association between student height (inches) and their student experience at AMU (scored 1-10).

So strange! Why might this be? Except for that solitary 7 ft+ student on the basketball team, how in the world might height matter for student experience?
As it turns out a separate relationship holds the key.

Confirmed with a simple unpaired t-test (unequal variances), women rank their student experience much more highly. For this, students have multiple explanations at the ready.
- Our school is in a rural location and women are more socially satisfied.
- Men are less happy generally.
- Men are less studious or have lower grades.
- Men get less sleep and stay up later
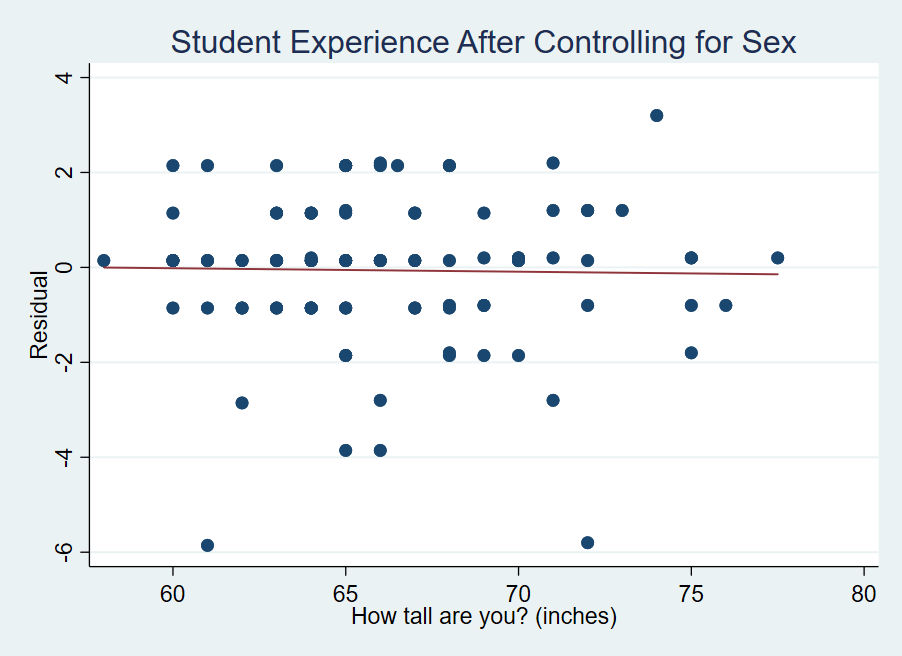
The list goes on and I don’t know what the reasoning is or which ones actually play a role. But what I do know, is how to make fun scatterplots in Stata. As it turns out, if you control for sex, height loses all of its effects on student experience. Men are taller on average and they aren’t happy students relative to women (apparently). We can see in the figure below that all of the action in the two fitted lines occurs in the intercept. The slopes are practically flat for both men and women. In other words, height neither adds nor subtracts from a student’s experience rating.

What’s going on is that neither men’s nor women’s experience is affected by being taller. But, what’s actually going on here – you know – statistically? The simple version is that the bar chart above dominates the scatter plot. If we subtract the mean male experience score from the male values and do the same for the females, then we’re left with what is practically white-noise. How do all those other students of a different height experience the world? Well, as students, not so differently from you.