Text books say that there are two major problems with the Consumer Price Index (CPI). First, accounting for changes in quality is difficult. Second, the CPI is calculated by assuming a fixed basket of goods is consumed over time. For both of these reasons, the rate of inflation that is implied by CPI is typically considered to be about 1% overestimated.
Imperfectly accounting for quality improvements causes higher measured inflation because the stream of services that a product creates for the consumer has increased – even though the product is nominally the same product. For example, the camera on my smart-phone is now good enough to record a high-quality Youtube video, whereas it was of mediocre quality on my previous phone. My life is better-off with the better camera. But the increase in my quality of life isn’t measured by the CPI. The CPI does, however, make note that I paid a higher price for a phone.
Further, people don’t consume a fixed basket of goods over time. Even if we stopped the introduction of all new products and maintained the quality of all current products, people would still change the composition of their consumption due to price changes among related goods.
When people get hot and bothered by inflation, they often appeal to people who are of less means and who would find higher prices more burdensome. For that reason, below is a graph of some calorically dense and roughly comparable food staple prices (from the PPI). You can put a protein on top of any one of these and call it a meal: pasta, flour, potatoes, & rice.
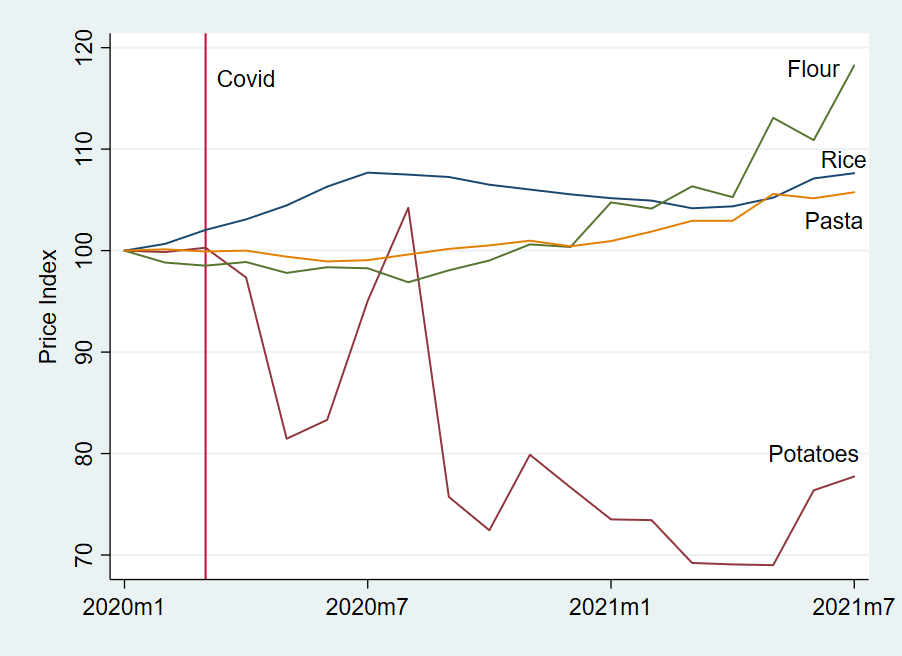
Let’s say that a consumer consumed equal parts of these in January of 2020. The CPI assumes that the consumption basket remains constant and plots a weighted average. In such a case, price rose 2.3% through July 2021. But in real life, penny-pinchers gonna pinch. If our consumer is particularly Spartan, then he will always consume the cheapest option – he treats the different foods as perfect substitutes. The Spartan price of consuming *fell* 22.3%. To be clear, the CPI assumes that the consumption composition remains unchanged, while the consumer’s actual basket is responsive to price changes. Even if a consumer considers these goods to be imperfect substitutes and is willing to cut any particular type of consumption in half in favor of the cheapest alternative, then the price fell by 10%. In fact, a consumer who is at all responsive to prices will always have a cheaper basket than the headline CPI, all else constant.

In conclusion, be careful with your money. Spend it well and seek out alternatives. Your flexibility determines how much money you’ll have at the end of the month. The headline CPI number impacts only the most passive consumer – and even then, budget constraints gonna constrain.

The path for flour is not what I was expecting. There was a major shortage of consumer sized bags for flour around April 2020, but the price chart makes it look like the price did not increase until a year later.
LikeLike
Good Call. These indices are from the PPI which measures the price that sellers receive. If there were retail disruptions due to the quickly changing composition of flour demand, then that would show up more in the retail rather than the producer prices. As we know, Covid introduced transportation and logistical disruptions. Greater transaction costs creates a wedge between what consumers pay and what producers receive. While sensible, IDK the reason in particular.
LikeLike