In my Labor Economics class, I do a lecture on empirical work and the minimum wage, starting with Card & Kreuger (1993). I’m going to quickly tack on the new working paper by Clemens & Strain “The Heterogeneous Effects of Large and Small Minimum Wage Changes: Evidence over the Short and Medium Run Using a Pre-Analysis Plan”.
The results, as summarized in the second half of their abstract are:
relatively large minimum wage increases reduced employment rates among low-skilled individuals by just over 2.5 percentage points. Our estimates of the effects of relatively small minimum wage increases vary across data sets and specifications but are, on average, both economically and statistically indistinguishable from zero. We estimate that medium-run effects exceed short-run effects and that the elasticity of employment with respect to the minimum wage is substantially more negative for large minimum wage increases than for small increases.
The variation in the data comes from choices by states to raise the minimum wage.
A number of states legislated and began to enact minimum wage changes that varied substantially in their magnitude. … The past decade thus provided a suitable opportunity to study the medium-run effects of both moderate minimum wage changes and historically large minimum wage changes.
We divide states into four groups designed to track several plausibly relevant differences in their minimum wage regimes. The first group consists of states that enacted no minimum wage changes between January 2013 and the later years of our sample. The second group consists of states that enacted minimum wage changes due to prior legislation that calls for indexing the minimum wage for inflation. The third and fourth groups consist of states that have enacted minimum wage changes through relatively recent legislation. We divide the latter set of states into two groups based on the size of their minimum wage changes and based on how early in our sample they passed the underlying legislation.
The “large” increase group includes states that enacted considerable change. New York and California “have legislated pathways to a $15 minimum wage, the full increase to which firms are responding exceed 60 log points in total.” Data comes from the American Community Survey (ACS) and the Current Population Survey (CPS).
The main specification is:
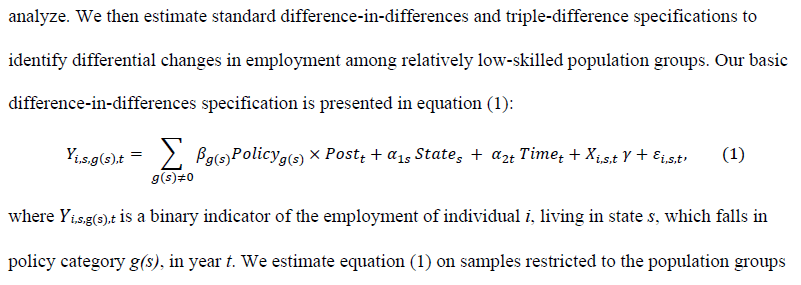
X is a set of controls, such as the house price index for a region. Policy represents binary indicators for whether a state fits into a given policy group. Before using a complex difference-in-difference model with controls, they present summary comparisons.
The remaining panels of Figures 4 and 5 display employment trends among the skill groups in our primary analysis samples. As summarized in Table 6, employment among individuals ages 16 to 25 with less than a completed high school education (labeled “Low-Skilled Employment” in the table), as measured in the ACS, expanded 4.0 percentage points less by 2019 in states that enacted large minimum wage changes than in states that enacted no minimum wage change. In the CPS (Table A4), the measured difference was –3.2 percentage points.
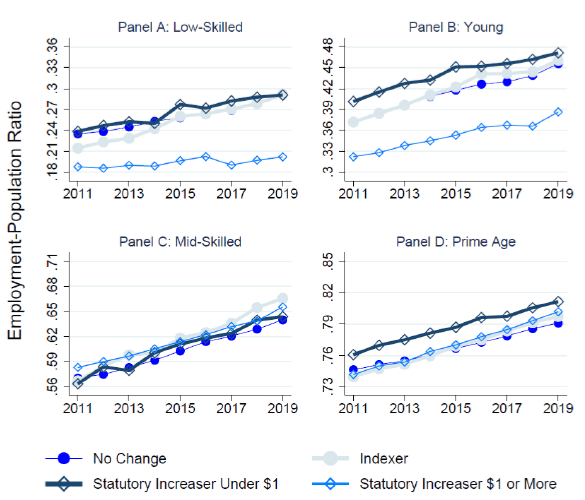
Figure 4. Employment Series in the ACS: This figure plots average annual employment rates for each of our four policy groups, broken out across four subsamples, from 2011 to 2019. Panel A plots employment rates for low-skilled individuals, defined as individuals ages 16 to 25 without a completed high school education. Panel B plots employment rates for young adults…
Theory predicts that those most affected by the minimum wage are young people and low-skilled workers. Their employment level is lower in states that enacted large minimum wage increases. That’s the visual interpretation, using the ACS data. The pattern seems even more pronounced in Figure 5 using CPS data.
There are some differences between the average person in stage group (1) versus state group (4). Those in (4) have higher per capital incomes and live in places with higher home prices.
As Clemens says in his tweet thread about the paper
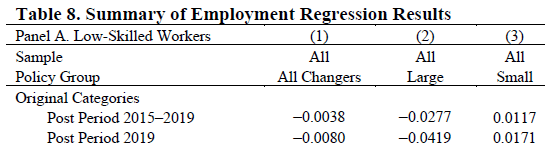
The regression model allows for those features to be incorporated as controls. Table 8 shows, “estimates of the change in the employment rate among individuals in our analysis samples from states that increased their minimum wages relative to individuals in states that did not increase their minimum wages.”
The coefficient 𝛽g(s) is an estimate of the causal effect of states’ minimum wage policy changes on employment… The key assumption is that employment among low-skilled individuals would, in the absence of the minimum wage changes we analyze, have evolved similarly across the various groups of states.
You can see here that 4 out of 6 of the estimates in my small screenshot are negative. Their summary of the results in Table 8 is:
Our first finding is that large statutory minimum wage changes are, on average, associated with a differential employment decline of roughly 2.6 percentage points across the full set of specifications we estimate using both of our primary analysis samples. Across the full set of estimates, roughly four-fifths are statistically distinguishable from zero. Estimates are systematically more negative for the sample consisting of individuals ages 16 to 25 with less than a completed high school education than for the larger sample of all individuals ages 16 to 21… Second, the results imply that the medium-run effects of large minimum wage changes are nontrivially larger than their short-run effects.
I cover, early on in the class, the theory that supply and demand are more elastic in the long run.
The paper authors talk at length about their pre-analysis plan and empirical strategy. Practitioners can learn a lot from this paper. If you prefer tweet storms to reading the paper, here is Clemens on pre-registering.
Clemens and Strain dropped the word “tasseography” (footnote 20). I had to look it up. Now I have learned about econometrics, and I learned a new word.
For excellent and timely coverage of how Clemens and Strain fits with other recent methods and minimum wage studies, see Scott Cunningham on Three minimum wage papers walk into a bar…. . And Scott also did a dive on difference-in-differences and the Meer&West paper. It’s hard to keep up with all the content, but Scott is doing great work on his substack in addition to his book, which I ended up referencing yesterday for the nice R code he provided.

Reblogged this on Utopia, you are standing in it!.
LikeLike