Willingness to be Paid Treatments

This is the second of two blog posts on my paper “Willingness to be Paid: Who Trains for Tech Jobs”. Follow this link to download the paper from Labour Economics (free until November 27, 2022).

Last week I focused on the main results from the paper:

  • Women did not reject a short-term computer programming job at a higher rate than men.
  • For the incentivized portions of the experiment, women had the same reservation wage to program. Women also seemed equally confident in their ability after a belief elicitation.
  • The main gender-related outcomes were, surprisingly, null results. I ran the experiment three times with slightly different subject pools.
  • However, I did find that women might be less likely to pursue programming outside of the experiment based on their self-reported survey answers. Women are more likely to say they are “not confident” and more likely to say that they expect harassment in a tech career.
  • In all three experiments, the attribute that best predicted whether someone would program is if they say they enjoy programming. This subjective attitude appears more important even than having taken classes previously.
  • Along with “enjoy programming” or “like math”, subjects who have a high opportunity cost of time were less willing to return to the experiment to do programming at a given wage level.

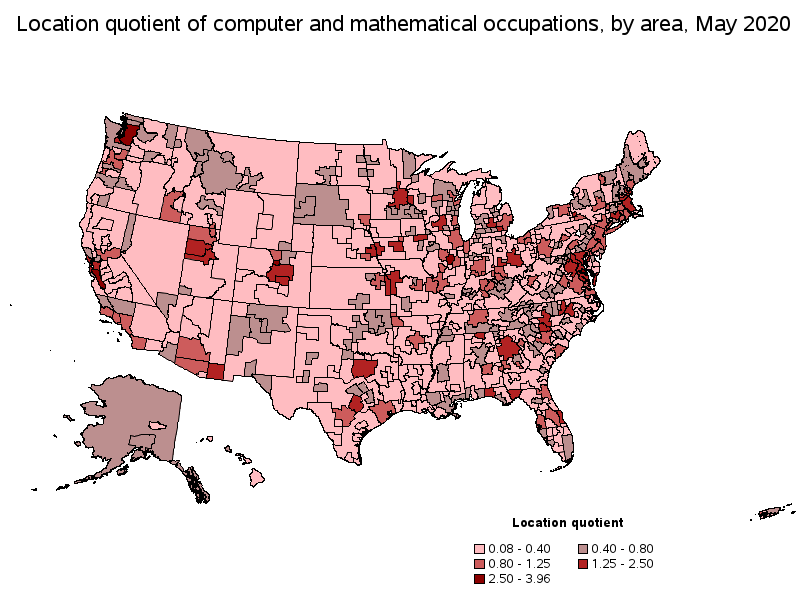
I wrote this paper partly written to understand why more people are not attracted to the tech sector where wages are high. This recent tweet indicates that, although perhaps more young people are training for tech than ever before, the market price for labor is still quite high.

The neat thing about controlled experiments is that you can randomly assign treatment conditions to subjects. This post is about what happened after adding either extra information or providing encouragement to some subjects.

Informed by reading the policy literature, I assumed that a lack of confidence was a barrier to pursuing tech. A large study done by Google in 2013 suggested that women who major in computer science were influenced by encouragement.

I provided an encouraging message to two treatment groups. The long version of this encouraging message was:

If you have never done computer programming before, don’t worry. Other students with no experience have been able to complete the training and pass the quiz.

Not only did this not have a significant positive effect on willingness to program, but there is some indication that it made subjects less confident and less willing to program. For example, in the “High Stakes” experiment, the reservation wage for subjects who had seen the encouraging message was $13 more than for the control subjects.

My experiment does not prove that encouragement never matters, of course. Most people think that a certain type of encouragement nudges behavior. My results could serve as a cautionary tale for policy makers who would like to scale up encouragement. John List’s latest book The Voltage Effect discusses the difficulty of delivering effective interventions at scale.

The other randomly assigned intervention was extra information, called INFO. Subjects in the INFO treatment saw a sample programming quiz question. Instead of just knowing that they would be doing “computer programming,” they saw some chunks of R code with an explanation. In theory, someone who is not familiar with computer programming could be reassured by this excerpt. My results show that INFO did not affect behavior. Today, most people know what programming is already. About half of subjects said that they had already taken a class that taught programming. Perhaps, if there are opportunities for educating young adults, it would be in career paths rather than just the technical basics.

Since the differences between treatments turned out to be negligible, I pooled all of my data (686 subjects total) for certain types of analysis. In the graph below, I group every subject as either someone who accepted the programming follow-up job or as someone who refused to return to program at any wage. Recall that the highest wage level I offered was considerably higher on a per-hour basis than what I expect their outside earning option to be.

Fig. 5. Characteristics of subjects who do not ask for a follow-up invitation, pooling all treatments and sample

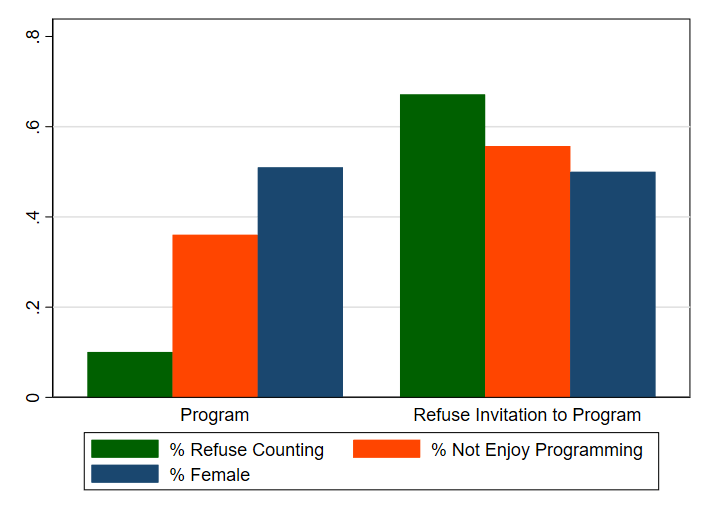
I’ll discuss the three features in this graph in what appear to be the order of importance for predicting whether someone wants to program. There was an enormous difference in the percent of people who were willing to return for an easy tedious task that I call Counting. By inviting all of these subjects to return to count at the same hourly rate as the programming job, I got a rough measure of their opportunity cost of time. Someone with a high opportunity cost of time is less likely to take me up on the programming job. This might seem very predictable, but this is a large part of the reason why more Americans are not going into tech.

Considering the first batch of 310 subjects, I have a very clean comparison between the programming reservation wage and the reservation wage for counting. People who do not enjoy programming require a higher payment to program than they do to return for the counting job. Self-reported enjoyment is a very significant factor. The orange bar in the graph shows that the majority of people who accepted the programming job say that they enjoy programming.

Lastly, the blue bar shows the percent of female subjects in each group. The gender split is nearly the same. As I show several ways in the paper, there is a surprising lack of a gender gap for incentivized decisions.

I hope that my experiment will inspire more work in this area. Experiments are neat because this is something that someone could try to replicate with a different group of subjects or with a change to the design. Interesting gaps could open up between subject types under new circumstances.

The topic of skill problems in the US represents something reasonably new for labor market and public policy discussions. It is difficult to think of a labor market issue where academic research or even research using standard academic techniques has played such a small role, where parties with a material interest in the outcomes have so dominated the discussion, where the quality of evidence and discussion has been so poor, and where the stakes are potentially so large.

Cappelli, PH, 2015. Skill gaps, skill shortages, and skill mismatches: evidence and arguments for the United States. ILR Rev. 68 (2), 251–290.

Clemens and Strain on Large and Small Minimum Wage Changes

In my Labor Economics class, I do a lecture on empirical work and the minimum wage, starting with Card & Kreuger (1993). I’m going to quickly tack on the new working paper by Clemens & Strain “The Heterogeneous Effects of Large and Small Minimum Wage Changes: Evidence over the Short and Medium Run Using a Pre-Analysis Plan”.

The results, as summarized in the second half of their abstract are:

relatively large minimum wage increases reduced employment rates among low-skilled individuals by just over 2.5 percentage points. Our estimates of the effects of relatively small minimum wage increases vary across data sets and specifications but are, on average, both economically and statistically indistinguishable from zero. We estimate that medium-run effects exceed short-run effects and that the elasticity of employment with respect to the minimum wage is substantially more negative for large minimum wage increases than for small increases.

The variation in the data comes from choices by states to raise the minimum wage.

A number of states legislated and began to enact minimum wage changes that varied substantially in their magnitude. … The past decade thus provided a suitable opportunity to study the medium-run effects of both moderate minimum wage changes and historically large minimum wage changes.

We divide states into four groups designed to track several plausibly relevant differences in their minimum wage regimes. The first group consists of states that enacted no minimum wage changes between January 2013 and the later years of our sample. The second group consists of states that enacted minimum wage changes due to prior legislation that calls for indexing the minimum wage for inflation. The third and fourth groups consist of states that have enacted minimum wage changes through relatively recent legislation. We divide the latter set of states into two groups based on the size of their minimum wage changes and based on how early in our sample they passed the underlying legislation.

The “large” increase group includes states that enacted considerable change. New York and California “have legislated pathways to a $15 minimum wage, the full increase to which firms are responding exceed 60 log points in total.” Data comes from the American Community Survey (ACS) and the Current Population Survey (CPS).

Continue reading

Results on stability and gift-exchange

Bejarano, Corgnet, and Gómez-Miñambres have a newly published paper on gift-exchange.

Abstract: We extend Akerlof’s (1982) gift-exchange model to the case in which reference wages respond to changes in economic conditions. Our model shows that these changes spur disagreements between workers and employers regarding the reference wage. These disagreements tend to weaken the gift-exchange relationship, thus reducing production levels and wages. We find support for these predictions in a controlled yet realistic workplace environment. Our work also sheds light on several stylized facts regarding employment relationships, such as the increased intensity of labor conflicts when economic conditions are unstable.

Next, I will provide some background on gift-exchange and experiments.

Continue reading

Paul Fain Highlights Illiteracy

Paul Fain writes a newsletter called The Job. The newsletter typically presents a few paragraphs one topic and then provides summaries and links to relevant news and current research. I subscribe because I write on and teach labor economics. The title of the letter this week is “Skills and Employability”.

As federal and state governments mull big spending on skills training, some experts say more resources should go toward boosting the literacy and numeracy of Americans without college degrees.

And despite the widespread belief that a quality liberal education in a college degree program is the best way to develop the sort of highly sought skills that pay off in the job market, many college degree holders also lack proficiency in literacy and numeracy.

Fain’s cites a recent essay by Irwin Kirsch calling for more opportunities for illiterate adults to achieve literacy, so that they can take advantage of continuing professional education. Kirsch is calling for more education so that the adults can do yet more education. I’m an educator and find myself sympathetic to Kirsch’s plan.

Continue reading

More computer jobs than San Francisco

The U.S. Bureau of Labor Statistics reports Occupational Employment and Wages from May 2020 for

15-0000 Computer and Mathematical Occupations (Major Group). The website contains a few interesting insights.

Where are the computer jobs in the United States? When looking just at total numbers of jobs, three major population centers make it into the top 7 areas: NYC, LA, and Chicago. San Francisco is ahead of Chicago, while San Jose is behind Chicago. In terms of the total number of jobs, the D.C. area is ahead of any West Coast city. Is Silicon Valley not as central as we thought?

Here’s a map of the U.S. that isn’t just another iteration of population density.

When metropolitan areas are ranked by employment in computer occupations per thousand jobs, then New York City no longer makes the top-10 list. San Jose, California reigns at the top, which seems suitable for Silicon Valley. The 2nd ranked area will surprise you: Bloomington, IL. A region of Maryland and Washington D.C. shouldn’t surprise anyone. If you aren’t familiar with Alabama, then would you expect Huntsville to rank above San Francisco in this list?

Huntsville, AL is not a large city, but it is a major hub for government-funded high-tech activity. The small number of people who live there overwhelmingly selected in to take a high-tech job. For an example, I quickly checked a job website to sample in Huntsville. Lockheed Martin is hiring a “Computer Systems Architect” based in Huntsville.

Anyone familiar with Silicon Valley already knows that the city of San Francisco was not considered core to “the valley”. Even though computer technology seems antithetical to anything “historical”, there is in fact a Silicon Valley Historical Association. They list the cities of the valley, which does include San Francisco. (corrected an error here)

The last item reported on this Census webpage is annual mean wage. For that contest, San Francisco does seem grouped with the San Jose area, at last. The computer jobs that pay the most are in Silicon Valley or next-door SF. Those middle-of-the-country hotspots like Huntsville do not make the top-10 list for highest paid. However, if cost of living is taken into account, some Huntsville IT workers come out ahead.

Current Research on the Gig Economy – Palagashvili

Online platforms are allowing us to trade used goods more easily than before. Similarly, sites like UpWork and Uber are making it easier to trade small blocks of human labor. Since the gig economy is growing (as documented by Dimitri Koustas), it’s important to understand how it is affecting workers.

Liya Palagashvili of Mercatus has a working paper with Paoula Suarez “Women as Independent Workers in the Gig Economy” examining particularly how the growing opportunities to work on a gig basis has affected women in different ways than men. They note, for example, that (in 2014–2015) 87 percent of independent workers on the Etsy platform were female, while 14 percent of workers on Uber’s platform were female.

Abstract: New technologies and digital platforms have ushered in a rise of gig, freelance, contract, and other types of independent work. Although independent workers and the gig economy as a whole have received plenty of attention, little research has examined the heterogeneity of work characteristics among different independent work opportunities, specifically as it relates to the participation of women in this workforce. Existing data indicate that some digital platforms are more male dominated, whereas others are more female dominated. What accounts for these differences? In this paper, we empirically examine the heterogeneity of work within independent work opportunities in relation to female participation by analyzing work characteristics in the United States from the Occupational Information Network (O*Net) database that reflect greater temporal flexibility, which has been shown to vary across occupations and to attract more female workers. Our findings suggest that women in the independent work context do self-select into the types of independent work jobs that reflect greater temporal flexibility, as is the case for women working in traditional employment. However, our findings also reveal that the way in which the existing literature measures temporal flexibility in traditional work settings may not be the same as the way it is measured in the context of independent work. We discuss the implications of our findings for public policy and labor laws. (emphasis mine)

Current Research on the Gig Economy – Koustas

Dmitri Koustas of U. Chicago has a forthcoming paper “Is New Platform Work Different than Other Freelancing?”

Abstract: The rise of freelance work in the online platform economy (OPE) has received considerable media and policy attention in recent years, but freelance work is by no means a new phenomenon. In this paper, we draw on I.R.S. tax records to identify instances when workers begin doing online platform work versus other freelance/independent contractor “gig” work for firms. We find gig work occurs around major reductions in outside income, and document usage over the lifecycle. Our results provide suggestive evidence on motivations for entering into each type of work. (emphasis mine)

His work was cited in the LA Times last year

people take on this work primarily because they’ve lost a job or some of their income — and particularly for younger workers, app-based services have been significantly more lucrative than more traditional side hustles.

I got to (virtually) talk to Dmitri Koustas, who is now a leading expert on gig work, this week. He became interested in the gig economy when he was thinking through a more traditional econ. question of generally how people modulate their labor supply in response to income shocks.

He also has a working paper “Is Gig Work Replacing Traditional Employment? Evidence from Two Decades of Tax Returns”

First half of the Abstract: We examine the universe of tax returns in order to reconcile seemingly contradictory facts about the rise of alternative work arrangements in the United States. Focusing on workers in the “1099 workforce,” we document the share of the workforce with income from alternative, non-employee work arrangements has grown by 1.9 percentage points of the workforce from 2000 to 2016. More than half of this increase occurred over 2013 to 2016 and can be attributed almost entirely to dramatic growth among gigs mediated through online labor platforms. We find that the rise in online platform work for labor is driven by earnings that are secondary and supplemental sources of income. Many of these jobs do not show up in self-employment tax records… (emphasis mine)

Working Hard for the Money

40 hours. That’s what we think of as a typical workweek. 8 hours per day. 5 days per week. Perhaps the widespread practice of working from home during the pandemic (as well as the abnormal schedule changes for those unable to work from home), has led some to rethink the nature of the workweek. But the truth is that the workweek has always been evolving.

Take this chart, for example. It comes from Our World in Data (be sure to read their excellent related essay as well), and the historical data comes from a paper by Huberman and Minns. I’ve singled out 4 countries, but you can add others at the OWiD link.

The historical declines are dramatic. This is especially true in Sweden. The average Swedish worker labored for over 3,400 hours per year in 1870. Today, that’s down to 1,600 hours. In other words, the typical Swede works less than half as many hours as her historical counterpart. Wow! The decline for the US is not quite as dramatic, but still astonishing: a US worker today labors for only about 57% of the hours of his 1870 predecessor.

It’s tempting to focus on the differences across countries today: the average worker in the US works about 250 hours more than the average French worker. That’s 6 weeks of vacation! And as recently as 1980, the US and France were roughly equal on this measure. We might also wonder why these historical changes happened. For a very brief introduction to the research, I recommend the last section of this essay by Robert Whaples.

But still, the historical declines are dramatic, even if we in the US haven’t seen much improvement in the past generation (and those poor Swedes, working 100 hours per year more than 40 years ago).

I think another natural question to ask is whether GDP data is distorted, at least as a measure of well being, given these differences in working hours. The answer is partially. Let’s look at the data!

Continue reading