In previous blog posts, I’ve used the Simpsons as an example of a typical family to use for historical comparisons. In a post on mortgage payments, I found that it’s slightly easier to make a mortgage payment on Homer’s salary than in the early 1990s. In a post on taxes, I showed that the Simpsons now pay a much lower average tax rate than they did in the 1990s (guess all those tax cuts didn’t just go to the rich!).
Now, the Simpsons and economics are back at the front of the discourse about standards of living. The 33rd season finale of the show is all about whether the middle class can get by economically these days. And Planet Money’s “The Indicator” podcast (great program!) has a podcast about the show, which is a follow-up to a similar podcast last year called “Are The Simpsons Still Middle Class?” (apparently part of the influence for the recent Simpsons episode).
In that podcast from last year, they say “Tuition has more than doubled. Health care costs have more than doubled. I believe housing costs have more than doubled.” And they follow-up, for good measure with “Even after adjusting for inflation, college tuition has more than doubled since ‘The Simpsons’ started.”
Since we’ve already looked at housing costs for Homer, let’s look at the potential college costs for Bart. I’m going to assume Lisa will be fine, probably getting a free-ride (and a hot plate!) to one of the Seven Sisters or maybe even Harvard. But if Bart wants to go to college, the Simpsons will probably be paying out of pocket.
An important factor to consider when looking at college prices is not just the “sticker price,” or the published price, but to also look at what is known as the “net price.” The net price takes into account the average amount of aid that a student receives. This is important to consider at any time, but especially for data in more recent years since discounting has become a major part of the college pricing landscape. For example, at private colleges the average discount is now over 50%, with some colleges essentially giving some discount to 100% of students (in other words, at some colleges no one actually pays the sticker price). Discounting at public colleges isn’t quite as out-of-control as private colleges, but it’s still a major part of college pricing.
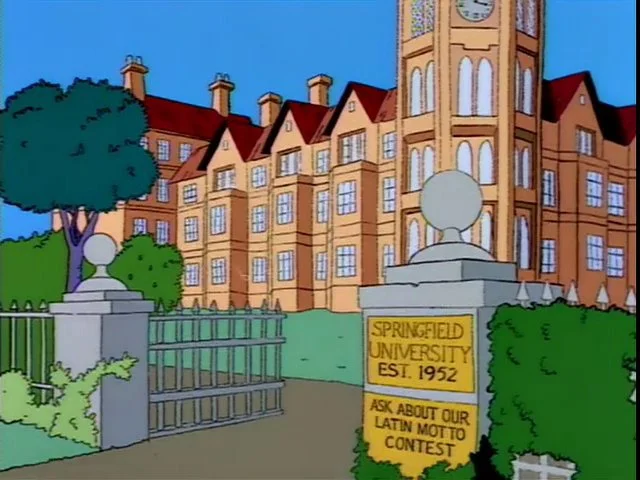
And no doubt Bart Simpson would be going to a traditional public, four-year college. Probably Springfield University, just like his old man (though Homer attended as an adult), located right in their town of Springfield. So what has happened to tuition prices since the early 1990s.
One of the best publications on college prices is the College Board’s annual report “Trends in College Pricing.” The report is broken down by type of college, it shows what factors (tuition, housing, etc.) make up the typical cost of college, and even shows differences across US states. Importantly, they include that “net tuition and fees” number, and they’ve been doing so since their 2003 report. That 2003 report even calculated the net figures back to the 1992-93 school year, perfect for an example of the early Simpsons (“Homer Goes to College” aired in 1993).
In the 1992-93 academic year, the average net tuition and fees, plus room and board for public four-year colleges in the US was $4,620 (from Figure 7, adjusted back to nominal dollars). In the 2020-21 academic year, the same figure was $15,050 (from Figure CP-9). Adjusted for inflation, that’s roughly a doubling (slightly less, but in the ballpark) since the early 1990s, just as Planet Money stated.
But let’s compare the cost of college to Homer’s income. In 1992, the median male with a high school education, working full-time earned $26,699, meaning that the cost of college would be 17.3% of his income that year. In 2020, the median male with a high school education, working full-time earned $49,661, meaning that the cost of college would be 30.3% of his income.
By this measure, college clearly has become much more expensive when compared to a Homer Simpson-type salary, and 30% of your income is a very hard pill to swallow (though the 17% in 1992 wasn’t a picnic either). But here’s one other factor to consider. The College Board data also allows us to look only at net tuition and fees, rather than also including the cost of room and board. Remember, Springfield University is located in Springfield, and Bart has a perfectly fine room at the house on Evergreen Terrace. While living on campus is certainly a big part of the college experience, and no one would probably love that experience more than Bart Simpson, many students today do choose to live with their parents while attending college (or at least live off-campus, where housing is often cheaper).
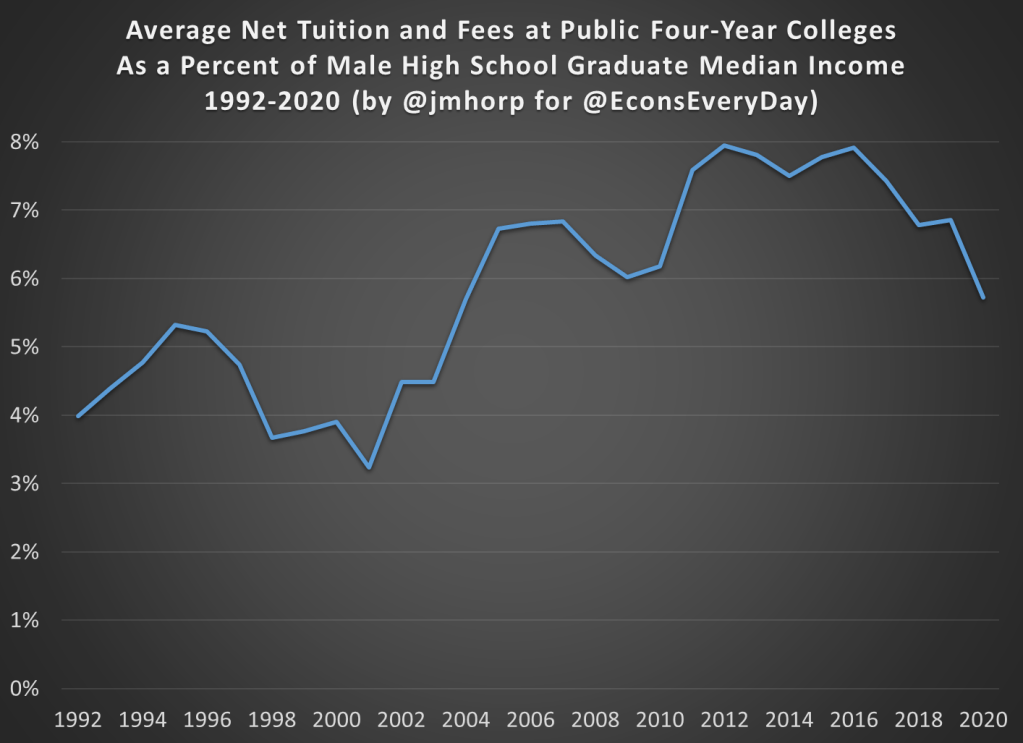
If we just look at net tuition and fees (not room and board), in 1992-93 the average cost at public four-year colleges was about $1,065 (in nominal dollars). That’s about 4% of Homer’s annual income. Much more reasonable! In 2020-21, that same figure was $2,880 (once again, in nominal dollars), or just under 6% of annual income. That’s certainly more than 4%, but not exactly the kind of expense that would break the budget if planned for.
I want to repeat that number again: $2,880. That was the average cost of tuition and fees at an in-state, four-year, public college in the US in 2020-21, after accounting for grants and aid. I suspect this number is much, much lower than most would guess.
The chart below does the same calculation for all the years I could find (1992-2020) using archived versions of the College Board’s report. I’ll admit the data isn’t perfect, as later reports sometimes have different numbers than earlier reports, but it’s probably the best we can do if we want a consistent time series. There does seem to be a break happening in the early 2000s, when college suddenly did get more expensive relative to a high school graduate’s income, though in the past 15 years it’s been pretty flat.
We should keep in mind that if Bart were to take out the maximum federal student loan amount of $9,000 as a dependent student in his first year at Springfield University, he is primarily borrowing money to pay for his housing and food, not his education.
In 1993, the premium for getting a college degree was about 54%, with the median male college grad earning about $41,400 and the equivalent high school grad earning about $26,800 (data from Table P-24). In 2021, that premium had risen to about 64%, with the median male college grad earning $81,300 compared with his high school counterpart earning about $49,700.
I’m ignoring all sorts of important questions here about what is causing the difference in pay. Is it signaling, human capital, something else, or some combination of all these? Yes. But regardless of your preferred explanation for the college wage premium, there’s pretty solid evidence of a sheepskin effect.
Putting It All Together
I’ve now explored taxes, housing, and college education prices using a family like the Simpsons. But what if we put it all together? How are high school graduates doing?
The best way to do this is probably the simple chart you’ve been thinking of all along: median income adjusted for inflation. Some things have gotten cheaper (housing, TVs), some more expensive (college, probably healthcare), but to get a sense of the total effect, we need to adjust for all prices. The chart below is that calculation, using Census data on median earnings for full-time, year-round workers, male high school graduates aged 25 and older. The data starts in 1991. You can get some earlier estimates from different data series, but if we want a consistent series 1991 is the best we can do.
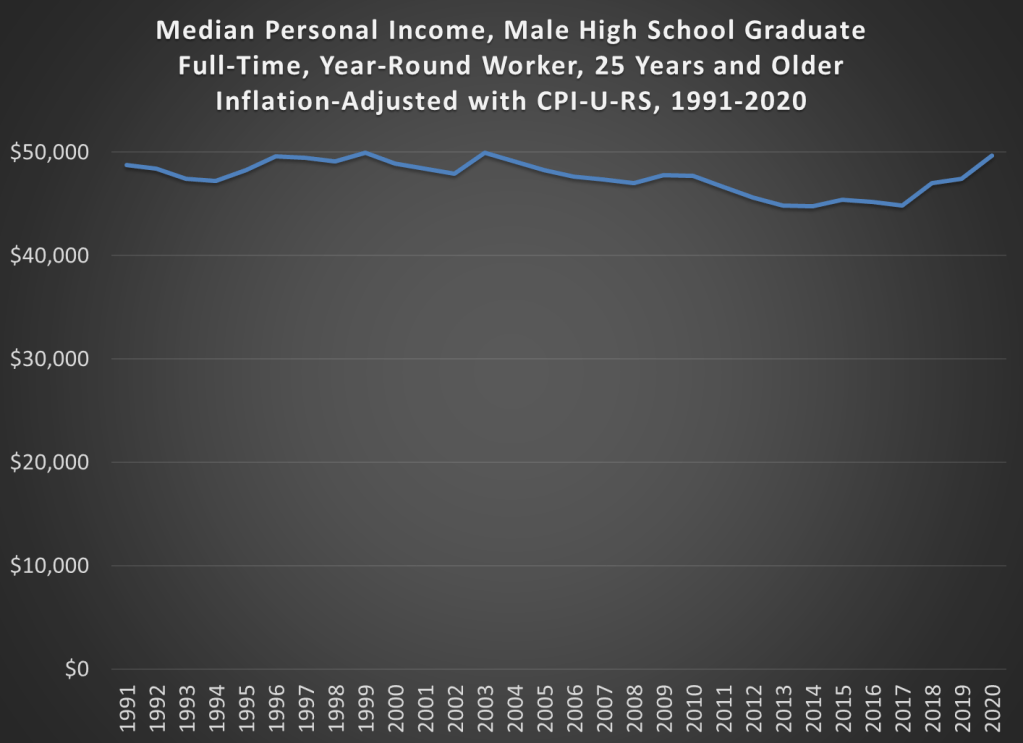
And from the chart we see that real incomes of male high school graduates are… pretty flat. That’s not good, but let’s contextualize. First, claims that it’s harder for these workers to make ends meet aren’t true. It’s roughly no easier, but also no harder. Definitely wage stagnation, but also not “falling behind.”
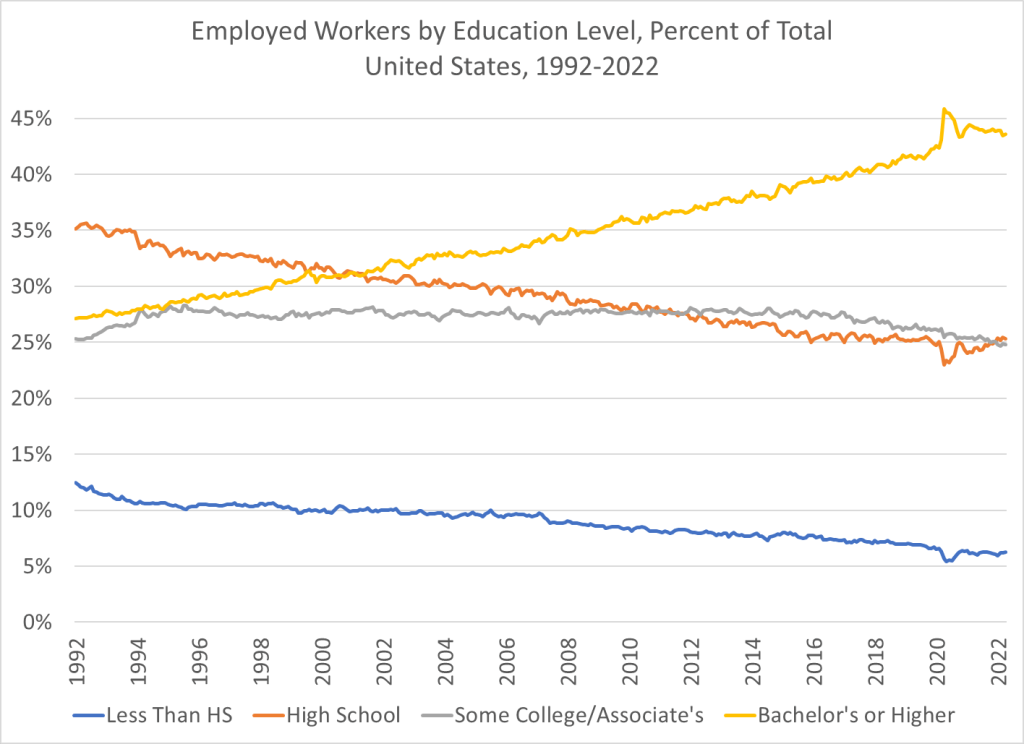
And also, high school graduates are a shrinking part of the workforce in the United States. You probably already knew this. But it wasn’t until after the year 2000 that college grads became the largest category of workers in the US. In the early 1990s, high school graduates (folks like Homer) were by far the largest single category of workers. Now, it’s by far college graduates, and those with some college or a 2-year degree are roughly equal in size to high school graudates. So, while the income stagnation we see for high school grads is not good, it’s affecting a shrinking portion of workers in the US.

Jeremy,
Excellent analysis.
Here’s my two-bits:
I priced college against something besides dollars, like TVs ?
In 1997 a college degree and a large-screen TV were about the same price- $15,000. By 2020 the degree price had increased to $40,000. The TV price had fallen to $148. The ratio went from one to one to one to 267. This is why YouTube will replace college.
Best,
Gale
[cid:d881b80d-8e85-45cf-a242-f56a081824ce]
________________________________
LikeLike
Nice work!
Possible typo: “I want to repeat that number again: $3,230 ” – – should that be $2,880 (from earlier sentence?). Or maybe I missed something.
LikeLike
Thanks, I will fix
LikeLike