If you are teaching a quantitative college course, then you have probably thought about where to get data that students can practice with.
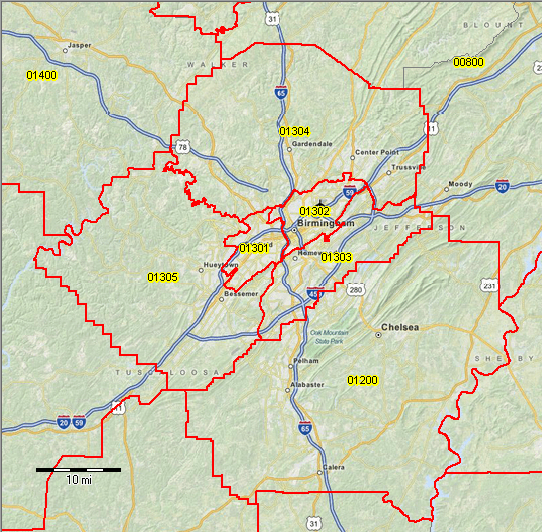
Public Use Microdata Areas (PUMAs) are non-overlapping, statistical geographic areas that partition each state or equivalent entity into geographic areas containing no fewer than 100,000 people each. The image here shows PUMAs around Birmingham, AL. I created a dataset for my students that includes demographic data from the American Community Survey (ACS) for the region around our university.
For just about any topic you would teach in stats, I can create a mini assignment using data on the people around us. Any American metro area has clusters of high-income households and clusters of low-income households. One example of a an exercise is to create summary statistics on income by PUMA. Students will be surprised to learn the facts about their own city.
Zachary has blogged about how great IPUMS is. The way I obtained the data was to make a free account with IPUMS. If you asked for data on every American, you’ll end up with an unwieldy big file. The trick is to filter out all but a handful of PUMAs. I also recommend restricting it to just one year unless you are teaching time series techniques.
I originally got the idea from Matt Holian. Matt wrote fantastic book called Data and the American Dream. The book has data and R codes that allow you to reproduce the findings from several interesting econ papers that all use ACS data. I’m not teaching material that overlaps perfectly with Matt’s book, so I couldn’t assign it to my students, but I did borrow some elements of his idea and even (with his permission) some of his code.
