Most Americans are covered by employer-sponsored health insurance, either through their own job or a family member’s. This can make it difficult to switch jobs- the new job might not offer insurance, or might have a worse insurance plan or network- locking people into their current job.
Economists have documented since at least the 1980’s how our insurance system seems to reduce job mobility. Several reforms have tried to improve the situation- COBRA, HIPAA, and most recently the Affordable Care Act.
In a paper published this week, Gregory Colman, Dhaval Dave and I evaluate how the extent of “job lock” has changed over time. In short, we find that job lock remains substantial and the Affordable Care Act doesn’t appear to have done anything to improve the situation. The paper has many tables of regression results, but the pictures tell the basic story:
Trends in job mobility for those with and without employer-sponsored insurance (ESI) using Current Population Survey data
The details differ a bit depending on which dataset and identification strategy we use, but a few things are clear:
Macroeconomic factors are dominant in the short run; mobility falls during recessions like 2001 and 2007, then recovers.
The long run trend has been toward lower job mobility for those with AND without employer-based insurance
Those without employer-based insurance are still much more likely to switch jobs (we find 25-45% more likely)
To the extent that this gap has closed since the year 2000, it has come through falling job mobility for those without employer-based insurance more than rising job mobility for those with employer-based insurance
Why does the Affordable Care Act appear not to have improved things? This remains unanswered, but we conclude the paper with some hypotheses:
In fact, our point estimates suggest that job lock actually got stronger following the ACA. One possible explanation for our finding is that the ACA’s individual mandate made insurance even more desirable by fining the uninsured. Another possibility is that workers continue to value employer-provided health insurance more over time as premiums continue to rise
I’m on vacation this week. But no, I’m not just saying this to get out of posting this week, or to brag. Americans really have started going back to the normal routine of vacations after a long break during the pandemic.
You might think that the high price of gasoline will slow down summer travel. Not so, according to estimates from AAA. While the total number of estimated travelers for Independence Day weekend is still slightly below Summer 2019 (by about 1 million travelers), travel by car is predicted to be just above 2019 levels (by about 0.5 million travelers), with 42 million Americans traveling by car. Air travel has been a mess lately and quite expensive (even compared to pre-pandemic levels), and is predicated to be about 0.5 million below 2019. Bus/train/cruise travel is still the big loser, well above the past two summers, but still 1 million travelers below 2019. (These are all estimates, of course, but AAA is in the business of knowing this data well.)
What gives? Basic economic theory would tell us that if the price of something increases, people should buy less of it. And traveling by car is much more expensive than in Summer 2019. We should also think about substitutes, and airline travel is certainly a substitute for car travel. But if we look at what has happened to both airfares and gasoline prices since July 2019, we can see that gasoline prices have increased much more (about 60% vs. 25% for airfares).
So, do we just throw up our hands and say: “it’s just too complicated, lots of factors at play”?
I just ran across a short article [1] summarizing a talk with some techniques on learning more efficiently, which seemed worth sharing here. It may be something for professors to pass along to their students.
The speaker was Andrew Watson, who is an expert on learning and the brain, and currently a teacher at the Loomis Chaffee School in Connecticut. He noted three key ways that students (and adults) can work with the ways the brain learns information. The last two points are good but well known, while the first point was not something I have seen emphasized much:
( 1 ) Retrieve information while studying:
To study better, students should focus on the idea of retrieval rather than review. Trying to recall information before looking back at it produces more remembering than simply reading it through again. He suggested creating flash cards and using visual hints and clues as effect retrieval techniques.
( 2 ) Change the environment to avoid distractions:
The environment in which someone studies also affects how well they retain information because the human brain works best when it focuses on one activity at a time.
(My comment: That is absolutely true for me, I can’t stand any distraction when I am studying or writing, but I know people who claim they study more effectively with a TV show or music going in the background…I wonder what academic studies show about that.)
( 3 ) Bolster your health:
The brain, like the rest of the body, benefits from a healthy lifestyle, including eating well and exercising regularly. Ample sleep helps the brain to process and solidify information absorbed during the day. If homework is everything that helps a person learn and if sleep help you learn, then sleep is a part of homework.
[1] “Brain Hacks for Brainiacs” in the Loomis Chaffee Magazine, Spring 2022, page 13.
So, to summarize, there is a medical service for which there is significant demand. That demand, at the micro level of an individual consumer, comes with time pressure in a heightened emotional context. The supply of the service will vary geographically. Given the clustering of states that are prohibiting abortion in the south and midwest, there will be considerable heterogeneity in legal abortion access based almost entirely on physical distance and access to transportation.
Prohibition of a good with strong demand, heterogeneous legal supply, and heavy punishments for those seeking to enable arbitrage across state lines. This is not a new story. First alcohol, then narcotics, now abortion. This might feel different because abortion is a service good, but it’s not. Why?
As it stands, a state cannot ban a drug with FDA approval, but access is nonetheless thin. There will also be, with similarly little doubt, efforts to quickly ban mifepristone and misoprostol, with accompanying heavy punishments. Eleven weeks is a long enough window that it will cover the majority of abortions. It’s small and portable, which means it will be easily transported and resold. It will also remain perfectly legal in a number of states bordering those prohibiting abortion. There will be, with nearly zero doubt, a booming black market in mifepristone and misoprostol within a matter of months.
But this isn’t a medical procedure provided in a fixed building with identifiable practitioners. These will be pills that will be exchanged in school bathrooms and college dorms, purchased by professional women who drove 300 miles in a Lexus and came back with enough to give to their professional friends who want to be proactive and prepared for daughters who may be sexually active. Further, these aren’t addictive products: there won’t be weekly customers whose symptoms will create patterns of consumption and the kinds of collateral damage that attract attention. Passive enforcement of these laws will be highly ineffective.
In some places, enforcement on pill restrictions will simply be weak, meaning anyone whose pregnancy can be terminated in the short run will retain some meaningful access. The price will be elevated like any good where suppliers incur legal risk, which means access to abortion will correlate heavily with income, resources, and social privilege. This will also shift the effective burden of abortion restrictions towards the later term “abortions” that only account for 1.3% of terminated pregnancies, but are more heavily associated with medical emergencies, incomplete miscarriages, and the kinds of pregnancy events associated with trauma and shame (e.g. rape or incest) where a women is not necessarily in a position to take decisive early action. Given that the majority of Americans averse to abortion are principally concerned with late term abortions, but also believe abortion should always be an option when the health of the mother is in jeopardy, it is expecially vexxing that laws that reduce access to early term abortions will increase the previously miniscule demand for late term abortions.
I expect some states will attempt to enforce prohibitions or limitations on mifepristone and misoprostol with a war-on-drugs like zeal. How do you heavily enforce a ban on a small pill that is easily hidden, not regularly used, legally manufactured in other states, and has a viable market with high income individuals? Experience tells us the answer is to dedicate lots of resources while carrying little regard for individual rights or public safety.
Marijuana legalization has spread rapidly across the country. District attorneys are increasingly uninterested in prosecuting minor possession charges of nearly any drug. In 1993 state and local governments spent $15.9 billion on the criminal justice of drug enforcement, $26 billion by 2003. Now it’s probably closer to $40 billion (I couldn’t easily find a good current estimate). That’s a lot of money. That’s a lot of jobs. That’s a lot of government jobs, with government job security, many of whom might be wondering what their job is actually going to be in five years. They needn’t worry. When one prohibition closes a door, a new one opens a window.
Local governments have been seizing property, charging fines and fees, and generally subsidizing their local tax bases on the back of the drug war for decades now. Cracking down on a new banned substance might not work for a variety of reasons already listed, but that doesn’t mean they won’t try, particularly if trying means getting a lot of political attention while hosting photo ops with seized contraband next to local police and publicly shaming perpetrators as unforgivable monsters.
Prohibition of alcohol failed in large part because it made nearly everyone a criminal. Alcohol appealed across every strata of American life. Most Americans had a hidden liquor cabinet, a favored speakeasy, or even a backyard still. That breadth and depth of demand brought tremendous profits to those who could supply it outside of the law and, eventually, tremendous violence from those eager to capture those profits.
Demand for abortion access, whether for discretionary reasons or medical necessity, appears randomly in lives, but those rolls of the dice are inclusive of nearly every woman and every family. With that breadth and depth of demand will come a black market. Possibly even a highly profitable market. Materially profitable for suppliers. Politically profitable for those legislating to suppress it. Budgetarily profitable for those working every day to destroy it. These prohibition rents will appear, they will be fought for, and they will sustain themselves through a process that will destroy lives. Mostly women.
The third act of American Prohibition is here and it will hurt us all. Mostly women.
If you are teaching a quantitative college course, then you have probably thought about where to get data that students can practice with.
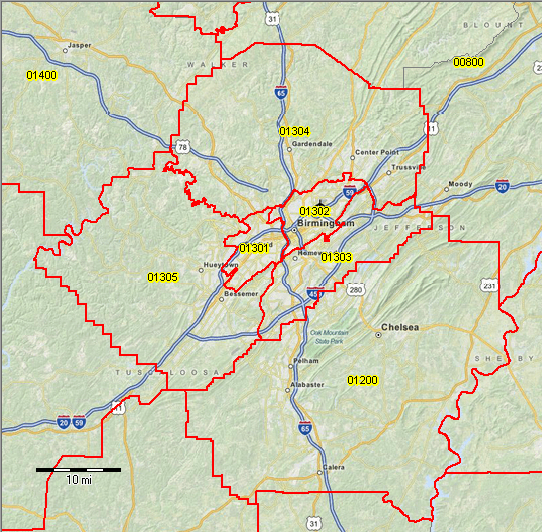
Public Use Microdata Areas (PUMAs) are non-overlapping, statistical geographic areas that partition each state or equivalent entity into geographic areas containing no fewer than 100,000 people each. The image here shows PUMAs around Birmingham, AL. I created a dataset for my students that includes demographic data from the American Community Survey (ACS) for the region around our university.
For just about any topic you would teach in stats, I can create a mini assignment using data on the people around us. Any American metro area has clusters of high-income households and clusters of low-income households. One example of a an exercise is to create summary statistics on income by PUMA. Students will be surprised to learn the facts about their own city.
Zachary has blogged about how great IPUMS is. The way I obtained the data was to make a free account with IPUMS. If you asked for data on every American, you’ll end up with an unwieldy big file. The trick is to filter out all but a handful of PUMAs. I also recommend restricting it to just one year unless you are teaching time series techniques.
I originally got the idea from Matt Holian. Matt wrote fantastic book called Data and the American Dream. The book has data and R codes that allow you to reproduce the findings from several interesting econ papers that all use ACS data. I’m not teaching material that overlaps perfectly with Matt’s book, so I couldn’t assign it to my students, but I did borrow some elements of his idea and even (with his permission) some of his code.
Last year, our economics department launched a data analytics minor program. The first class is a simple 2 credit course called Foundations of Data Analytics. Originally, the idea was that liberal arts majors would take it and that this class would be a soft, non-technical intro of terminology and history.
However, it turned out that liberal arts majors didn’t take the class and that the most popular feedback was that the class lacked technical challenge. I’m prepping to teach the class and it will have two components. A Python training component where students simply learn Python. We won’t do super complicated things, but they will use Python extensively in future classes. The 2nd component is still in the vein of the old version of the course.
I’ll have the students read and discuss “Big DataDemystified” by David Stephenson. He spends 12 brief chapters introducing the reader to the importance of modern big data management, analytics, and how it fits into an organization’s key performance indicators. It reads like it’s for business majors, but any type of medium-to-large organization would find it useful.
Davidson starts with some flashy stories that illustrate the potential of data-driven business strategies. For example, Target corporation used predictive analytics to advertise baby and pregnancy products to mothers who didn’t even know that they were pregnant yet. He wets the appetite of the reader by noting that the supercomputers that could play Chess or Go relied on fundamentally different technologies.
The first several chapters of the book excite the reader with thoughts of unexploited potentialities. This is what I want to impress upon the students. I want them to know the difference between artificial intelligence (AI) and machine learning (ML). I want them to recognize which tool is better for the challenges that they might face and to see clear applications (and limitations).
AI uses brute force, iterating through possible next steps. There are multiple online tic-tac-toe AI that keep track records. If a student can play the optimal set of strategies 8 games in a row, then they can get the general idea behind testing a large variety of statistical models and explanatory variables, then choosing the best.
But ML is responsive to new data, according to what worked best on previous training data. There are multiple YouTubers out there who have used ML to beat Super Mario Brothers. Programmers identify an objective function and the ML program is off to the races. It tries a few things on a level, and then uses the training rounds to perform quite well on new levels that it has never encountered before.
There are a couple of chapters in the middle of the book that didn’t appeal to me. They discuss the question of how big data should inform a firm’s strategy and how data projects should be implemented. These chapters read like they are written for MBAs or for management. They were boring for me. But that’s ok, given that Stephenson is trying to appeal to a broad audience.
The final chapters are great. They describe the limitations of big data endeavors. Big data is not a panacea and projects can fail for a variety of what are very human reasons.
Stephenson emphasizes the importance of transaction costs (though he doesn’t say it that way). Medium sized companies should outsource to experts who can achieve (or fail) quickly such that big capital investments or labor costs can be avoided. Or, if internals will be hired instead, he discusses the trade-offs between using open source software, getting locked in, and reinventing the wheel. These are a great few chapters that remind the reader that data scientists and analysts are not magicians. They are people who specialize and can waste their time just as well as anyone else.
Overall, I strongly recommend this book. I kinda sorta knew what machine learning and artificial intelligence were prior to reading, but this book provides a very accessible introduction to big data environments, their possible uses, and organizational features that matter for success. Mid and upper level managers should read this book so that they can interact with these ideas prudentially. Those with a passing interest in programming should read it for greater clarity and to get a better handle on the various sub-fields. Hopefully, my students will read it and feel inspired to be on one side or the other of the manager- data analyst divide with greater confidence, understanding, and a little less hubris.
I was in Austin Texas for the first time this week for the first in-person meeting of the American Society of Health Economists since 2019. Some quick impressions on Austin:
Austin reminds me of many Southern cities, but Nashville most of all. Both historic state capitals that are booming, lots of people moving in and new infrastructure actually being built, forests of cranes putting up new glass towers. Both filled with bars, restaurants, and especially live music. But even with so much happening and so much being built, they don’t *feel* dense, you can always see lots of sky even downtown.
Austin seems to be a bizarre “pharmacy desert”, I think I walked 14 miles all through town before I saw one. Contrast to NYC with a Duane Reade on every block. In fact downtown seemed to have almost no chains of any kind, restaurants included; I wonder if this is just about consumer preferences or there’s some sort of anti-chain law.
Good brisket and tacos, as expected
Most US cities have redeveloped their waterfronts the last few decades to make them pleasant places to be, but Austin has done particularly well here, many miles of riverfront trails right downtown.
Today two data releases for Gross Domestic Product were released. The first release was for the United States, giving us the third and “final” release for first quarter 2022 data. It was down 1.6% from the prior quarter (though we knew this two months ago — not much has changed since the “advance” estimate). That’s not good (but see this great Joseph Politano newsletter for some more detail).
The second release was the annual 2021 GDP data for the European Union. The release showed strong growth in 2021 (+5.4%), but that’s relative to the bad year of 2020. So compared to the pre-pandemic level of 2019, the EU was still about 0.8% below this more accurate baseline. Comparatively, the US was already 2% above 2019 with the annual 2021 release (everything in these two paragraphs is adjusted for inflation). Of course, within the EU, there is a lot of variation, but overall the US looks comparatively well.
Let’s break down that variation in the EU and include the first quarter of 2022 data to make the best comparison with the US. To bring in some more relevant comparison countries, I’ll use data from the OECD for a complete comparison. Note: I’ve excluded Ireland, because their GDP is weird. I’ve also excluded Turkey, because even though all the data here is adjusted for inflation, Turkey is in a highly inflationary environment, making the data a little difficult to interpret.
Here is the chart, which shows the change in real GDP from the 4th quarter of 2019 up through the 1st quarter of 2022 (I use the volume index, which is similar to adjusting for price inflation). I have highlighted in orange the largest economies in the OECD (anything with about $2 trillion of GDP or larger, with Spain and Canada at about that level).
More than 47 million workers quit their jobs in 2021, in what has become known as The Great Resignation. However, many of these workers are getting re-hired elsewhere. Hiring rates have outpaced quit rates since November, 2020.
The U.S. Chamber of Commerce has published some statistics on this reshuffling of the labor force, which I will reproduce here. As shown in the chart below, quit rates in leisure and hospitality (which require in-person attendance and pay lower salaries) were enormous. However, the recent hiring rates have been even higher in this area, so the shortage of labor there is only moderate.
When taking a look at the labor shortage across different industries, the transportation, health care and social assistance, and the accommodation and food sectors have had the highest numbers of job openings.
But yet, despite the high number of job openings, transportation and the health care and social assistance sectors have maintained relatively low quit rates. The food sector, on the other hand, struggles to retain workers and has experienced consistently high quit rates.
I am not sure I understand exactly what the following chart represents, but it was deemed important:
I think the % of yellow is the ratio of unemployed persons with experience in the field (i.e., who could readily participate) to the total job openings in that field. E.g., “…if every unemployed person with experience in the durable goods manufacturing industry were employed, the industry would only fill 65% of the vacant jobs.” These are interesting data, although I’d be even more interested in seeing numbers on unfilled job openings as fraction of total (filled and unfilled) job openings to give a better idea on how much each industry is hurting for labor. Anyway, here is some of the commentary from the article:
It is interesting to look at labor force participation across different industries. Some have a shortage of labor, while others have a surplus of workers. For example, durable goods manufacturing, wholesale and retail trade, and education and health services have a labor shortage—these industries have more unfilled job openings than unemployed workers with experience in their respective industry. Even if every unemployed person with experience in the durable goods manufacturing industry were employed, the industry would only fill 65% of the vacant jobs.
Conversely, in the transportation, construction, and mining industries, there is a labor surplus. There are more unemployed workers with experience in their respective industry than there are open jobs.
The manufacturing industry faced a major setback after losing roughly 1.4 million jobs at the onset of the pandemic. Since then, the industry has struggled to hire entry level and skilled workers alike.
And finally:
Some industries have been less impacted by labor shortages but are grappling with how to deal with the rise of remote work. For example, the rise of remote work might explain why there has been less “reshuffling” in business and professional services.
Two weeks ago Tyler Cowen observed the increasing presence of family lineages in the NBA. The post is without much commentary, so I won’t impute any theory on Tyler’s behalf, but I suspect most people would observe this as the a product of genetics combined with the increased ability of NBA teams to precisely identify the attributes and aptitudes they want. There could also be a component of nepotism i.e. 2nd generation players are given greater leeway and time to develop, but given the revenues on the line in professional sports and the dependence on labor to compete, those effects are likely to be weak.
I’d like to offer an alternative theory to genetics that I refer to as “Better last than second”. There are certain lines of work, such as athletics, acting, music, or twitch streaming that are best thought of as winners-take-all labor tournaments. Any occupation where the concept of “making it” is well understood by its participants as an elusive but desirable goal can be considered a labor tournament.
There are lots of labor tournaments (academia for instance), but in most of them 2nd, 3rd, or Nth place are reasonably tolerable outcomes because the rewards correlate fairly linearly with any success level beyond abject failure. Nobody worries about being the 27,342nd ranked accountant in the world – that person likely makes a good living. Even if they can’t get a job as an accountant, they have skills that readily translate to a variety of other well-paid occupations. Winning is merely a (highly remunerative) cherry on top of an already pretty good oucome.
Basketball players worry a great deal about being the 474th best in the world.
The NBA at any given moment has 450 employees on their rosters. A couple dozen more float in and out on short term contracts to fill in for injuries and other player absences. The league minimum salary is $925k per season. The NBA developmental league (the G League) pays about 37k per season. That already makes it sound like the earnings dropoff from being the 449th best player to the 474th player is enormous, but it’s actually much, much worse.
It’s worse because basketball skills translate to the tiniest sliver of other jobs. Television acting, DJing house music, colorfully live streaming a Castlevania speed run: these are all skills that can pay large sums of money if you cross some imaginary threshold and“make it.” The catch that distinguishes “better last than second” markets from other winner-take-all labor tournaments is that participation requires the dedication of tens of thousands of hours building human capital whose rewards are skewed almost entirely towards a selected few. Those thousands of hours play out over the course of a survival game where, month by month, year by year a new round of “losers” is selected out.
The irony being that losing first is better than than getting the silver medal. Losing first means rebooting your life early and building up your human capital in something else (hopefully in something more forgiving of merely being very, very good). The silver medalist is, in fact, the biggest loser. The opportunity cost of time and energy they will never get back and never be rewarded for. I don’t worry about players that don’t get NCAA scholarships or drafted for the NBA. I worry about the guys hanging around in the G league until they’re 34 only to get released from their contract over a text message. I worry about the actors who’ve spoken 15 lines across 24 television guest spots and 3 commercials in 11 years based mostly on aesthetics, only to wake up at 34 and find themselves in the uncastable valley of normalcy. I worry about the members of all the bands I like but none of my friends have ever heard of.
Which brings us back to NBA lineages and why they seem to be becoming more common. If your father was in the NBA in the 80s or 90s, you probably come from upper-middle class or better means and, in turn, have the backing to tolerate the financial risk of not making it. Second, almost making it is likely to be less costly for you because you are part of a basketball family. Your name will grant you far greater access to the small number of basketball-adjacent jobs that will value your skills (i.e. coaching, scouting, recruiting, commentary, etc). Being part of a lineage makes that silver medal a lot more valuable. Maybe just as importantly, your family is likely to be a lot more supportive and tolerant of the risk you are taking. If your one of your parents had a six year run on Dynasty or made a living on the LPGA tour, they’re that much more likely to see a path to success for you.
As athletics become more lucrative, they become better understood. As they become better understood, the body of highly specific tacit knowledge grows as well. Lineage players will have access to this tacit knowledge through their parents. Dell Curry knew his son wasn’t going to particularly tall (Steph Curry is listed as 6′2", and official NBA heights are notoriously generous). This lead him to entirely reinvent his son’s shooting form in a manner that rendered him unable to shoot from any distance at all for months, entirely based on his understanding as a former NBA player that his son’s lack of genetic predisposition to play in the NBA required a motion that would catapult shots over much taller players. Even if lineage players do have genetic advantages in the high school and college stages of the tournament, the value of these advantages pale in comparison to the advantages of tacit knowledge precisely because of the stage of the game at which they are leveraged.
One could even argue that any genetic advantages that correlate to success at the early stages of a “better last than second” tournament (i.e. being 6’8″) are akin to a resource curse, giving the false impression of a non-trivial probability of “making it.” Conversely, a lack of genetic gifts (i.e. being 6’2″) while having access to the tacit knowledge valued at the last stage of the tournament truly are a blessing. If you survive the tournament until the last round without the obvious endowments other players have, you probably have a rich portfolio of other skills which, combined with the previously mentioned late-stage tacit knowledge, means you’ve been playing the game with less risk and greater expected value than others.
“Better last than second” labor tournaments are common in high prestige entertainment fields, but they aren’t limited to them. Any academic field that produces PhDs with little to no demand in the private market shuttle thousands of students through exactly such a tournament. The only difference is that the gold medal is a $87k a year job with the job security of tenure and “almost making it” often includes crippling student loans. It shouldn’t be much of a surpise that academia is full of lineages, too. And with those academic parents will come the knowledge of how decisions made in high school, college, grad school, and beyond will determine they win their respective labor tournaments. Or lose and have to settle for saving the world.