A recent article at Business Insider on food delivery spending has several quotes from me. It’s a good article, but you all know that I love charts to go along with text, so here are a few accompanying charts.
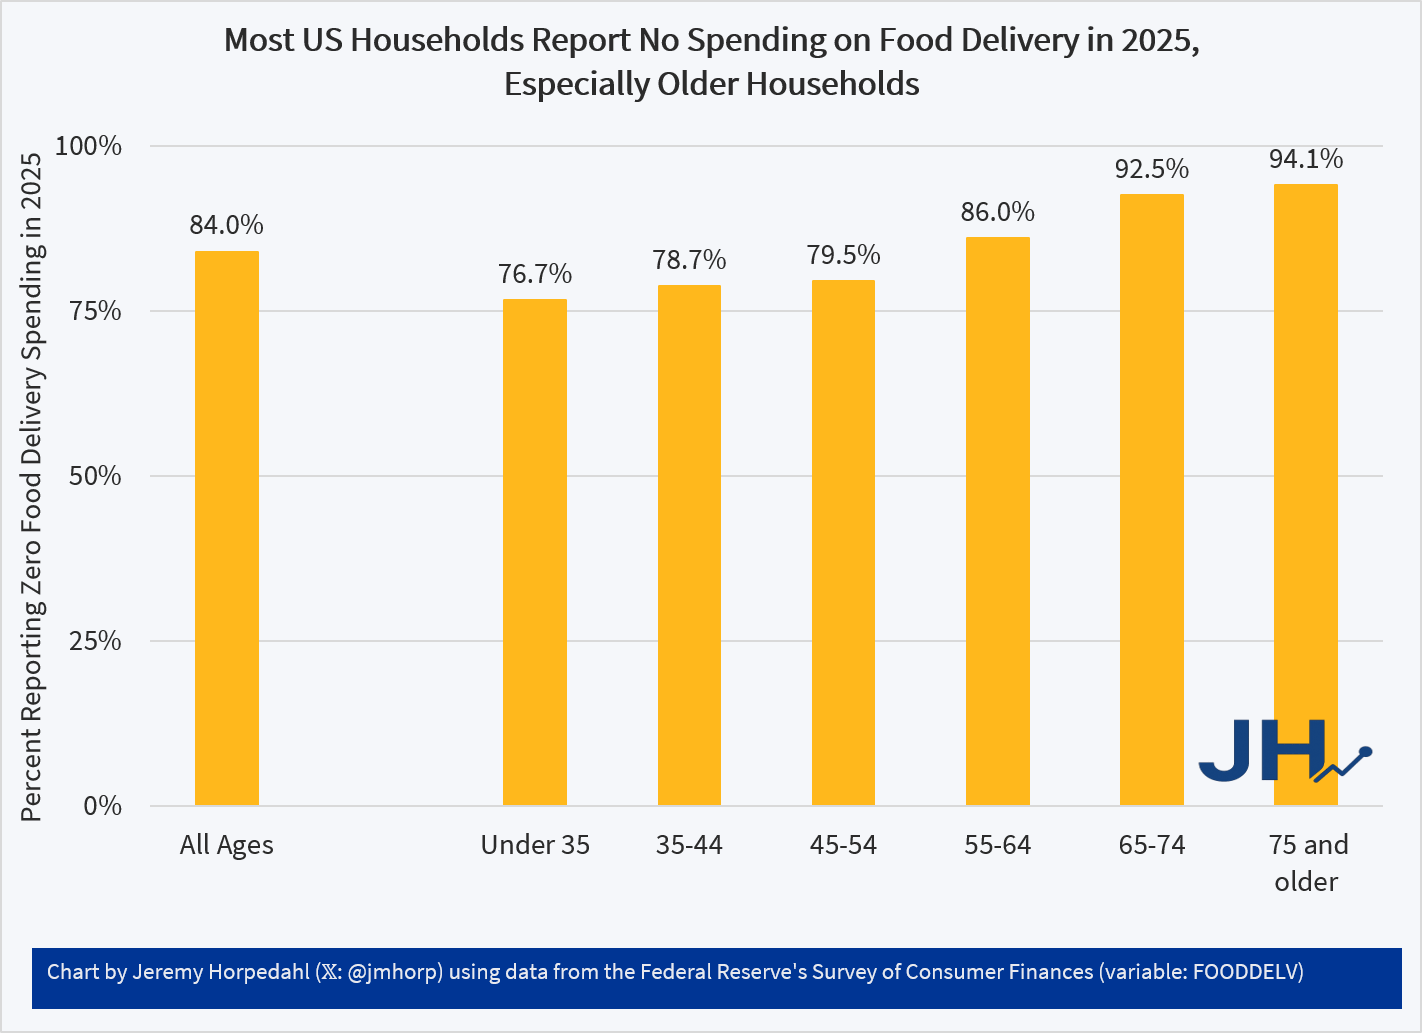
The BI reporter contacted me because of a few tweets I wrote about spending on food delivery, the first was that the median household in all age groups spends $0 on food delivery services. In fact, you have to go well above the median household to find any reported spending on food services, since 84 percent report no food delivery spending in the Fed’s Survey of Consumer Finances.
Figure 1
The data comes from the Fed’s Survey of Consumer Finances, which is primarily designed to measure wealth data for households, but also gives us some interesting data on a few other areas of consumer finances, including some spending variables. Because the survey doesn’t give us a full accounting of consumer spending, we should take it as suggestive rather than definitive, but more comprehensive consumer spending surveys such as the one from BLS don’t separate out food delivery spending (even in the publicly available microdata).
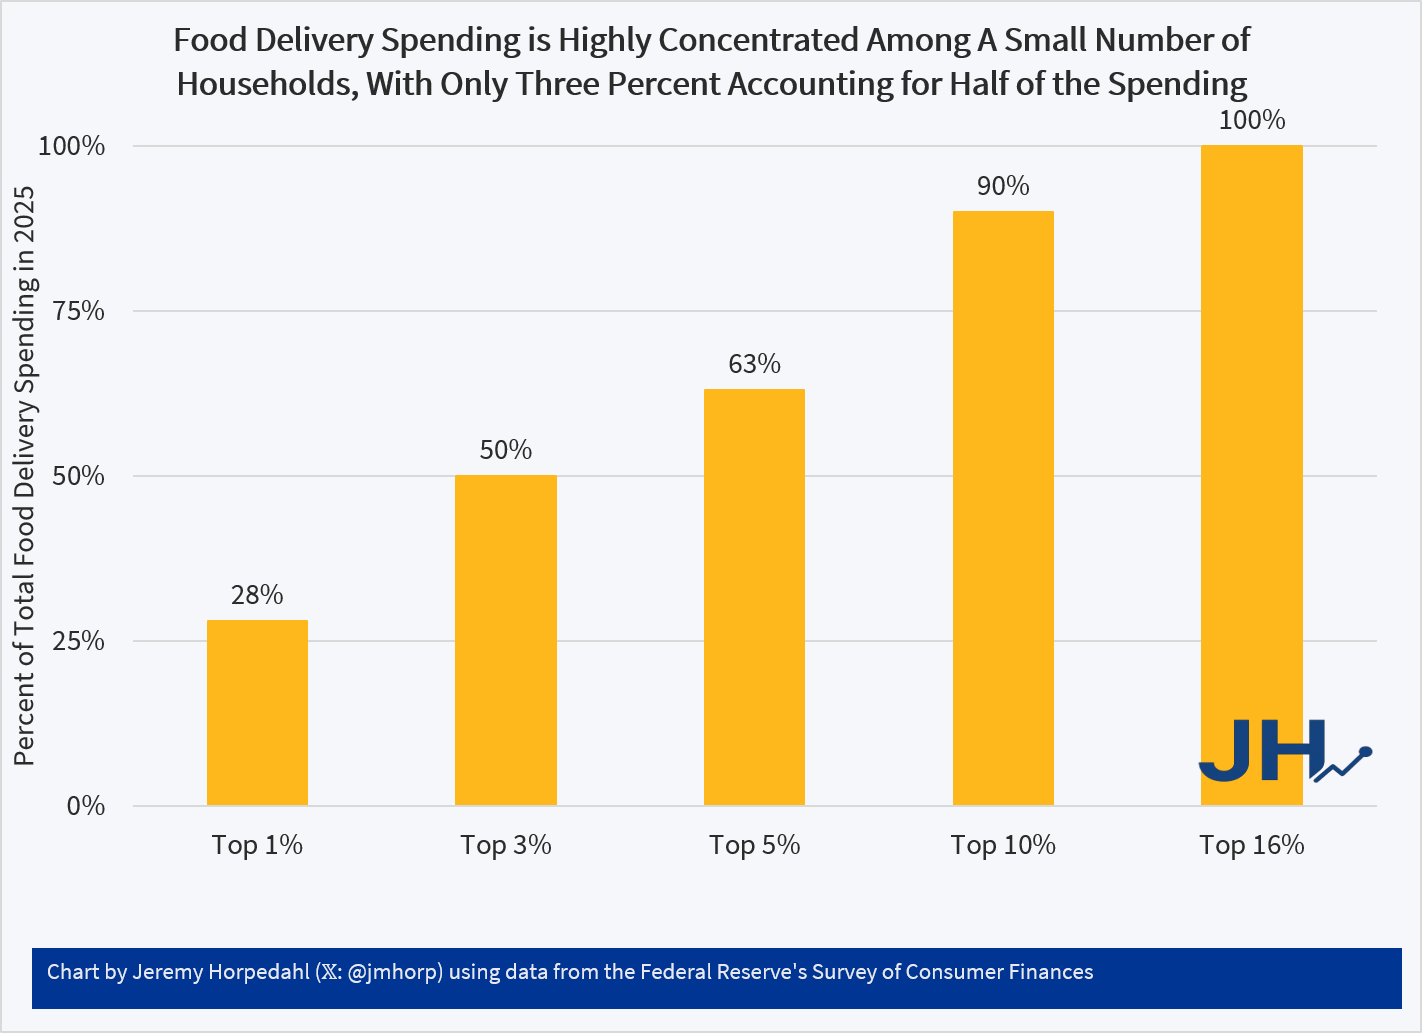
But even that 84 percent figure understates just how concentrated food delivery spending is among a small share of households: just 3 percent of households account for about half of all food delivery spending, and the top 1% of spenders (not necessarily the richest 1%, just the top 1% in this category) account for around 28 percent of food delivery spending. Median food delivery spending for the top 1% of spenders is $7,800 per year, or $150 every week. That’s a lot of pizzas. The median spending for those with any food spending (the top 16%) was $1,800 in 2025.
Figure 2