The author of The Psychology of Money, Morgan Housel, has a new book “The Art of Spending Money” out this month. Its main point is that people tend to be happier spending money on things they value for their own sake- rather than things they buy to impress others, or piling up money as a yardstick to measure themselves against others (this is repeated with many variations).
Overall it is well-written at the level of sentences and paragraphs with well-chosen stories and quotes, but I’m not sure what it all adds up to. The main points seem obvious to me, though maybe that’s my fault for reading a book titled this when I’m already fairly happy with how I spend money. I think I err a bit on the frugal side, but I just don’t see many opportunities to turn money into happiness by spending it- I was maybe hoping for ideas on that front but I got none from the book. After reading it I don’t plan to do anything differently and don’t find myself thinking about spending differently.
Still, some highlights. The book is full of well-chosen quotes from others:
LinkedIn has its problems, but so does every other social network.
I joined LinkedIn out of college because it seemed like something you were supposed to do if you want a job someday, but I never checked it because the academic job market makes little use of LinkedIn. In 2013 LinkedIn added social media features like a newsfeed, but I still never spent time there. Facebook and Twitter seemed more interesting, and like many people I’ve always been allergic to “networking” or other social settings where one person is just trying to get something from another. It seemed like a recipe for posts that are cringe, soulless, or desperate.
But over the past couple years, I’ve found myself spending more time there- and not because I’m looking for a job or looking to hire. Some of the posts are genuinely interesting, and it is a nice way to keep up with what people I know are up to. Either LinkedIn got better or I got worse.
I find that LinkedIn is particularly good for staying in touch with my old students. I always told my students they could still e-mail me or stop by my office after the semester is over, but they almost never do; that takes a lot of thought and energy. Social networks are the ideal way to keep in touch with “weak ties“, but you have to find the right one. Facebook was the best for this when it was ubiquitous, but now it is becoming more common for Americans not to have or not to check Facebook, especially young ones (plus it was always a bit too personal for former students). Twitter has never been something that most people have, and the more popular networks are either too personal (Instragram, Snap et c) or too impersonal where almost all content users see comes from people they don’t know (TikTok, Youtube, et c).
LinkedIn by contrast is ubiquitous and just the right amount of personal. It also seems to be increasingly a good place to share interesting writing. I like much of what I read there, and my writing gets a good reception; I tend to get more engagement for EWED posts on LinkedIn than on X and Facebook despite having fewer connections there than Facebook friends or Twitter followers. Yes, you’ll still see some cringe posts there, but it beats the angry political posts that are ubiquitous on Facebook and especially X.
There are 62 songs called “Better Man” just on Ultimate Guitar (which doesn’t claim to be comprehensive), plus many more slight variations like “A Better Man” or “Better Man Blues”. Some of these are obscure, but many are from well-known artists including Taylor Swift, Oasis, Ellie Goulding, Justin Bieber, and Pearl Jam; one by Robbie Williams inspired a major motion picture also called Better Man.
Meanwhile there is only one song on Ultimate Guitar called “Better Woman”, plus one variation (“A Better Woman”), both from artists I hadn’t heard of (Sera Cahoone and Beccy Cole). Why such an extreme difference?
Is it that men are the ones who are terrible and need improvement? Or are men the ones who see hope for improvement, while women can’t change or don’t want to? Let’s consider what the lyrics have to say about this. Reading though them all I saw a few recurring categories of “Better Man”:
Wish I Were Better: I count 33 of the 62 songs in this category. A man singing about how he wishes he were better, usually because of a woman, the classic “You Make Me Want to Be a Better Man“. Sometimes this is hopeful that he will be, sometimes regretful that he hasn’t been or despairing that he won’t be. Occasionally the inspiration to be better comes from someone other than a woman he’s in love with, such as Jesus, his dad, or his kids.
You Make Me Better: 13/62. Same idea as the last category, except the man has already become better. Again usually because of a woman, but sometimes because of someone else like God or his kids or his friends. Another 3 are a variation of this, I Got Better, where the man changed without anyone’s help or for a woman who isn’t convinced he really changed.
Wish You Were a Better Man: 4/62, but includes the hit by Taylor Swift. A woman wishes a man she loved were better. Another 2 songs including the Pearl Jam hit are a variant of this, Can’t Find A Better Man, where a woman stays with a bad man because she doesn’t see a better choice. Steven Seagal (yes, that Steven Seagal) reverses things and sings that a woman should leave him because she can do better. Then there’s 1 example of the genre where Hellyeah wishes his father were a better man.
One-offs: There are a few 1-off “Better Man” songs that seem to be in a category of their own: Beth Hart’s celebration of finding a better man, Ellie Goulding‘s odd insistence that “I’m the better man” (even though she’s a woman), and Ryan Innes’ entry which is the closest anyone comes to saying they wish they were a worse man. By the way, there appear to be zero songs out there called “Worse Man”- perhaps some day I’ll write one, but its a free idea and I’d be happy to see one of you beat me to it.
What about our 2 “Better Women”?Sera Cahoone’s song (the only one with the exact title “Better Woman”) is a standard “Wish I Were Better” entry, just as a woman (though the person she wants to be better for might still be a woman as usual):
So I step on up and be a better woman in your eyes From now on I’m gonna love everything about you
Beccy Cole’s “A Better Woman” concludes that she doesn’t actually want or need to become a better woman:
I ain’t changin’ nothin’ Just to have your lovin’ Yeah, I’m alright with who I am I don’t need to be a better woman – I just need a better man
The boring explanation for the gender discrepancy is that “Better Man” just scans better rhythmically. But I don’t think can explain a 60-2 (or 60-1 if we’re being strict) difference, and there seems the be a big underlying difference in the prevalence of these themes for men and women, not just titles. This matches up with the classic sayings from Camille Paglia:
A woman simply is, but a man must become
Or this one often attributed (probably incorrectly) to Einstein:
Women marry hoping that the man will change. Men marry hoping the woman will stay the same. Both are usually disappointed.
Whatever the cause, you can find the playlist I made of all 60 “Better Man” songs I could find on Youtube Music here:
I liked most of them (surprisingly given the range of genres and the fact that I hadn’t heard of most of the artists), but my favorite in this vein is to forget being a Better Man or Better Woman, and instead be “A Better Son/Daughter” like Rilo Kiley says:
Datasets can be pulled offline for all sorts of reasons. As I wrote in February, this shows the value of being a data hoarder– just downloading now any data you think you might want later:
Several major datasets produced by the federal government went offline this week…. This serves as a reminder of the value of redundancy- keeping datasets on multiple sites as well as in local storage. Because you never really know when one site will go down- whether due to ideological changes, mistakes, natural disasters, or key personnel moving on.
The US Federal government shutdown this month provides another reminder of this. So far most datasets are still up, but I’ve seen some availability issues:
The good news is that a number of institutions have stepped up in 2025 to host at-risk datasets (joining those like IPUMS, NBER, and Archive.org that have been hosting datasets for many years, but are scaling up to meet the moment):
Restore CDC hosts all CDC data as it was in January 2025.
Harvard Library’s project is less user-friendly but more powerful, archiving all 16 terabytes of Data.gov.
For the last few years the blog Astral Codex Ten has run contests for the best reader-submitted book reviews. This year Scott mixed things up and asked people to review anything except books.
You can review a movie, song, or video game. You can review a product, restaurant, or tourist attraction. But don’t let the usual categories limit you. Review comic books or blog posts. Review political parties – no, whole societies! Review animals or trees! Review an oddly-shaped pebble, or a passing cloud! Review abstract concepts! Mathematical proofs! Review love, death, or God Himself!
“This is not like Iraq” the Ukrainian recruiting officer soberly told me with a thick accent. “You have 50% chance of dying.” That wasn’t actually true, but it was a lot closer to being true than almost anything you can voluntarily sign up for in an organized way. I decided it was worth it.
Recommended, I thought several of the essays were excellent, voting goes through October 13th.
Given where we are starting from, the average American would probably be satisfied with a fairly low bar, like “not obese” or “can run a mile without stopping”. But the kind of person who writes about the topic a lot tends to be a fitness nut insisting on crazily high standards. So what makes for a reasonable middle-ground measure?
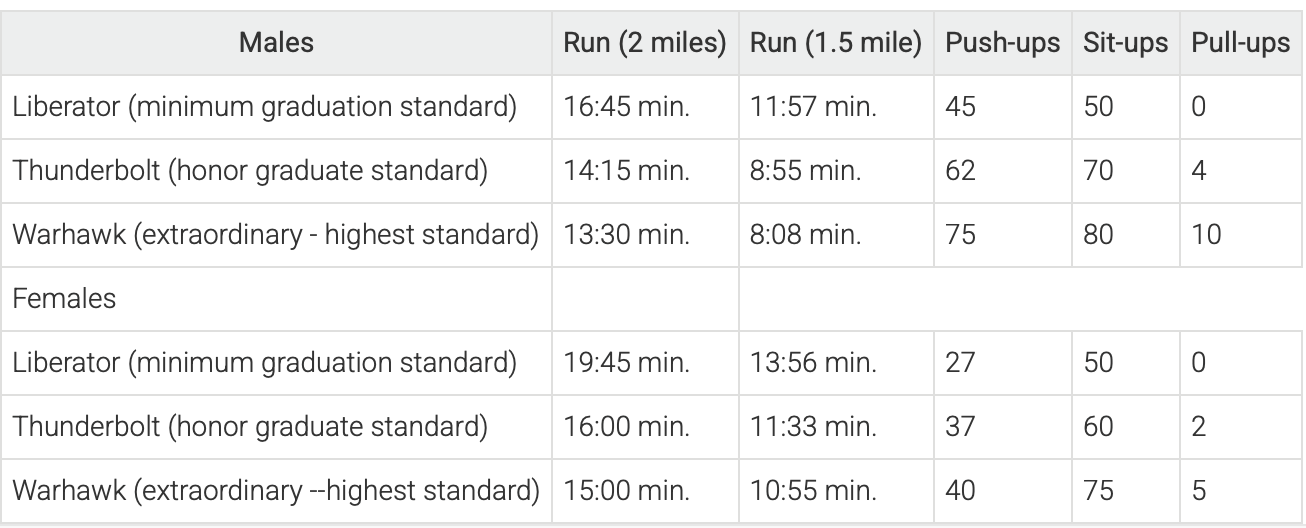
I think the US military’s standards do. They vary by branch and are changing, but here are some previous military fitness standards from the Air Force:
Pushups and sit-ups arehow many can be done in one minute
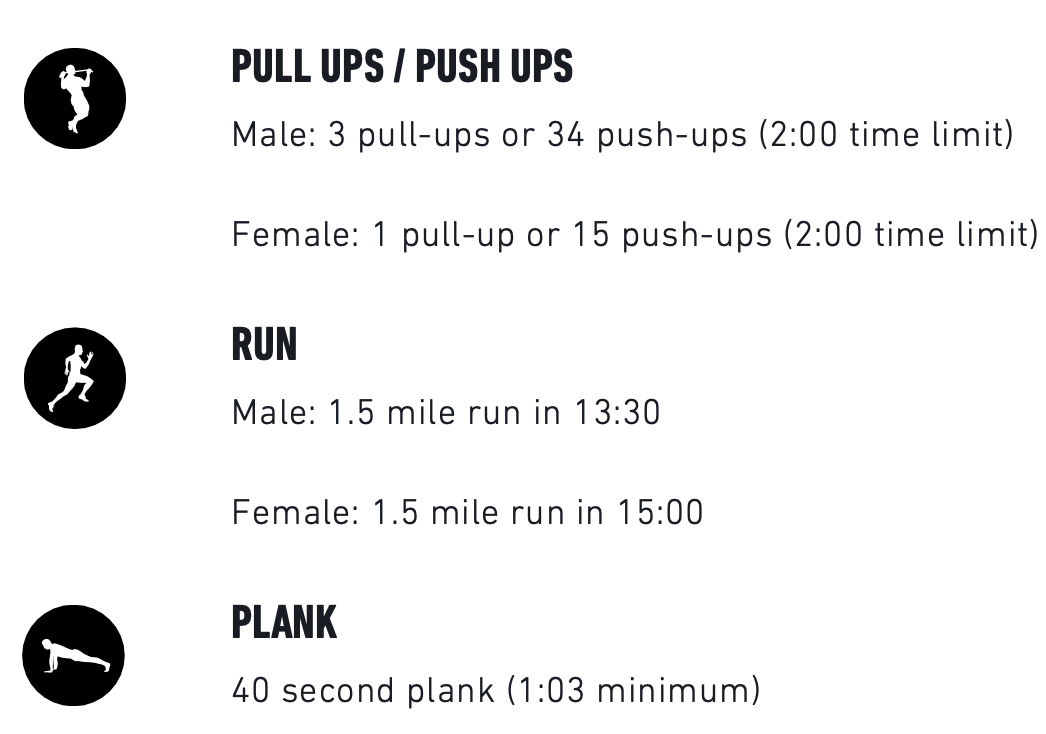
Here’s what the Marines expect from recruits before they show up for training:
The Army has a complex points system that varies by age and gender, but their minimum standards for a 20-year-old Male include: hex bar deadlift 150 lbs for 3 reps, 15 hand-release pushups within 2 minutes, plank for a minute 30, and a 2 mile run in 19:57 (plus their own sprint/drag/carry test in 2:28).
I like that the standards all involve a mix of strength and speed, and that they might take some work but should be achievable in a reasonable amount of time for a healthy person. I also like that they give stretch goals for the over-achievers in addition to their minimums.
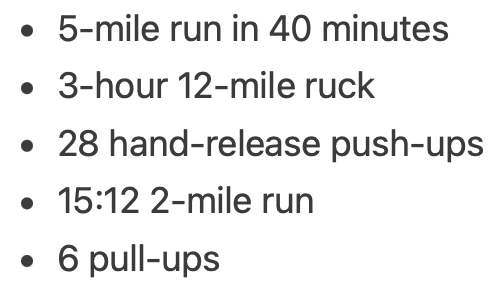
What about the real over-achievers, the ones who want to be not just “in shape” but “in great shape” or “in excellent shape”? For them, there are the special forces fitness tests. Here’s the Green Berets:
I’m in no way an authority on any of this, but for what it’s worth, you have my permission to say you’re in shape if you can meet any branch’s minimum requirements.
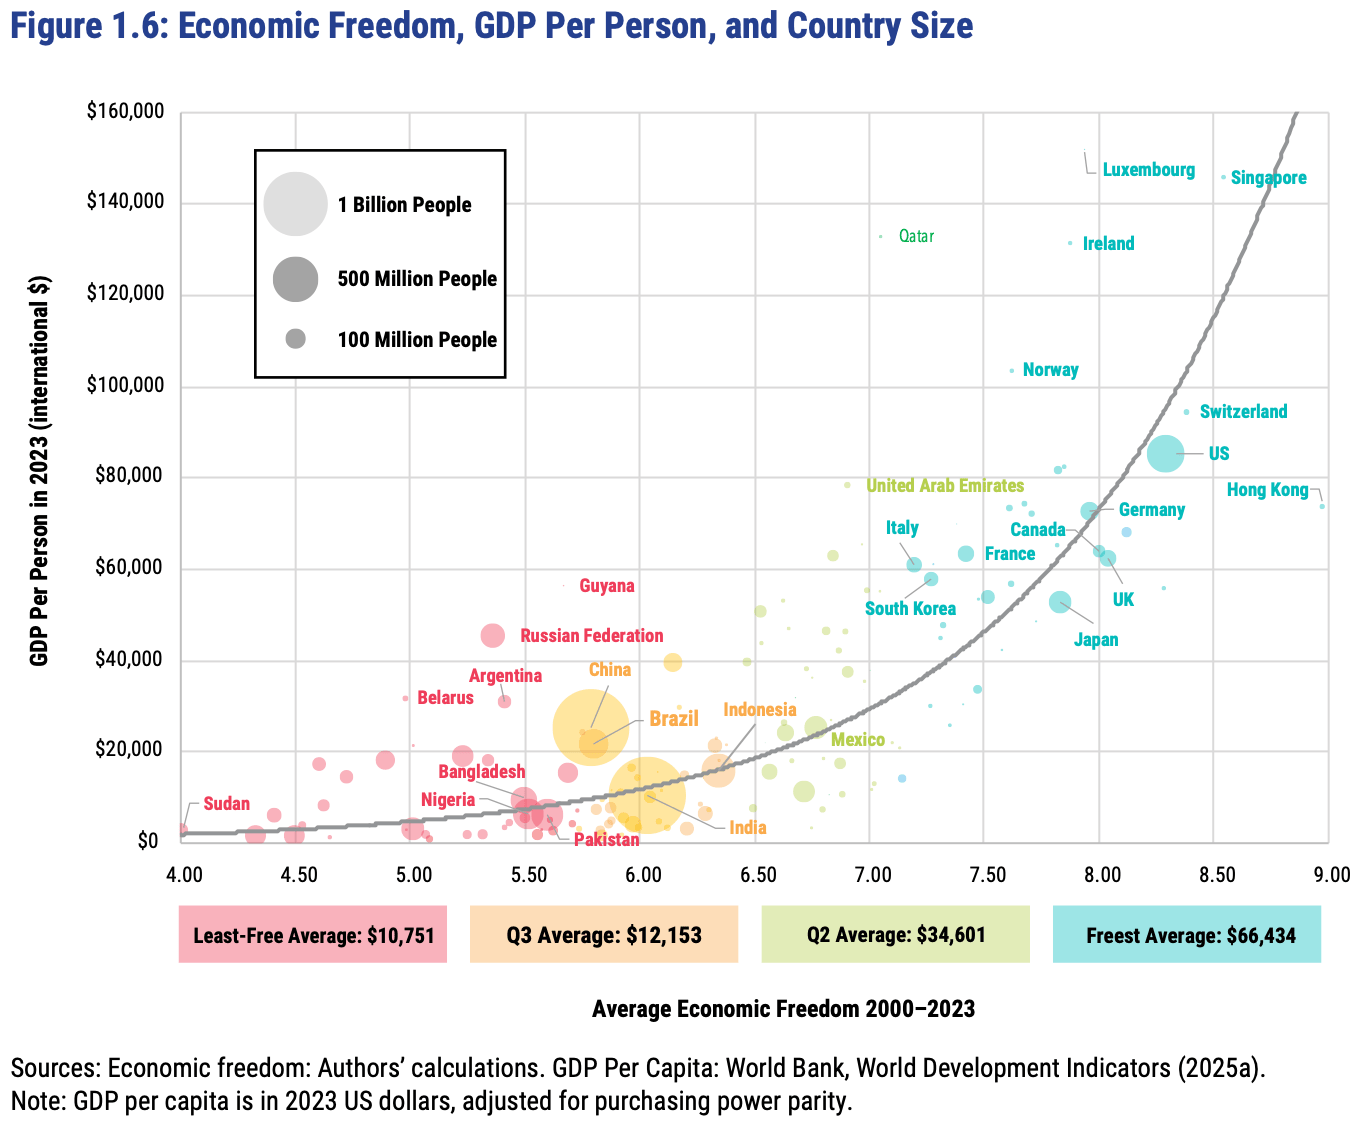
The Fraser Institute released their latest report on the Economic Freedom of the World today, measuring economic policy in all countries as of 2023. They made this excellent Rosling-style graphic that sums up their data along with why it matters:
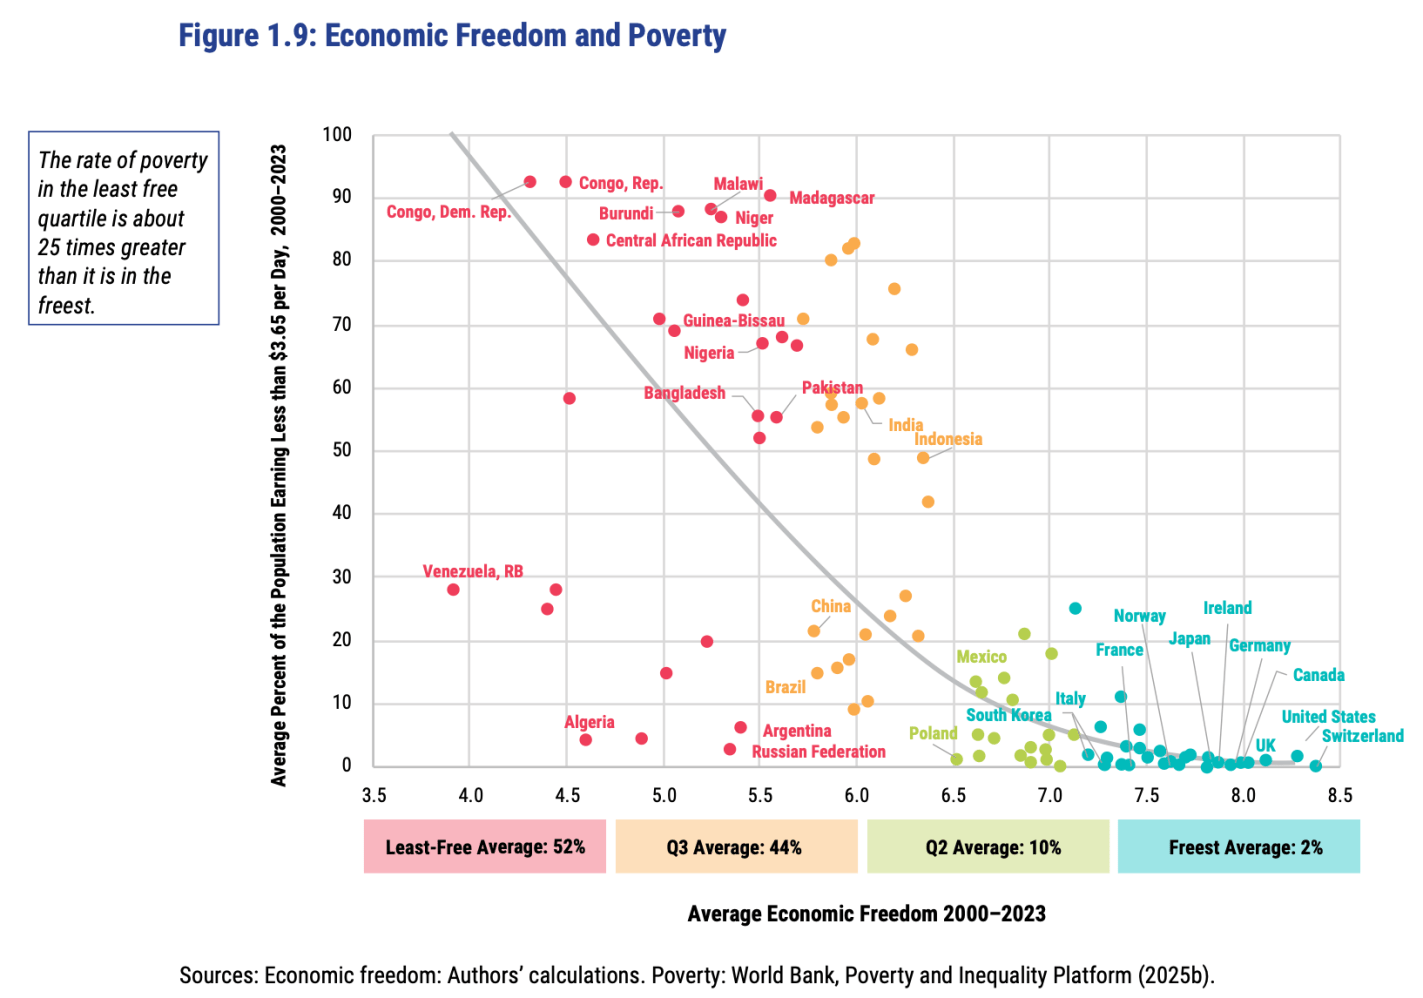
In short: almost every country with high economic freedom gets rich, and every country that gets rich either has high economic freedom or tons of oil. This rising tide of prosperity lifts all boats:
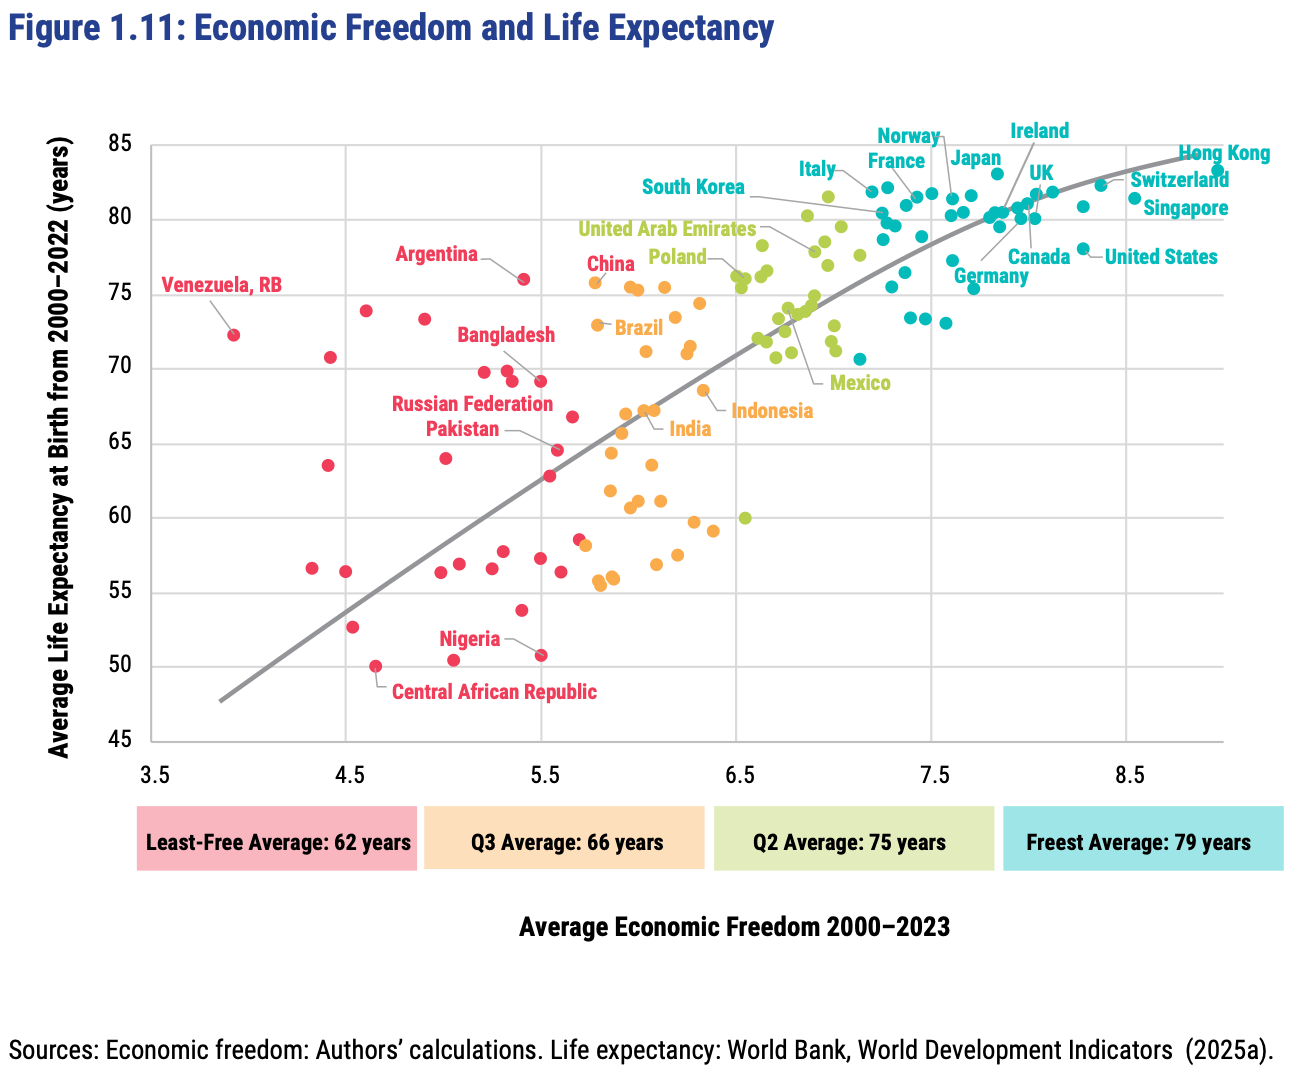
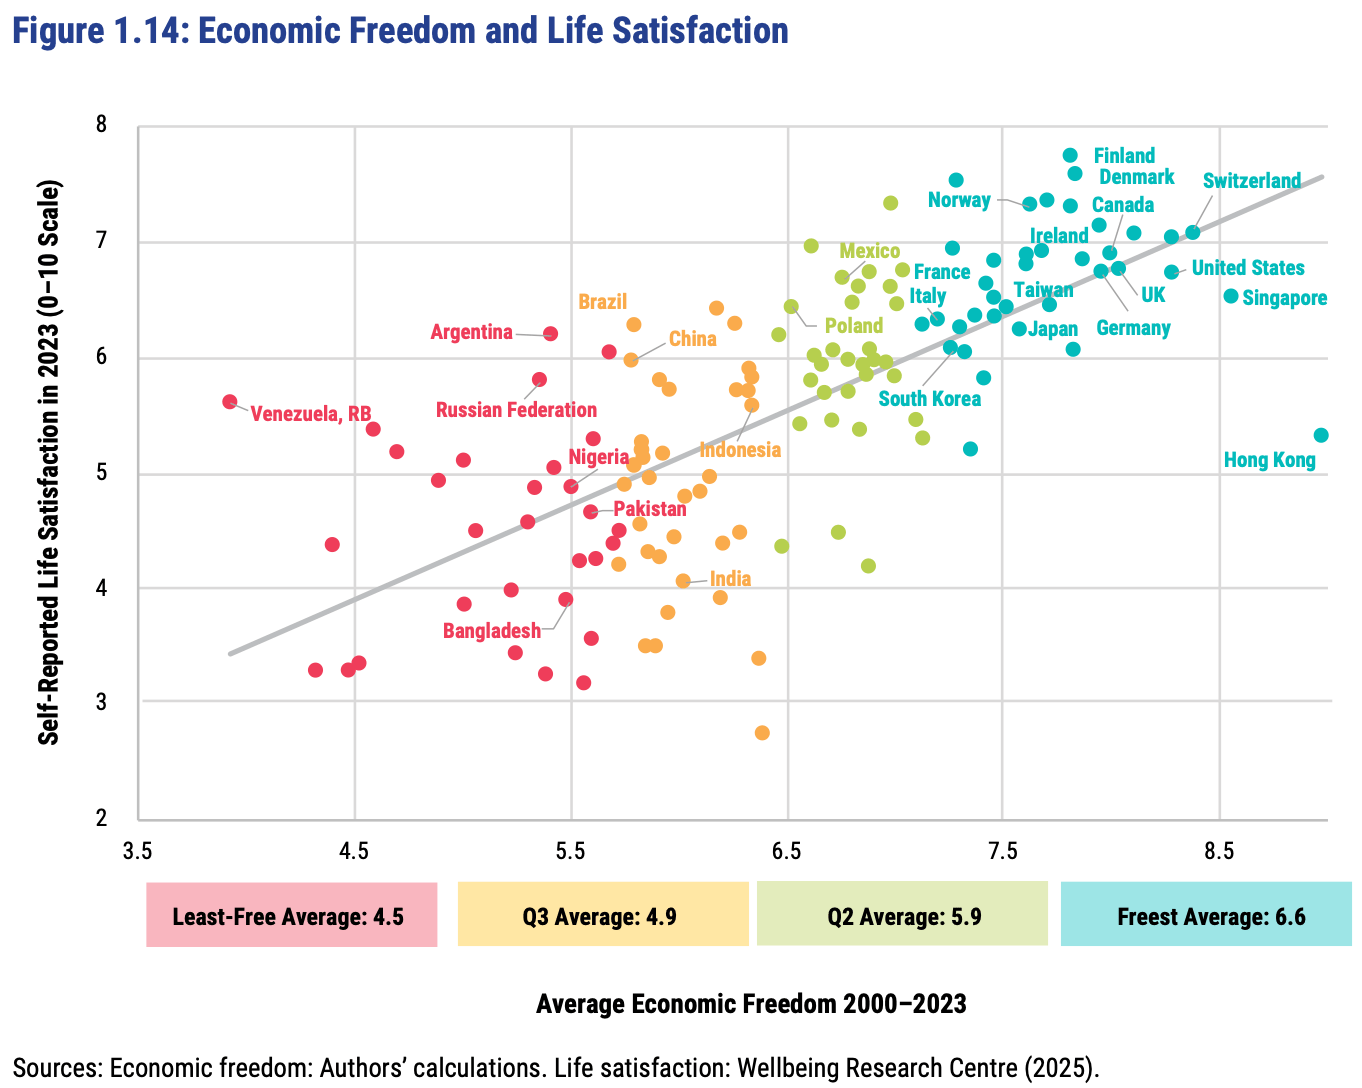
This greater prosperity that comes with economic freedom goes well beyond “just having more stuff”:
The full report, along with the underlying data going back to 1970, is here. The authors are doing great work and releasing it for free, so no complaints, but two additional things I’d like to see from them are a graphic showing which countries had the biggest changes in economic freedom since last year, and links to the underlying program used to create the above graphs so that readers could hover over each dot to identify the country (I suppose an independent blogger could do the first thing as easily as they could…).
FRDM is an ETF that invests in emerging markets with high economic freedom (I hold some), I imagine they will be rebalancing following the new report.
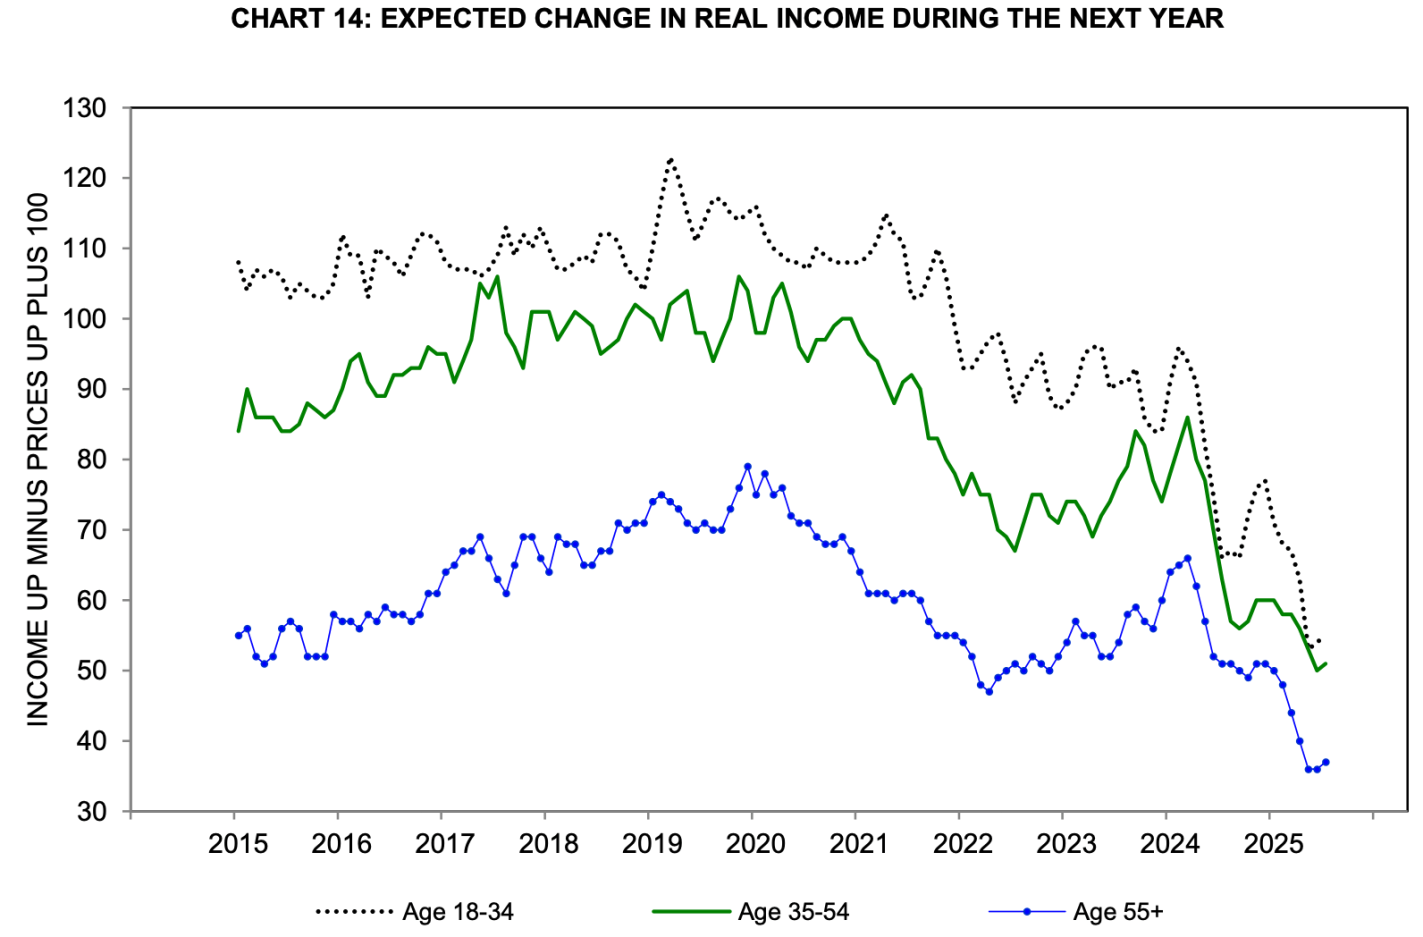
But as Jeremy often points out here, young adults have actually been doing pretty well at building wealth. So why are they so gloomy?
Since I’ve now aged out of the young adult category, I’m obligated to start by wondering if kids these days are just whinier, and need to quit doomscrolling and toughen up. But if I try to see things their way, here’s what I can come up with for why their pessimism could be rational:
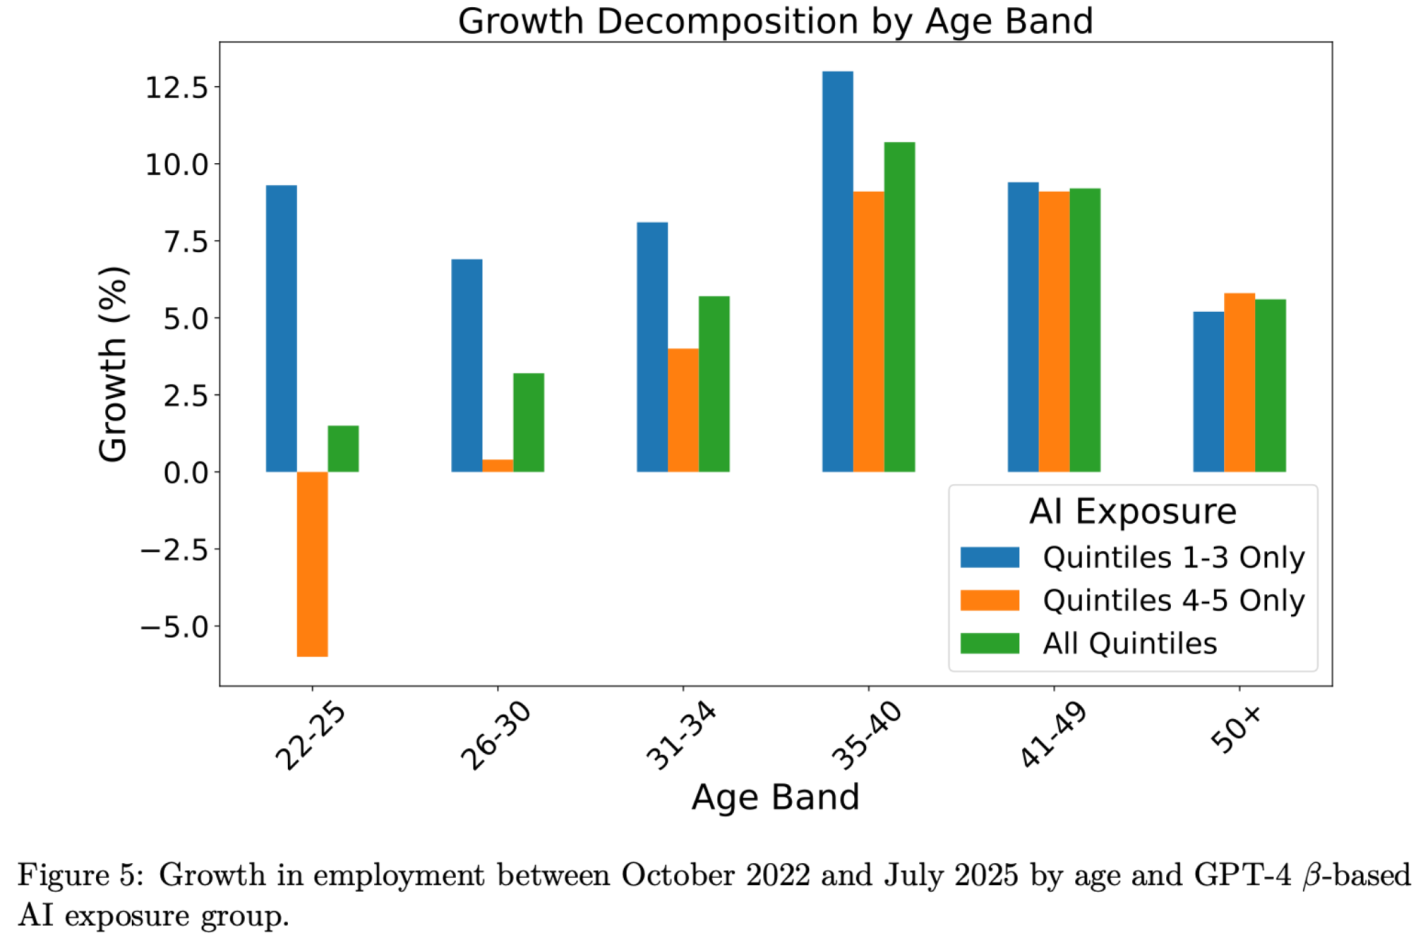
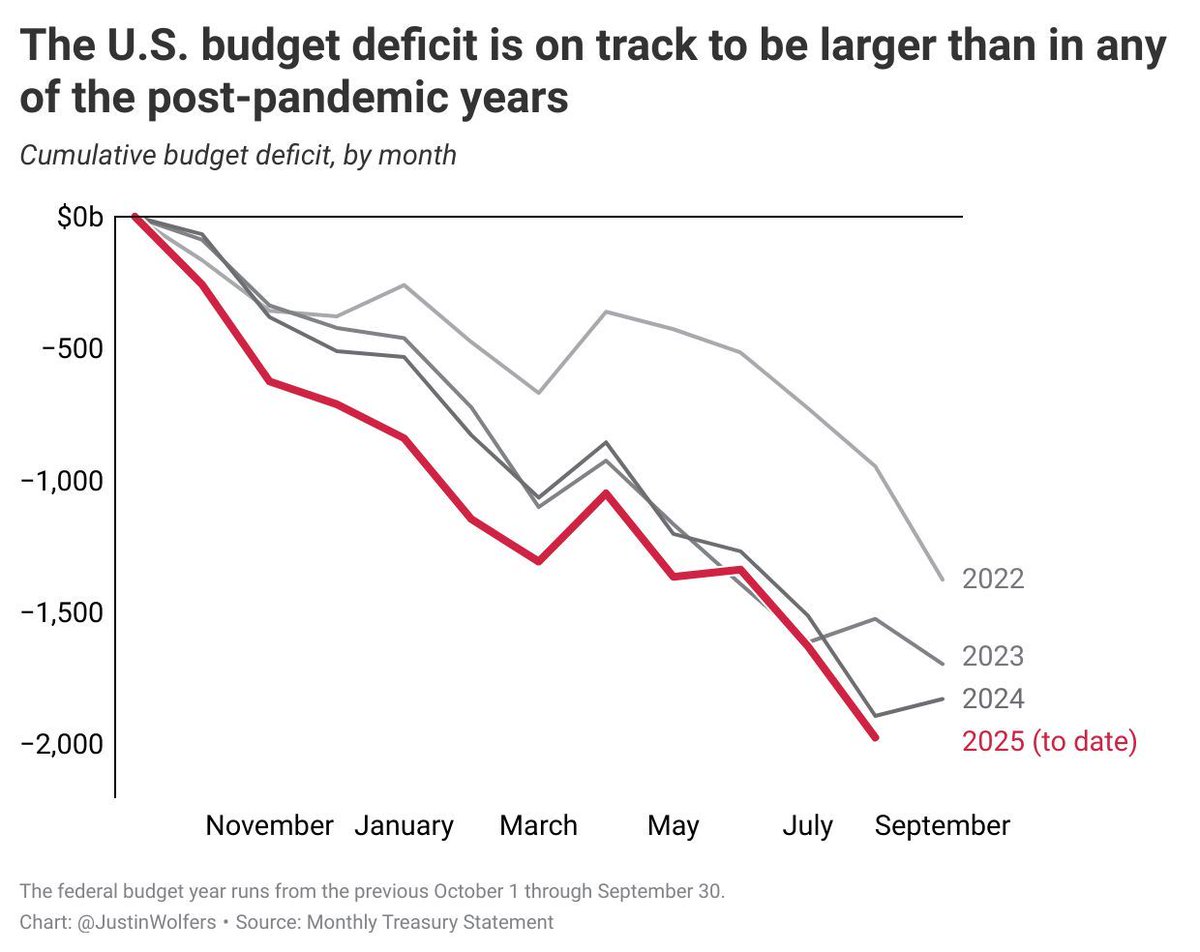
It’s About The Future: Sure things have been fine, but that is about to change. The more farsighted youth know they will be the ones expected to pay back the big deficits the Federal government is running. They have student loans to pay today now that payments have fully resumed. I predicted after the 2022 student loan forgiveness that we would be back to all-time highs in student debt by 2028, but in fact we are there already. The youth unemployment rate is now 10.5%, up from 6.6% in April 2023, and could rise a lot more if AI really starts displacing jobs:
Source: Brynjolfsson, Chandar and Chen 2025.Source: Michigan Consumer Survey
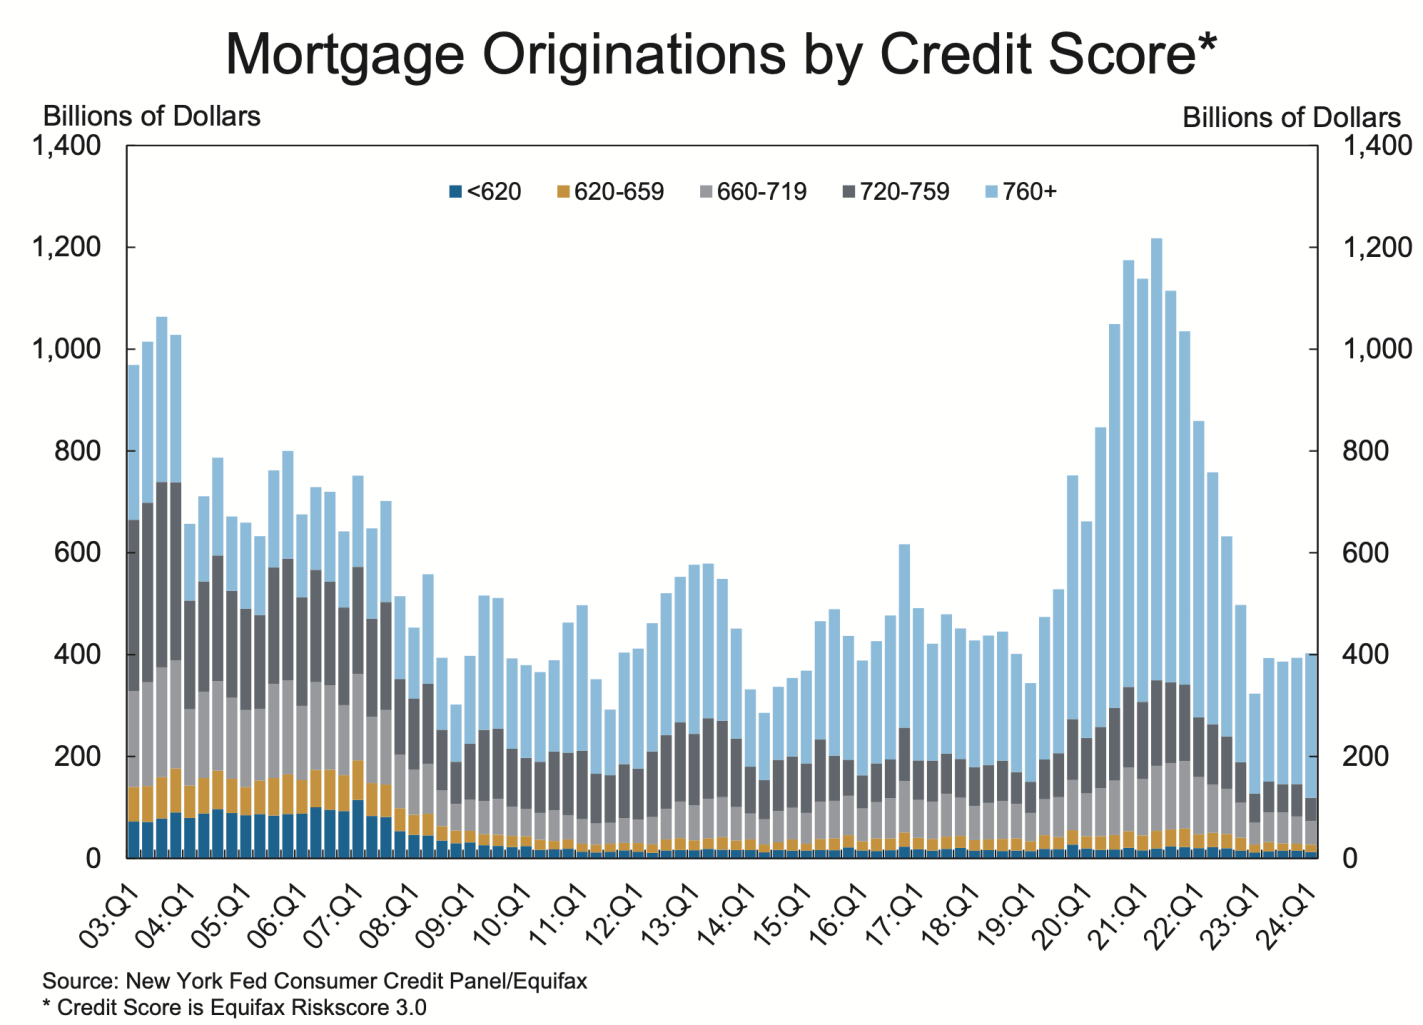
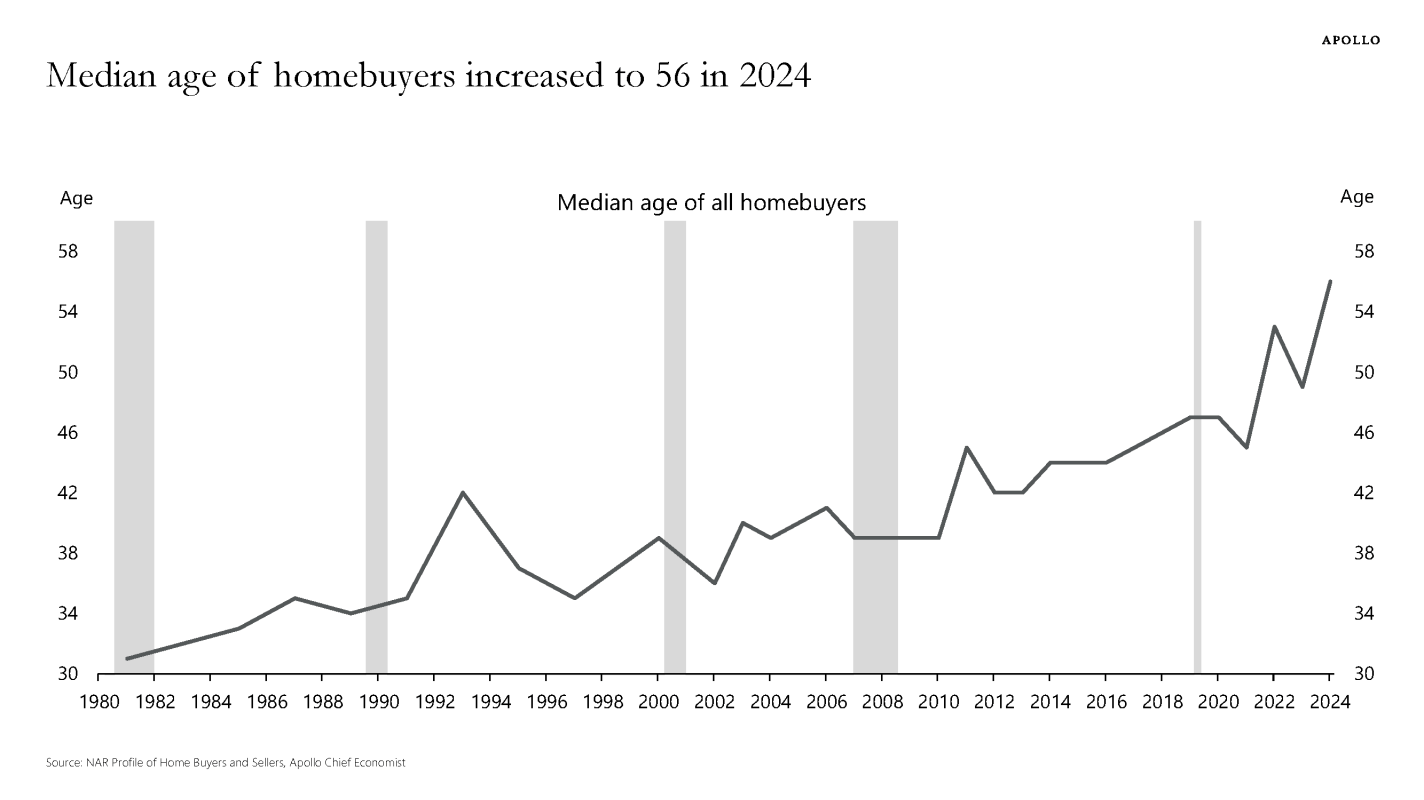
2. It’s About Housing: House prices are at all time highs (far above the prices during the 2000s “bubble”). Mortgage rates remain high, and to the extent that Fed rate cuts push them down, they will likely push prices higher, leaving homes hard to afford. High credit standards post-Dodd-Frank mean younger buyers in particular find it hard to get a mortgage; homeownership rates are falling while the average age of homeowners shoots upward. Most older people already own a house, while most young people want to buy but see that as increasingly out of reach.
Good luck getting a mortgage without super-prime creditEveryone thinks it’s a bad time to buy a house, but this matters most if you’re young and don’t already own oneThe median American is 39 years old but the median homebuyer is 56
The Fed has had an official inflation target of 2% since 2012, a commitment they reaffirmed just last month after their policy review:
The Committee reaffirms its judgment that inflation at the rate of 2 percent, as measured by the annual change in the price index for personal consumption expenditures, is most consistent over the longer run with the Federal Reserve’s statutory maximum employment and price stability mandates.
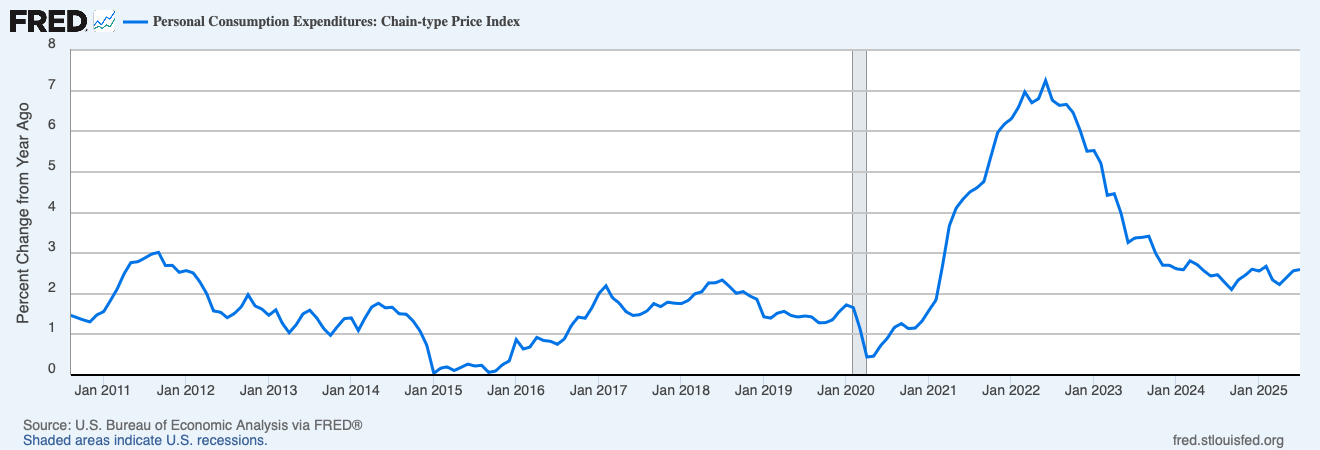
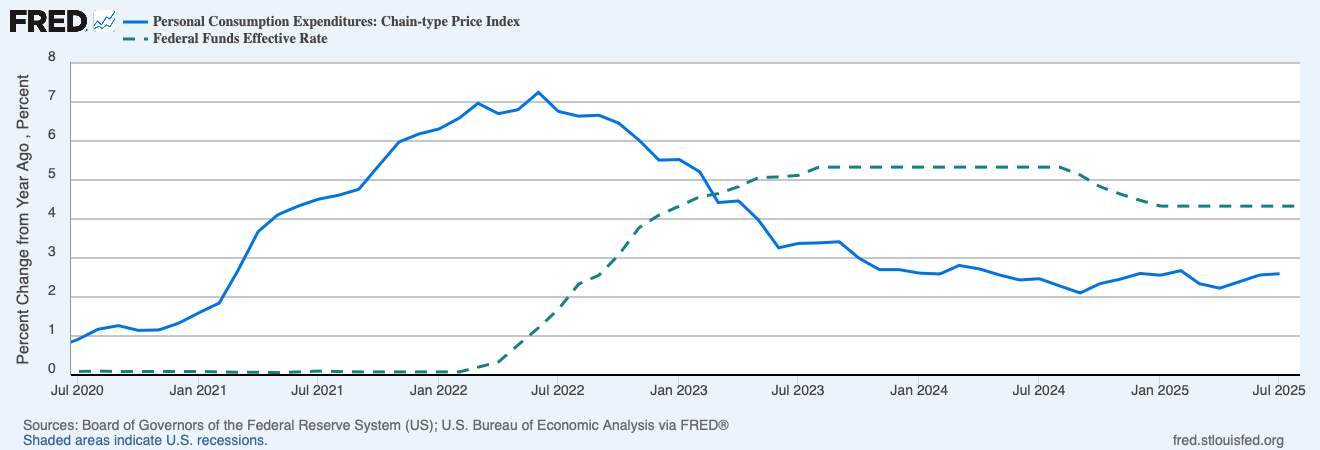
But since 2020, they haven’t been acting like it. Lets look at their preferred measure of inflation, the annual change in the PCE price index:
The last time annual inflation was at or below 2.0% was February 2021. The Fed just cut rates despite inflation being at 2.6%. If you didn’t know about their 2% target and were trying to infer their target based solely on their actions, what would you guess their target is?
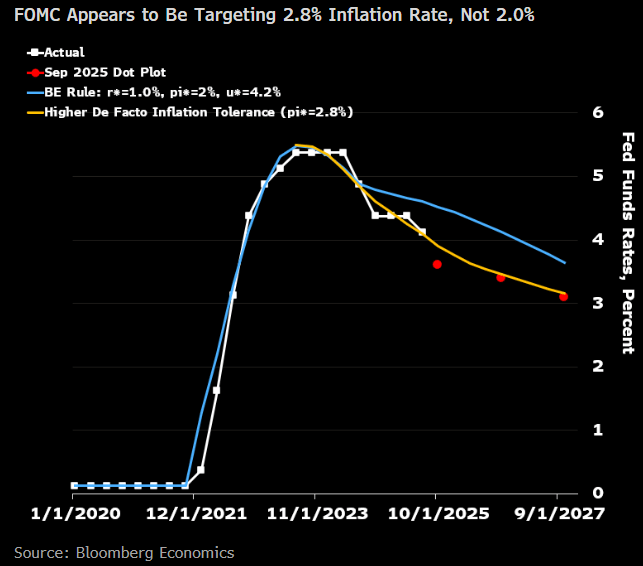
Considering the post-Covid period, I see their actions as being more consistent with a 3% target than a 2% target. They stopped raising rates once inflation got below 3.4%, and started cutting them again once inflation got below 2.4%. The Fed’s own projections show more rate cuts coming despite the fact that they don’t expect inflation to get back to 2.0% until 2028! Bloomberg’s Anna Wong does the math and infers their target is 2.8%:
Perhaps the Fed’s target should be higher than 2%, but if they have a higher target, they should make it explicit so as not to undermine their credibility. Or at least make explicit that their target is loose and they’d rather miss high than low, if that is in fact the case. This is what Greg Mankiw would prefer:
I feel strongly that a target of 2 percent is superior to a target of 2.0 percent….. It would be better if central bankers admitted to the public how imprecise their ability to control inflation is. They should not be concerned if the inflation rate falls to 1.6. That comfortably rounds up to 2. And they should be ready to declare victory in fighting inflation when the inflation rate gets back to 2.5. As the adage goes, that is good enough for government work. Maybe the Fed should even ditch a specific numerical target for inflation and instead offer a range, as some other central banks do. The Fed could say, for example, that it wants to keep the inflation rate between 1 and 3. Doing so would admit that the Fed governors are notquite as godlike as they sometimes feign.
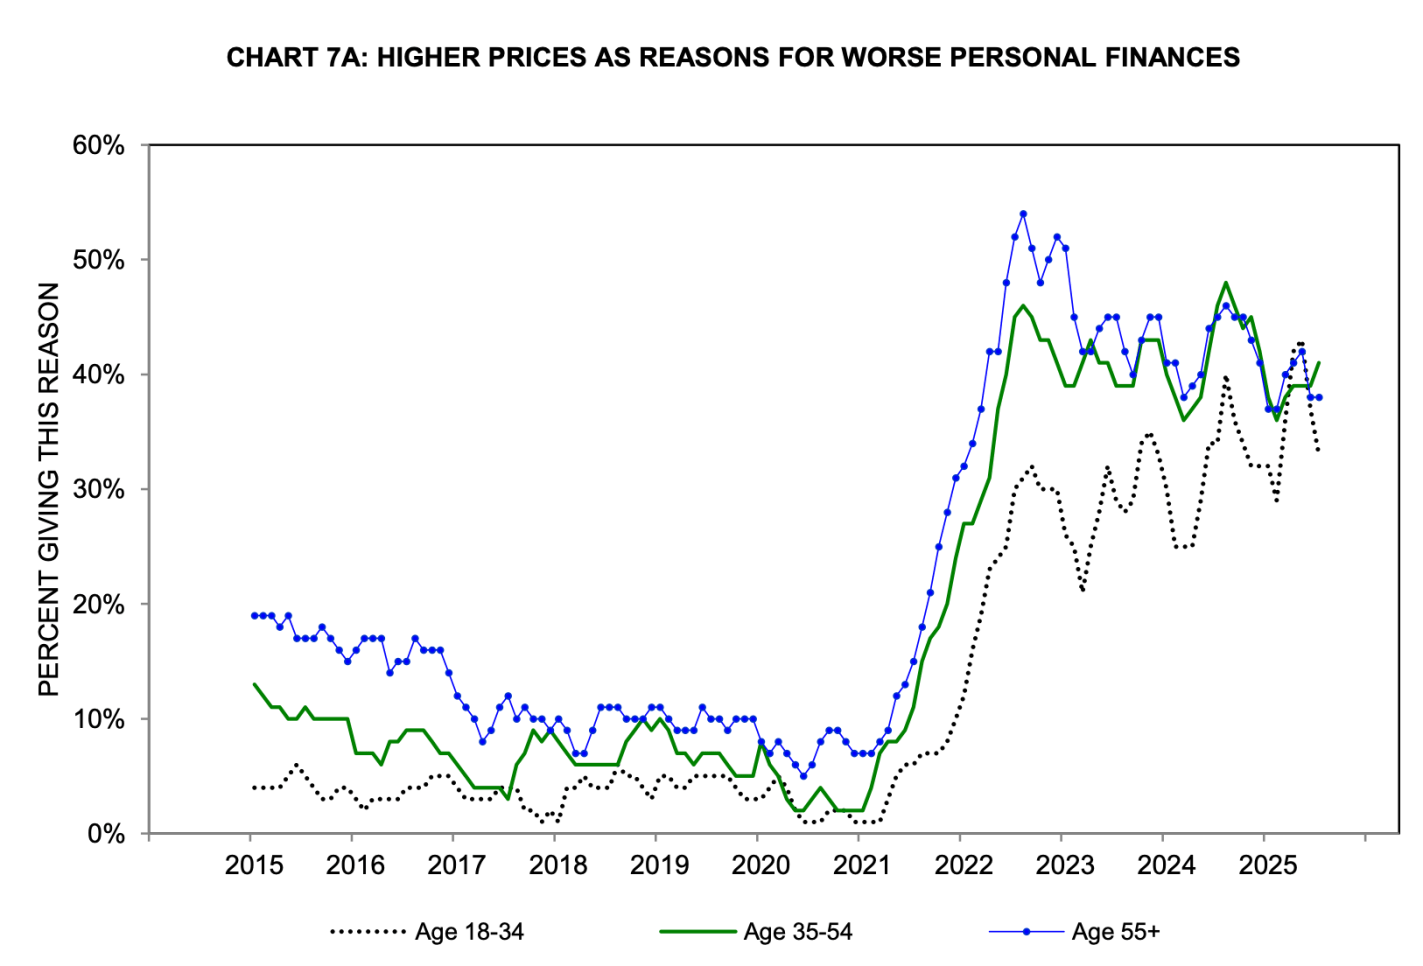
The Fed seems to have taken Mankiw’s approach to heart, except with a preferred range of 2.0-3.5%. I take Mankiw’s point about not being able to fine-tune everything, but given the bigger picture I think the Fed should if anything err on the low side of 2.0%. The Federal deficit is in the trillions and rising, inflation has been above target since 2021, and consumers never got over the Covid-era increase in the price level:
Source: Michigan Consumer Survey
The Fed let inflation stay mostly below 2% during the 2010s, to the detriment of the labor market. They updated their policy framework in 2020 to allow for “Flexible Average Inflation Targeting”, where they would let inflation stay above 2% for a while to make up for the years of below 2% inflation. This is part of why they let inflation get so out of hand in 2022. This made up for the 2010s and then some- our price level is now 3-4% higher than it would be if we’d had 2.0% inflation each year since 2007. But the sudden big burst of inflation in 2022 led the Fed to abandon this flexible targeting idea in the 2025 framework. The lack of “make up” policy latest framework means that they don’t see themselves as needing to do anything to repair their 2022 mistake- “just don’t do it again”.
We’re certainly being stuck with permanently higher prices as a result, and I worry we will be stuck with higher inflation too.
The Federal Reserve will probably cut rates next week:
I can’t advise them on the complexpolitics of this, but based on the economics I think cutting would be a mistake. I see one good reason they want to cut: hiring is slow and apparently has been for a year. But that could be driven by falling labor supply rather than falling demand, and most other indicators suggest holding rates steady or even raising them.
Most importantly, inflation is currently well above their 2% target, 2.9% over the past year and a higher pace than that in August. Inflation expectations remain somewhat elevated. Real GDP growth was strong in Q2 and looks set to be strong in Q3 too, and NGDP growth is still well above trend.. The Conference Board’s measure of consumer confidence looks bad, but Michigan’s looks fine.
Financial conditions are loose, with stocks at all time highs and credit spreads low. Its only September and we’ve already seen more Initial Public Offerings than in any year since 2021 (when the last big bout of inflation kicked off):
Crypto prices are back near all time highs and crypto is becoming more integrated into public stocks through bitcoin treasury companies and IPOs from Gemini and Figure.
The Taylor Rule provides a way of putting all this together into a concrete suggestion for interest rates. Some versions of the rule say rates are about on target, while others including my preferred Bernanke versionsuggest they should be closer to 6%. To me this is what the debate should be- do we keep rates steady or raise them? I see good arguments each way, but the case for a cut seems very weak.
I look forward to finding out in a year or two whether I or the FOMC is the crazy one here.
* The Usual Disclaimer, hopefully extra obvious in this case: These views are mine and I’m not speaking for any part of the Federal Reserve System.