Is this the year the world’s largest economics conference settles into its new normal? ASSA 2024 starts in San Antonio today.
Like most conferences, the Allied Social Science Association took a big hit during the pandemic. Unlike most other conferences, a big fraction of this hit appears to be permanent. Part of what made ASSA so popular was that it was the site of most 1st-round job interviews for economists, but the pandemic made this shift to remote interviews. The American Economic Association decided the job market was better that way, so they made the arrangement permanent.
This shrunk their conference by about half compared to pre-2020; overall I thought it was still fine last year, but that the transition creates a problem:
The big problem with attendance falling to 6k is that they’ve planned years worth of meetings with the assumption of 12k+ attendance. Getting one year further from Covid and dropping mask and vaccine mandates might help some, but the core issue is that 1st-round job interviews have gone remote and aren’t coming back. The best solution I can think of is raising the acceptance rate for papers, which in recent history has been well under 20%.
I suspect the AEA is starting to take my advice. Acceptance rates ticked up slightly in 2023 (from 7% to 9% for individual papers, and from 16% to 30% for complete sessions). They have yet to release full information on acceptance rates this year, but my own experience indicates that this summer they realized they had a problem. I got a rejection email in July that said:
We were able to accept less than one third of the more than 1,150 submissions for paper or poster sessions.
This was followed by something I’ve never seen from an economics conference before- a rejection of the rejection:
You have probably already received an email saying your paper which you submitted for the American Economic Association program at the meeting in San Antonio, TX in January 2024 was not accepted. However, the AEA has decided to select a few more papers for the poster session.
I am pleased to inform you that your paper entitled
Certificate of Need and Self-Employment
which you submitted for the American Economic Association program, has been selected to be part of the AEA’s poster session.
This sums up my relationship to the core of the profession nicely: I’m exactly on the margin of it. But this time, just barely on the right side of it, helping them fill up a newly-oversized hotel block.
The odds aren’t what they were in the mega-conference days before 2020, but I expect I’ll still see some of you in San Antonio.
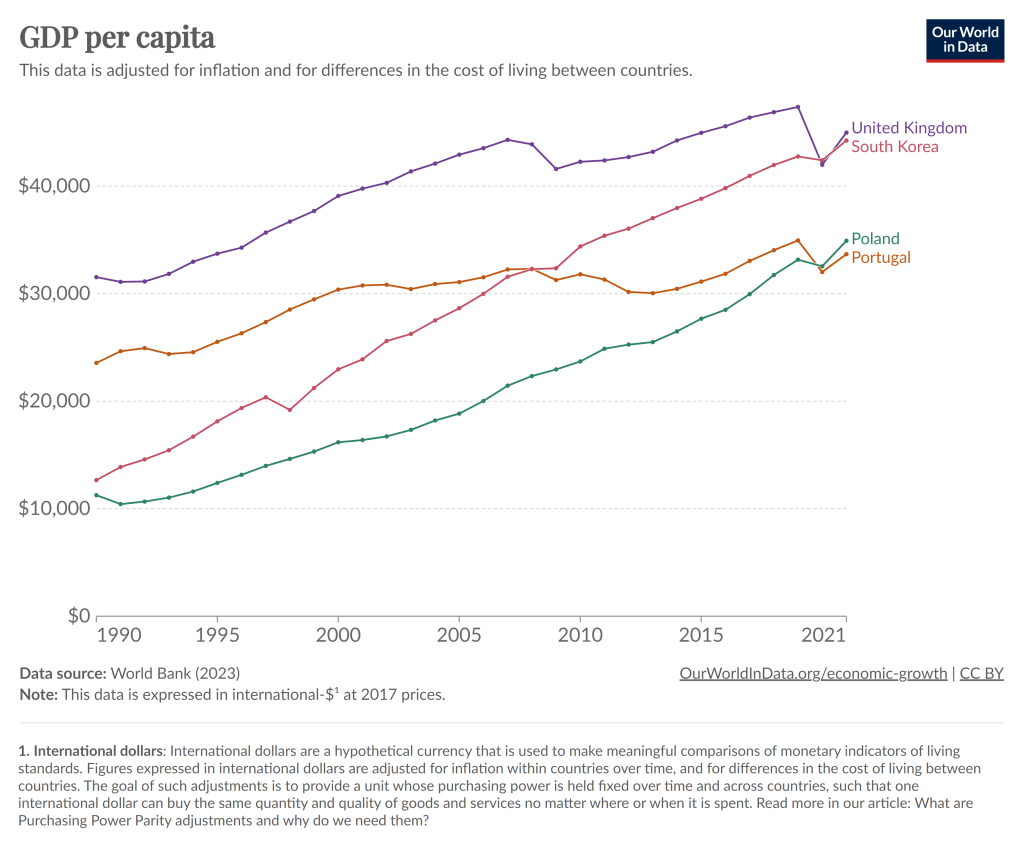
To kick off 2024, I’m just going to give you a chart to think about:
Notice that in 1990, Poland had about half the average income of Portugal, as did South Korea compared to the UK. By about 2021, those gaps had been completely closed. And while the 2021 data is a bit uncertain given the pandemic, IMF estimates for 2024 suggest that both Poland and South Korea have now pulled slightly ahead of Portugal and the UK.
You can find many other examples like this. Why have some countries grown rapidly while others have slowed or stagnated? In some sense, this is an age-old question in economics, and at least as far back as Adam Smith economists have been trying to answer that question.
But it’s actually a bit different now. In Smith’s day, the big question was why some countries had started on their path of economic growth, while others hadn’t started at all. Today, nearly all countries have started economic growth, but some of the early leaders in growth seem to have slowed down. But there isn’t some global reason for this that affects all countries: Poland and South Korea will likely keep growing for a while, and eventually there will be a big gap between them and Portugal and the UK.
The answer to this question is not, of course, just One Big Thing. But for countries like Portugal and the UK (and Japan and Spain and Italy and etc. etc.), the key to their economic future is figuring out what Many Little Things these economic miracles are doing right so that they can return to a path of high economic growth. And this isn’t just a race to see who wins: all countries can be winners! But without continued growth, solving economic, political, and social problems will be a huge challenge.
Maybe 2024 is when they will start to figure it out.
Back in August I listed the most-read posts of 2023. Here I will finish out the year by listing a few more highlights. This has been another big year for our website.
Zachary has been giving out good advice for economics teachers, backed up by his data. All professors can read: 5 Easy Steps to Improve Your Course Evals. Econ professors check: Update on Game Theory Teaching. It’s about how to teach Game Theory, but I also see it as a testament to how much a course can improve if you allow a teacher to iterate multiple times at the same school. Administrators, take note.
What We Are Learning about Paper Books is jointly my reflection on AI generative books and a review of Tyler Cowen’s new book GOAT. I’m a techno-optimist, but I think there is value in an old-fashioned paper book, mostly from a behavioral or neuro perspective.
Have you ever tried to do something objectively. It’s impossible. We might try, but how do we know when we’ve failed to compensate for a bias or when we’ve over compensated. Russ Roberts taught me 1) all people have biases, 2) all analysis is by people, & 3) analysis should be interpreted conditional on the bias – not discarded because of it.
The only people who don’t have biases are persons without values – which is no one. We all have apriori beliefs that color the way that we understand the world. Recognizing that is the first step. The second step is to evaluate your own possible biases or the bias of someone’s work. They may have blind spots or points of overemphasis. And that’s OK. One of the best ways to detect and correct these is to expose your ideas and work to a variety of people. It’s great to talk to new people and to have friends who are different from you. They help you see what you can’t.
Finally, because biases are something that everyone has, they are not a good cause to dismiss a claim or evidence. Unless you’re engaged in political combat, your role is usually not to defeat an opponent. Rather, we like to believe true things about the world. Let’s get truer beliefs by peering through the veil of bias to see what’s on the other side. For example, everyone who’s ever read Robert Higgs can tell that he’s biased. He wants the government to do much less and he’s proud of it. That doesn’t mesh well with many readers. But it’d be intellectually lazy to dismiss Higgs’ claims on these grounds. Higgs’ math and statistics work no differently than his ideological opponents. It’s important for us to filter which claims are a reflection of an author’s values, and the claims that are a reflection of the author’s work. If we focus on the latter, then you’ll learn more true things.
Know Multiple Models
In economics, we love our models. A model is just a fancy word which means ‘argument’. That’s what a mathematical model is. It’s just an argument that asserts which variables matter and how. Models help us to make sense of the world. However, different models are applicable in different contexts. The reason that we have multiple models rather than just one big one is because they act as short-cuts when we encounter different circumstances. Understanding the world with these models requires recognizing context clues so that you apply the correct model.
Models often conflict with one another or imply different things for their variables. This helps us to 1) understand the world more clearly, and 2) helps us to discriminate between which model is applicable to the circumstances. David Andolfatto likes to be clear about his models and wants other people to do the same. It helps different people cut past the baggage that they bring to the table and communicate more effectively.
For example, power dynamics are a real thing and matter a lot in personal relationships. I definitely have some power over my children, my spouse, and my students. They are different kinds of power with different means and bounds, but it’s pretty clear that I have some power and that we’re not equal in deed. Another model is the competitive market model that is governed by property rights and consensual transactions. If I try to exert some power in this latter circumstance, then I may end up not trading with anyone and forgoing gains from trade. It’s not that the two models are at odds. It’s that they are theories for different circumstances. It’s our job to discriminate between the circumstances and between the models. Doing so helps us to understand both the world one another better.
Today I’ll go into more detail on several measures of the labor force, but I won’t only compare it to 2019. I’ll compare it to all available data. And the sum total of the data suggests the 2023 was one of the best years for the US labor market on record. Note: December 2023 data isn’t available until January 5th, so I’m jumping the gun a little bit. I’m going to assume December looks much like November. We can revisit in 2 weeks if that was wrong.
The Unemployment Rate has been under 4% for the entire year. The last time this happened (date goes back to 1948) was 1969, though 2022 and 2019 were both very close (just one month at 4%). In fact, the entire period from 1965-1969 was 4% or less, though following January 1970 there wasn’t single month under 4% under the year 2000!
Like GDP, the Unemployment Rate is one of the broadest and most widely used macro measures we have, but they are also often criticized for their shortcomings, as I wrote in an April 2023 post.
With that in mind, let’s look to some other measures of the labor market.
The Differences-in-Differences literature has blown up in the past several years. “Differences-in-Differences” refers to a statistical method that can be used to identify causal relationships (DID hereafter). If you’re interested in using the new methods in Stata, or just interested in what the big deal is, then this post is for you.
First, there’s the basic regression model where we have variables for time, treatment, and a variable that is the product of both. It looks like this:
The idea is that that there is that we can estimate the effect of time passing separately from the effect of the treatment. That allows us to ‘take out’ the effect of time’s passage and focus only on the effect of some treatment. Below is a common way of representing what’s going on in matrix form where the estimated y, yhat, is in each cell.
Each quadrant includes the estimated value for people who exist in each category. For the moment, let’s assume a one-time wave of treatment intervention that is applied to a subsample. That means that there is no one who is treated in the initial period. If the treatment was assigned randomly, then β=0 and we can simply use the differences between the two groups at time=1. But even if β≠0, then that difference between the treated and untreated groups at time=1 includes both the estimated effect of the treatment intervention and the effect of having already been treated prior to the intervention. In order to find the effect of the intervention, we need to take the 2nd difference. δ is the effect of the intervention. That’s what we want to know. We have δ and can start enacting policy and prescribing behavioral changes.
Easy Peasy Lemon Squeezy. Except… What if the treatment timing is different and those different treatment cohorts have different treatment effects (heterogeneous effects)?* What if the treatment effects change over time the longer an individual is treated (dynamic effects)**? Further, what if the there are non-parallel pre-existing time trends between the treated and untreated groups (non-parallel trends)?*** Are there design changes that allow us to estimate effects even if there are different time trends?**** There’re more problems, but these are enough for more than one blog post.
For the moment, I’ll focus on just the problem of non-parallel time trends.
What if untreated and the to-be-treated had different pre-treatment trends? Then, using the above design, the estimated δ doesn’t just measure the effect of the treatment intervention, it also detects the effect of the different time trend. In other words, if the treated group outcomes were already on a non-parallel trajectory with the untreated group, then it’s possible that the estimated δ is not at all the causal effect of the treatment, and that it’s partially or entirely detecting the different pre-existing trajectory.
Below are 3 figures. The first two show the causal interpretation of δ in which β=0 and β≠0. The 3rd illustrates how our estimated value of δ fails to be causal if there are non-parallel time trends between the treated and untreated groups. For ease, I’ve made β=0 in the 3rd graph (though it need not be – the graph is just messier). Note that the trends are not parallel and that the true δ differs from the estimated delta. Also important is that the direction of the bias is unknown without knowing the time trend for the treated group. It’s possible for the estimated δ to be positive or negative or zero, regardless of the true delta. This makes knowing the time trends really important.
STATA Implementation
If you’re worried about the problems that I mention above the short answer is that you want to install csdid2. This is the updated version of csdid & drdid. These allow us to address the first 3 asterisked threats to research design that I noted above (and more!). You can install these by running the below code:
program fra
    syntax anything, [all replace force]
    local from "https://friosavila.github.io/stpackages"
    tokenize `anything'
    if "`1'`2'"==""  net from `from'
    else if !inlist("`1'","describe", "install", "get") {
        display as error "`1' invalid subcommand"
    }
    else {
        net `1' `2', `all' `replace' from(`from')
    }
    qui:net from http://www.stata.com/
end
fra install fra, replace
fra install csdid2
ssc install coefplot
Once you have the methods installed, let’s examine an example by using the below code for a data set. The particulars of what we’re measuring aren’t important. I just want to get you started with the an application of the method.
local mixtape https://raw.githubusercontent.com/Mixtape-Sessions
use `mixtape'/Advanced-DID/main/Exercises/Data/ehec_data.dta, clear
qui sum year, meanonly
replace yexp2 = cond(mi(yexp2), r(max) + 1, yexp2)
The csdid2 command is nice. You can use it to create an event study where stfips is the individual identifier, year is the time variable, and yexp2 denotes the times of treatment (the treatment cohorts).
The above output shows us many things, but I’ll address only a few of them. It shows us how treated individuals differ from not-yet treated individuals relative to the time just before the initial treatment. In the above table, we can see that the pre-treatment average effect is not statistically different from zero. We fail to reject the hypothesis that the treatment group pre-treatment average was identical to the not-yet treated average at the same time period. Hurrah! That’s good evidence for a significant effect of our treatment intervention. But… Those 8 preceding periods are all negative. That’s a little concerning. We can test the joint significance of those periods:
estat event, revent(-8/-1)
Uh oh. That small p-value means that the level of the 8 pretreatment periods significantly deviate from zero. Further, if you squint just a little, the coefficients appear to have a positive slope such that the post-treatment values would have been positive even without the treatment if the trend had continued. So, what now?
Wouldn’t it be cool if we knew the alternative scenario in which the treated individuals had not been treated? That’s the standard against which we’d test the observed post-treatment effects. Alas, we can’t see what didn’t happen. BUT, asserting some premises makes the job easier. Let’s say that the pre-treatment trend, whatever it is, would have continued had the treatment not been applied. That’s where the honestdid stata package comes in. Here’s the installation code:
local github https://raw.githubusercontent.com
net install honestdid, from(`github'/mcaceresb/stata-honestdid/main) replace
honestdid _plugin_check
What does this package do? It does exactly what we need. It assumes that the pre-treatment trend of the prior 8 periods continues, and then tests whether one or more post-treatment coefficients deviate from that trend. Further, as a matter of robustness, the trend that acts as the standard for comparison is allowed to deviate from the pre-treatment trend by a multiple, M, of the maximum pretreatment deviations from trend. If that’s kind of wonky – just imagine a cone that continues from the pre-treatment trend that plots the null hypotheses. Larger M’s imply larger cones. Let’s test to see whether the time-zero effect significantly differs from zero.
What does the above table tell us? It gives us several values of M and the confidence interval for the difference between the coefficient and the trend at the 95% level of confidence. The first CI is the original time-0 coefficient. When M is zero, then the null assumes the same linear trend as during the pretreatment. Again, M is the ratio by which maximum deviations from the trend during the pretreatment are used as the null hypothesis during the post-treatment period. So, above, we can see that the initial treatment effect deviates from the linear pretreatment trend. However, if our standard is the maximum deviation from trend that existed prior to the treatment, then we find that the alpha is just barely greater than 0.05 (because the CI just barely includes zero).
That’s the process. Of course, robustness checks are necessary and there are plenty of margins for kicking the tires. One can vary the pre-treatment periods which determine the pre-trend, which post-treatment coefficient(s) to test, and the value of M that should be the standard for inference. The creators of the honestdid seem to like the standard of identifying the minimum M at which the coefficient fails to be significant. I suspect that further updates to the program will come along that spits that specific number out by default.
I’ve left a lot out of the DID discussion and why it’s such a big deal. But I wanted to share some of what I’ve learned recently with an easy-to-implement example. Do you have questions, comments, or suggestions? Please let me know in the comments below.
The above code and description is heavily based on the original author’s support documentation and my own Statalist post. You can read more at the above links and the below references.
*Sun, Liyang, and Sarah Abraham. 2021. “Estimating Dynamic Treatment Effects in Event Studies with Heterogeneous Treatment Effects.” Journal of Econometrics, Themed Issue: Treatment Effect 1, 225 (2): 175–99. https://doi.org/10.1016/j.jeconom.2020.09.006.
**Sant’Anna, Pedro H. C., and Jun Zhao. 2020. “Doubly Robust Difference-in-Differences Estimators.” Journal of Econometrics 219 (1): 101–22. https://doi.org/10.1016/j.jeconom.2020.06.003.
***Callaway, Brantly, and Pedro H. C. Santa Anna. 2021. “Difference-in-Differences with Multiple Time Periods.” Journal of Econometrics, Themed Issue: Treatment Effect 1, 225 (2): 200–230. https://doi.org/10.1016/j.jeconom.2020.12.001.
****Rambachan, Ashesh, and Jonathan Roth. 2023. “A More Credible Approach to Parallel Trends.” The Review of Economic Studies 90 (5): 2555–91. https://doi.org/10.1093/restud/rdad018.
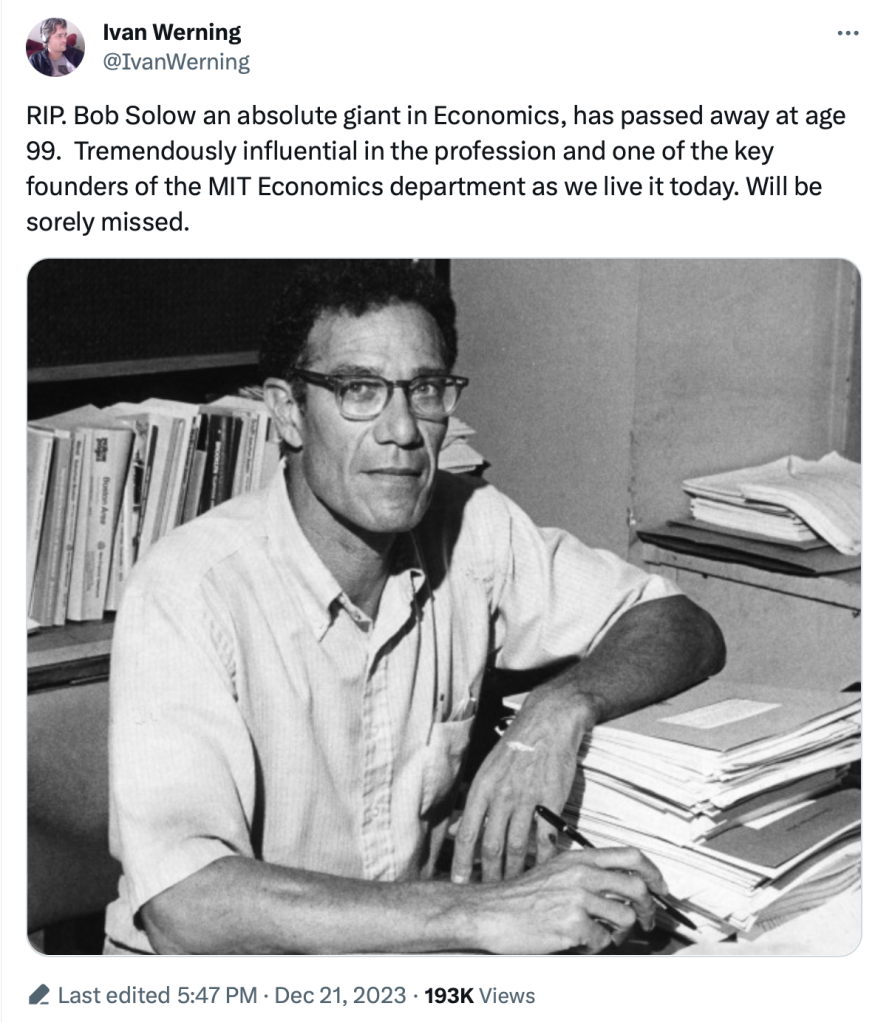
2023 continues to be a dangerous year for eminent economists. We have once again lost a Nobel laureate who was influential even by the standard of Nobelists, Robert Solow:
I’m sure you will soon see many tributes that discuss his namesake Solow Model (MR already has one), or discuss him as a person. I never got to meet him (just saw him give a talk) and the Solow Model is well known, so I thought I’d take this occasion to discuss one of his lesser-known papers- “Sustainability: An Economists Perspective“. What follows comes from my 2009 reaction to his paper:
Lately many journalists and folks on X/Twitter have pointed out a seeming disconnect: by almost any normal indicator, the US economy is doing just fine (possibly good or great). But Americans still seem dissatisfied with the economy. I wanted to put all the data showing this disconnect into one post.
In particular, let’s make a comparison between November 2019 and November 2023 economic data (in some cases 2019q3 and 2023q3) to see how much things have changed. Or haven’t changed. For many indicators, it’s remarkable how similar things are to probably the last month before anyone most normal people ever heard the word “coronavirus.”
First, let’s start with “how people think the economy is doing.” Here’s two surveys that go back far enough:
The University of Michigan survey of Consumer Sentiment is a very long running survey, going back to the 1950s. In November 2019 it was at roughly the highest it had ever been, with the exception of the late 1990s. The reading for 2023 is much, much lower. A reading close to 60 is something you almost never see outside of recessions.
The Civiqs survey doesn’t go back as far as the Michigan survey, but it does provide very detailed, real-time assessments of what Americans are thinking about the economy. And they think it’s much worse than November 2019. More Americans rate the economy as “very bad” (about 40%) than the sum of “fairly good” and “very good” (33%). The two surveys are very much in alignment, and others show the same thing.
Back in June, I watched the livestream of the Chapman Economic Forecast with Dr. Jim Doti (who was president when I was a student at Chapman). Typically, this is a valuable informative event, and the team has an excellent record of performance. They have often outdone other forecasters in predicting the future.
That is why I feel a little bad for making this post in the summer and tweeting out Doti’s prediction that we would have a recession by now.
To be fair to Doti, there has been a lot of uproar over this issue. Lots of people thought the economy would be bad. And lots of people feel like the economy is bad (the “vibecession”) even though it is objectively not. Many tweets have gone by about it.
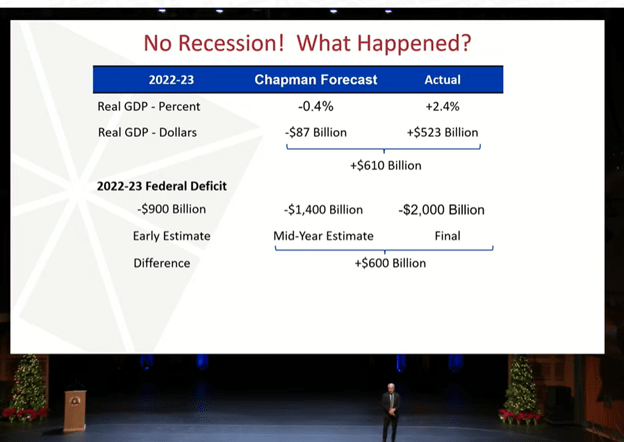
Doti opened by saying his prediction had turned out to be wrong. He had an explanation for it (pictured below). You can watch it free here (recorded on Dec 14).
Doti said that he had expected a large fiscal stimulus in the form of deficit spending, however he had not expected the deficit to be so large. Debt-financed spending propped up an economy that was otherwise poised to contract. At least, that is a plausible story.
Looking forward, Doti does not predict a recession next year, but he does predict weak growth and possibly one quarter of GPD decline (not two).
The next part of talk was about the long-term consequences of deficit spending. Nothing is free. TANSTAAFL
In addition to vibecession, anyone following economics in 2023 needs to know what a “soft landing” is.
Fed Chair Powell: "There's little basis for thinking the economy is in a recession now."
The latest Fed projections show a soft landing in 2024.
Growth slowing, but positive +1.4% Inflation cooling to ~2.4% Unemployment rising to 4.1% (so just below recession trigger) pic.twitter.com/6cvgC6l5Nd
I’ve taught GT a total of 5 time. Below are my average student course evaluations for “I would recommend this class to others” and “I would consider this instructor excellent”. Although the general trend has been improvement, improving ratings and the course along the way, some more context would be helpful. In 2019, my expectations for math were too high. Shame on me. It was also my first time teaching GT, so I had a shaky start. In 2020, I smoothed out a lot of the wrinkles, but I hadn’t yet made it a great class.
In 2021, I had a stellar crop of students. There was not a single student who failed to learn. The class dynamic was perfect and I administered the course even more smoothly. They were comfortable with one another, and we applied the ideas openly. In 2022, things went south. There were too many students enrolled in the section, too many students who weren’t prepared for the course, and too many students who skated by without learning the content. Finally, in 2023, the year of my changes, I had a small class with a nice symmetrical set of student abilities.
Historically, I would often advertise this class, but after the disappointing 2022 performance, and given that I knew that I would be making changes, I didn’t advertise for the 2023 section. That part worked out perfectly. Clearly, there is a lot of random stuff that happens that I can’t control. But, my job is to get students to learn, help the capable students to excel, and to not make students *too* miserable in the process – no matter who is sitting in front of me.