Is Long Covid Really a Thing?

We seem to be somewhat exhausted by all the dire predictions around Covid, now that life has largely gotten back to the normal. Shops and theaters are open, and people are once more crowding aboard those floating petri dishes called cruise ships. The most vulnerable segments of the population have mainly been vaccinated, and each new strain of the disease seems less harmful. All the anti-vaxxers I know have had Covid at least once and hence have some level of immunity, or else they caved and got vaccinated after seeing a close friend or relative die back in the winter of 2021-22. One enduring benefit of Covid is much more availability to work from home.

One of the direst prognostications was that the world would suffer a more or less permanent step down in standards of living due to “long Covid.”  According to this narrative, untold numbers of healthy young or middle-aged people would remain debilitated indefinitely due to the ongoing after-effects of a Covid infection: struck down in their prime, never to rise again.

A recent review of the field in Nature concluded, “The oncoming burden of long COVID faced by patients, health-care providers, governments and economies is so large as to be unfathomable”. Ouch. The federal government has provided $1.15 billion for research into the problem of long COVID and its mitigation.

Just the Facts

A couple of facts stand out: First, in many cases, scans of internal organs have shown changes in victims’ hearts and lungs and brains, following a severe Covid infection. Second, many people have reported symptoms such as weakness, fatigue and general malaise, impaired concentration and breathlessness, weeks after the primary symptoms of the disease have resolved.

How big a problem is this? I cannot, in the scope of a short blog post, adequately canvass all the data and literature. I will just cite a few numbers and charts, and let the professional data analysts dig into the fine points.

One meta-analysis found that a full “41.7% of COVID-19 survivors experienced at least one unresolved symptom and 14.1% were unable to return to work at 2-year after SARS-CoV-2 infection.” [That number seems much higher than my personal observations would suggest]. A CDC survey found that as of July 26-Aug 7, 2023, about 5.8 % of all Americans (which is 10.4% of Americans who ever had Covid) report experiencing some effects of long Covid, with 1.5% of all American adults experiencing significant activity limitations as result of long Covid. These numbers show a modest downward trend with time.

The chart below depicts the incidence of long Covid in England, again showing a modest downward trend in the latest year:

Weekly estimates of prevalence of COVID-19 and long COVID in England. Source.

Correlation versus Causation

So: we have many people experience severe symptoms from Covid, but most resolve within a few months at most. That leaves a small but nontrivial minority of Covid victims reporting problems long after that window. A significant question is whether Covid of itself caused those long-term symptoms, or just precipitated some problem that was bound to show up anyway.

I have read poignant anecdotes of perfectly healthy young people who suffer from brain fog two years later. But I have lived long enough to be wary of generalizing from poignant anecdotes. After all, the whole anti-vaccination movement has been fueled by poignant anecdotes of, say,  perfectly normal two-year-olds going autistic shortly after getting their vaccine shots.

The 2023 metastudy referred to earlier found that long Covid sufferers tended to be older, and had pre-existing medical comorbidities.  Similarly, we have known since 2020 that the cohorts most likely to die from Covid were older folks (such as me!), many of whom were bound to die anyway.  

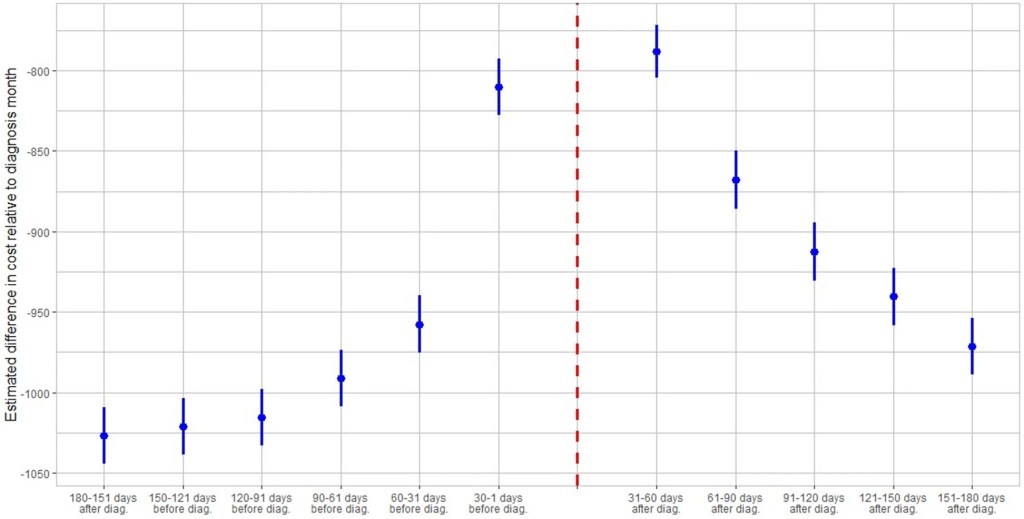
In this light, the data brought forth by James Baily in his recent article on this blog, Long Covid is Real in the Claims Data… But so is “Early Covid”?, is most interesting. He noted that on average people use more health care for at least 6 months post-Covid compared to their pre-Covid baseline, which is consistent with some measure of long Covid. However, those same individuals also spent significantly more on healthcare 1-2 months before their Covid diagnosis. This seems consistent with the notion that some of what gets blamed on Covid would have occurred sooner or later anyway.

A Nuanced View of Long Covid

An article in Slate by Jeff Wise has dug deeper into the data. He noted that the survey-based datasets that have been largely used to estimate the effects of long Covid tend to be biased: those who feel ongoing symptoms are more likely to complete the surveys, giving rise to some of the largish numbers I have shared above. Newer, better-controlled retrospective cohort studies tend to show much lower ongoing incidence of symptoms, especially compared to control groups who had not had Covid. The feared tidal wave of mass disabilities never arrived:

“The best available figures, then, suggest two things: first, that a significant number of patients do experience significant and potentially burdensome symptoms for several months after a SARS-CoV-2 infection, most of which resolve in less than a year; and second, that a very small percentage experience symptoms that last longer. ”

Further, “Another insight that emerges from the cohort studies into long COVID is that it is not so easy to prove causality between a particular infection and a symptom. Almost all the symptoms associated with long COVID can also be triggered by all sorts of things, from other viruses to even the basic reality of living through a pandemic.”

Finally:

It looks more as if people who complain of long COVID are suffering from a collection of different effects. “I think there’s quite a heterogeneous group of people all sailing under the one flag,” said Alan Carson, a neuropsychiatrist at the University of Edinburgh in Scotland. Some patients may be experiencing the lingering aftereffects that occur in the wake of many diseases; some patients with chronic comorbidities might be experiencing the onset of new symptoms or the continuation of old ones; others might be affected by the sorts of mood disorders and psychiatric symptoms you’d expect to find in a population undergoing the stress of a global pandemic.

Another Slate article from last month gently debunks alarmism stemming from a Nature Medicine study of U.S. veterans who showed increased susceptibility to disease even two years after contracting Covid.

 There is often great difficulty in discerning the actual organic, biochemical basis for the reported symptoms. This makes it hard to come up with a pill or a shot that might adjust the body’s metabolic pathways in order to cure them. Thus, simply treating the symptoms as such may offer the best near-term relief. To that end, a team of French researchers had the audacity to propose that much of the fatigue and brain fog associated with long Covid may be largely in our heads. In an article in the Journal of Psychosomatic Research  Why the hypothesis of psychological mechanisms in long COVID is worth considering , Lemogne, et al. noted strong links between a patient’s prior expectations of symptom severity and the actual reported outcomes. The intent of the researchers is not to belittle the reported distress of long Covid sufferers, but to point towards established therapeutic methods to help treat disorders with at least a partial psychosomatic basis:

Many potential psychological mechanisms of long COVID are modifiable factors that could thus be targeted by already validated therapeutic interventions. Beside the treatment of a comorbid psychiatric condition, which may be associated with fatigue, cognitive impairment or aberrant activation of the autonomous nervous system, therapeutic interventions may build on those used in the treatment of ‘functional somatic disorders’, defined as the presence of debilitating and persistent symptoms that are not fully explained by damage of the organs they point. These disorders are common after an acute medical event, particularly in women, and include psychological risk factors, such as anxiety, depression, and dysfunctional beliefs that can lead to deleterious, yet modifiable health behaviors. Addressing these factors in the management of long COVID may provide an opportunity for patient empowerment.

In sum: A significant number of those who contract COVID suffer ongoing symptoms for a number of months afterward. Over a billion dollars of research has been directed at the problem. The severity of these symptoms tends to decline with time, in the vast majority of cases resolving by twelve months. This leaves some individuals still suffering fatigue and brain fog over a year later. Studies are ongoing to discern the organic basis of these complaints, and the exact role that COVID may have played, in the light of the fact that complaints of enduring fatigue and brain fog were not uncommon before the pandemic. We hope that following the science will bring more relief here.

Circling back to our original interest in the economic impact of long COIVD, early studies indicated that a large fraction of the population might continue to be debilitated, to the point of being unable to work, with significant effects on the workforce and GDP. Actual data (e.g., on disability claims) indicate that these problems have not actually materialized.

Interpolation Vs Transition

Sometimes you read an academic article and the author fills in the data gaps with interpolation. That is, they assume some functional form of the data and then replace the missing values with the estimated ones. Often, lacking an informed opinion about functional form, authors will just linearly interpolate between the closest known values. Sometimes this method is OK. But sometimes we can do better.

Historical census data provides a good example because the frequency was only every ten years. Say that we want to know more about child migration patterns between 1850 and 1860. What happened in the intervening years? Who knows. Let’s look at the data.

Using data on individuals who have been linked across censuses allows us to fill in the gaps a little bit. For simplicity, let’s just look at whether a child migrant lived in an urban location and whether they lived on a farm. That means that there are 4 possible ways to describe their residence. Below is a summary of where children migrants lived at the age of zero in 1850 and where the same children lived a decade later at the age of ten in 1860 given that they moved counties.

When I’m the mean time did these children move from one place and to the other? We don’t know exactly. The popular answer is to say that they moved uniformly throughout the decade. That’s ‘fine’. But it assumes that the rate at which people departed places was rising and the rate at which they arrived places was falling. Maybe that’s true, but we don’t really know. Below-left is a graph that shows the linear interpolation.

The nice thing about linear interpolation is that everyone is accounted for at each point in time. The total number of people don’t rise or fall in the intervening interpolation period. But if we were to assume that children departed/arrived at each type of place at a constant rate (maybe a more reasonable assumption), then suddenly we lose track of people. That is, the sum of people dips below 100% as people depart faster than they arrive.

What’s the alternative to linear interpolation?

Continue reading

Long Covid is Real in the Claims Data… But so is “Early Covid”?

I’ve seen plenty of investigations of “Long Covid” based on surveys (ask people about their symptoms) or labs (x-ray the lungs, test the blood). But I just ran across a paper that uses insurance claims data instead, to test what happens to people’s use of medical care and their health spending in the months following a Covid diagnosis. The authors create some nice graphics showing that Long Covid is real and significant, in the sense that on average people use more health care for at least 6 months post-Covid compared to their pre-Covid baseline:

Source: Figure 5 of “Long-haul COVID: healthcare utilization and medical expenditures 6 months post-diagnosis“, BMC Health Services Research 2022, by Antonios M. Koumpias, David Schwartzman & Owen Fleming

The graph is a bit odd in that its scales health spending relative to the month after people are diagnosed with Covid. Their spending that month is obviously high, so every other month winds up being negative, meaning just that they spent less than the month they had Covid. But the key is, how much less? At baseline 6 months prior it was over $1000/month less. The second month after the Covid diagnosis it was about $800 less- a big drop from the Covid month but still spending $200+/month more than baseline. Each month afterwards the “recovery” continues but even by month 6 its not quite back to baseline. I’m not posting it because it looks the same, but Figure 4 of the paper shows the same pattern for usage of health care services. By these measures, Long Covid is both statistically and economically significant and it can last at least 6 months, though worried people should know that it tends to get better each month.

I was somewhat surprised at the size of this “post Covid” effect, but much more surprised at the size of the “pre Covid” or “early Covid” effect- the run-up in spending in the months before a Covid diagnosis. For the month immediately before, the authors have a good explanation, the same one I had thought of- people are often sick with Covid a couple days before they get tested and diagnosed:

There is a lead-up of healthcare utilization to the diagnosis date as illustrated by the relatively high utilization levels 30–1 days before diagnosis. This may be attributed to healthcare visits only days prior to the lab-confirmed infection to assess symptoms before the manifestation or clinical detection of COVID-19.

But what about the second month prior to diagnosis? People are spending almost $150/month more than at the 6-month-prior baseline and it is clearly statistically significant (confidence intervals of months t-6 and t-2 don’t overlap). The authors appear not to discuss this at all in the paper, but to me ignoring this lead-up is burying the lede. What is going on here that looks like “Early Covid”?

My guess is that people were getting sick with other conditions, and something about those illnesses (weakened immune system, more time in hospitals near Covid patients) made them more likely to catch Covid. But I’d love to hear actual evidence about this or other theories. The authors, or someone else using the same data, could test whether the types of health care people are using more of 2 months pre-diagnosis are different from the ones they use more of 2 months post-diagnosis. Doctors could weigh in on the immunological plausibility of the “weakened immune system” idea. Researchers could test whether they see similar pre-trends / “Early Covid” in other claims/utilization data; probably they have but if these pre-trends hold up they seem worthy of a full paper.

What are the Richest and Poorest MSAs in the US? Cost of Living Is Probably Less Important Than You Think

Income varies a lot across the US. So does the cost of living. Does it mostly wash out when you adjust incomes for the costs of living? No, not even close. Apples-to-apples comparisons are always hard, but it’s still worth making comparisons.

Let’s use some data that Ryan Radia put together that I really like, for several reasons. He uses the 100 largest MSAs — these comprise about 2/3 of the US population. He uses median income, so outliers shouldn’t effect the income data. He uses median family income, since the more common median household income is, in my opinion, very difficult to interpret (5 college students living together are a household, and so is one elderly person living alone). And Ryan also limits it to non-elderly, married couples, and then separates the data by the employment status of each member of the couple.

As an illustration, let’s use the data for married couples with only one spouse working full-time (I have played around with the data for other working statuses, and the results are similar). Before adjusting for the cost of living, here are the top MSAs with the highest median incomes:

  1. San Jose, CA: $169,000
  2. San Francisco: $140,000
  3. Bridgeport–Stamford, CT: $130,000
  4. Seattle: $130,000
  5. Boston: $129,000
  6. Washington, DC: $123,000
  7. Hartford, CT: $110,000
  8. Oxnard–Thousand Oaks, CA: $107,390
  9. Austin: $105,420
  10. New York: $105,000
Continue reading

The Least Terrible Car Safety Sites

I’m looking for a new car now and would like to know what the safest reasonable option is. There are lots of ways to get some information about this, but none are very good.

The government provides safety ratings based on crash tests they perform. This is better than nothing but the crash tests only test certain things and don’t necessarily tell you how a car performs in the real world. They also have a habit of just giving their top rating (5 stars) to tons of vehicles so it doesn’t help you pick between them, and they only compare cars to other cars in the same “class”, ignoring that some classes are safer than others. On top of all the problems with the ratings themselves, they also don’t provide any lists of their ratings, instead making you search one car at a time.

Several other sites improve on the government ratings by using real-world data on how often cars actually crash (much of which comes from the government, which as usual is great at collecting data but not so great at presenting it in helpful user-friendly ways). The Auto Professor grades cars using real-world data but otherwise has the same problems as the government (NHTSA) site. Cars get letter grades rather than a rank or meaningful number, so it’s not actually clear which car is best, or how much better the good cars are than the average or bad cars. You can search the grades for one car at a time but they don’t just list the safest cars anywhere, including on their page labelled “safest cars list“.

The Insurance Institute for Highway Safety uses real world data and provides actual numbers of fatality rates for different vehicles. This is great because you don’t have the problem of “dozens of cars all have 5-star / A, which is best?” or the problem of “how much better is 5 star than 4 star, or A than B?”. But they don’t include data from the 2 most recent years, and they only post their ratings for a handful of cars. Not only do they not present a complete list, they seem to have no search function whatsoever for their real-world data (they do for their NHSTA-style crash test data). Some 3rd party sites seem to have posted more complete versions of their data, but it still doesn’t show data for most car models.

The least-terrible car safety site I have found is Real Safe Cars. The good: they use real-world safety data, they apply reasonable-sounding corrections and controls do it, they present meaningful quantitative measures like “vehicle lifetime fatality chance” and “vehicle lifetime injury chance”, and they present the data using both a search function and lists of “safest vehicles”. For 2020 you can see that the #1 car, the 2020 Audi e-tron Sportback, has a vehicle lifetime fatality chance of 0.0158%. Compare this to the #100 car, which is about average overall- the 2020 Acura TLX has a vehicle lifetime fatality chance of 0.0435% (almost 3x the safest). The site makes it hard to find the very worst car but near the bottom is the 2020 Hyundai Accent, which “has a vehicle lifetime fatality chance of 0.0744%”.

The lists could be better; the only list that includes all vehicle classes is restricted to only 2020 makes. Meanwhile when you search a car it ranks it only relative to cars in the same year, though you can make comparisons across years yourself using the quantitative “fatality chance” and “injury chance” measures. I’m not totally convinced of the ratings themselves, given how well many smaller sedans do. Their front page explains how taller cars are generally safer, but also lists the Mini Cooper as the #18 safest car of 2020 across all classes. But Real Safe Cars seems like the current best site to me (maybe I’m biased since one of its creators is an economics professor).

I hope these sites will address some of the weaknesses I identified here, though I’m not optimistic about most of them, because other than Real Safe Cars the “bad” decisions seem to be clearly driven by incentives like keeping car companies happy or SEO.

I also think there’s still room for another effort by economists or other quantitatively-skilled people to make another site. The underlying crash data is public and the statistical problems are not especially hard; I think a single economist could run the numbers in about the time it takes to write a typical economics paper (weeks to months for a 1st draft), and a decent website could be built off that quickly as well. You could probably make a decent amount of money off the site, though perhaps not if you do the right thing and publicly post all the data and code. Posting the data would make it easy for others to copy you and make their own sites. You could fight that with copyright, but given the huge public good aspect here and the lives at stake it might make more sense to get grant funding up front and then make the data and code totally public. A sane world would have done this already; NHTSA’s annual budget is over $1 billion, with $35 million of that going to research and analysis. I think any decent funder should be able to do at least as well as the sites above with under $200k, or anyone with good data chops could do it out of the goodness of their heart in a few months. I don’t have a few months right now but perhaps one of you could take this up or start applying for grants to do it.

For everyone who just wants to know about which cars are safe, for now I think Real Safe Cars is the best bet, though I’d also like to hear if you think I missed anything.

Does the Unemployment Rate Tell the Whole Story about the Labor Market?

The answer to that question is, of course, “no.” No one number can alone tell us the whole story, whether we are talking about the economy, health, education, population, or any other social statistic. But when you look at other measures of the health of the labor market, you usually find that they tell a similar story to the unemployment rate.

My goal in this post is to dive a little deeper into the data on the labor market, but really the goal is broader: to give you a little insight about how to interpret data. Some rules of thumb, perhaps. But really there is One Big Rule: numbers need context. A number on its own doesn’t tell us much of anything. How does it compare to the past? How does it compare to other places?

With the unemployment rate at historic lows for both the US and many states, I’ve started to see many people saying that, not only doesn’t the unemployment rate give us the full story, but many other indicators point in the opposite direction. Is this true? Let’s dig into the data. Here’s one example of someone saying this for Arkansas. I’ll focus on Arkansas, since that’s where I live and I pay attention to the economic data here pretty closely, but I’ll also refer to national data where appropriate.

Continue reading

Everyone Happy? Student Loan Repayment

I like a good lump sum tax. People *must* pay the tax without exception and the advantage over current progressive marginal income taxes is that the marginal wage received doesn’t fall with greater earnings. Employment rises and output rises. To the extent that college students fail to understand their student loans, the indebted graduates essentially pay a lump sum tax each period.

Of course, the exception is income based repayment (IBR) – especially with forgiveness after X years. IBR adjusts the incentives substantially. Under the standard system, your wages are garnished if you fail to make loan payments. Under IBR, lower earnings trigger lower monthly payments. Clearly, in contrast to the standard method, IBR incentivizes more leisure, less income, more black market activity, and higher loan balances. Indeed, all the more so if there is a forgiveness horizon. Someone just has to have low enough income for say 15 years, and their past debt is forgiven (with caveats & conditions).

My principal objection to IBR policy is the resulting malinvestment in human capital. Defaulting on loans is a sign that some investment was inadequately productive to repay the resources consumed by its endeavor. We call that a loss. Real resources of time, attention, and goods and services were consumed in order to produce capital that failed to serve others more than the opportunity cost of those resources.

Continue reading

US Stocks Are Expensive, These Countries Are Not

While we have stepped back from the meme stock craziness of 2021, US stocks remain quite expensive by historical standards, with our Cyclically Adjusted Price to Earnings (CAPE) ratio at almost twice its long-run average:

Source

Even at a high price, US stocks could still be worth it, and I certainly hold plenty. But I also think it it a good time to consider the alternatives. US Treasury bond yields are the highest they’ve been since 2007. But there are also many countries where stocks are dramatically cheaper than the US- and not just high-risk basket-cases, but stable “investable” countries.

There are several reasonable ways to measure what counts as “expensive” for stocks in addition to the CAPE ratio I mention above. The Idea Farm averages out four such measures to determine how expensive different “investable” (large, stable) country stock markets are. Here is their latest update:

MSCI Investable Market Indices:

Source: The Idea Farm Global Valuation Update

You can see that US stocks are expensive not only relative to our own history, but also relative to other countries, lagging only India and Denmark. That means that much of the world looks like a relative bargain, with the cheapest countries being Colombia, Poland, Chile, Czech Republic, and Brazil.

Of course, sometimes stocks, just like regular goods and services, are cheap for a reason: they just aren’t that good. They might be cheap because investors expect slow growth, or a recession, or political risk. But if you don’t share these expectations about a cheap stock (or country), that’s when to really take a look. I certainly did well buying Poland after I saw they were the cheapest in last year’s global valuation update and thought there was no good reason for them to stay that cheap.

I like that the chart above provides a simple ranking of investable markets. But if you wish it included more valuation measures, or small frontier markets, you can find that from Aswath Damodaran here. Some day I hope to provide a data-based, rather than vibes-based, analysis of which countries are “cheap/expensive for a reason” vs “cheap/expensive for no good reason”, featuring measures like industry composition, population growth, predictors of economic growth, and economic freedom. For now you just get my uninformed impression that Poland and Colombia seem like fine countries to me.

Disclosure: I’m long stocks or indices in several countries mentioned, including EPOL, FRDM, PBR.A, CIB, and SMIN. Not investment advice.

Continue reading

Manufacturing Compensation in the Long Run

You may have heard that there is a new viral song which deals with a few economic issues. Noah Smith has a good analysis of “Rich Men North of Richmond,” which he mostly finds to be incorrect in its analysis (for example, of welfare policy). But Smith does say that the song has a point: manufacturing wages haven’t performed well in recent years. Not only has pay for factory workers “[lagged] the national average in recent years,” for those workers in Virginia, it’s lower in real terms than in 2010.

Well that all doesn’t sound good! Smith is only going back to about 2000 with the data he shows. What if we took a longer run perspective? What if we took a really long-run perspecitive?

Here’s wages for blue-collar factor workers that goes back to 1939 in the US:

The wage data (for manufacturing production workers) is from BLS and the PCE price index is from the BEA. What do you notice as you look at the data?

First, it is true that the last 20 years or so hasn’t been great. Only about 8% cumulative growth since 2002. That’s not great!

But as you look back further, you’ll notice that gains are substantial. Compared to what some might consider the “golden age” of manufacturing wages, the early 1950s, real wages have roughly doubled. It’s true, the growth rate from 1939-1973 is much, much better than the following 50 years. Wouldn’t it be nice if that growth rate had continued! But no doubt you’ve seen many memes saying something like “in the 1950s you could support a family on one high-school graduate income, but not today!” This data suggests that view of the 1950s is a little distorted by nostalgia.

One final thing to note: we might think that one big change in recent decades is that a lot more compensation goes to benefits, rather than wages. There’s actually a total compensation series for blue-collar workers going all the way back to 1790:

The total compensation data, as well as the CPI data that I used to inflation-adjust the figures (to 2022 dollars), comes from the fantastic resource Measuring Worth. This is a total compensation measurement, so it includes benefits, but the source data tells us that up until the late 1930s, it’s really just a wage measure. So potentially we could splice this together with the above chart, to get a “wage only” series covering the entire history of the US.

However, when we look at total compensation, we still see the post-1970s stagnation. Real compensation is roughly the same as about 1977. Yikes! Note here that we’re using the CPI, since the PCE index only goes back to 1929, and the CPI tends to overstate inflation (yes, that’s right, sorry CPI truthers). Still, it’s not the most optimistic picture.

Or isn’t it? With all of the automation and global competition in manufacturing coming on board in the past 50 years, perhaps our baseline is that things could have been much worse. In any case, if we look at total compensation, it’s currently about double what it was in the post-WW2 era. That’s even with the dip in 2022 due to high CPI inflation.

Wages and compensation of blue-collar productions workers have indeed been growing slowly for the past few decades. That much is true. On the other hand, they are still among the highest they have ever been in history, over 50 times (not 50%, 50 times!) higher than at the birth of this nation. This ranks them as probably the highest wages anywhere in world history for an occupation that doesn’t require an advanced degree. That history is worth knowing.

New EG.5  Variant Spreading: Start of New Covid Surge?

The spread of highly-contagious and sometimes fatal Covid-19, and the responses to it (lockdowns and then trillions of dollars of federal giveaway money to mitigate the effects of the lockdowns and now huge interest rate hikes to counter the inflation caused by that giveaway money) have been arguably the most economically momentous events of this decade so far. Thus, it behooves us to keep an ongoing eye on this beast, since it seems to keep coming back in waves.

We all know that Covid is spread by little “aerosol”  droplets coming out the infected people’s mouths and noses. Those aerosols are mainly generated by speaking and singing. So being in a room full of talking or singing people (e.g., a happy convention or bar, or a hymn-singing church) can be a super-spreader situation.

I have reasons to try to avoid respiratory diseases, and so I attended church on-line or outdoors for most of the past three years. The Covid numbers finally got low enough this spring that I started attending inside, and even going unmasked the past two months.

Alas, Covid cases and hospitalizations are back on the rise, it seems due to the new Eris or EG.5 subvariant. Like the infamous omicron variant of a year ago, it is very transmissible and resistant to existing vaccines, but is not as deadly as the original strain. Much of the population has some immunity due to vaccines and/or prior exposure. Also, antivirals like Paxlovid are widely available to help mitigate symptoms. Still, a case of Covid often makes for an uncomfortable and disruptive  week or two, and can still be fatal or debilitating.

So, I have done a quick amateur scan of the internet, trying to get a fix on what to expect. One thing that stands out is that actual case numbers are far higher than officially reported, for a couple of reasons. One is that the rigorous, systematic reporting of cases has fallen off, since Covid was deemed no longer an emergency. Also, with the end of free test kits and the generally more lax public attitude (we just want to be done with this), there is far less testing done than in 2022. (In communities with systematic testing, it turns out that the best way to track Covid is by analyzing wastewater).

Will the Latest Vaccines Save Us?

The vaccine story seems somewhat mixed. The latest booster vaccine, to be available around October, will target the XBB.1.5 subvariant, which is what was mainly circulating earlier this year. However, it is expected that since EB.5 is closely related to XBB.1.5 (both of these are of the general omicron family), the booster will confer some immunity to EB.5. That is the good news.

The bad news is that the public’s uptake of boosters in general is well under 50%, so we may expect EB.5 or whatever the next subvariant is to continue to circulate, and probably surge during the colder months when respiratory diseases tend to spread. Also, vaccines do not really stop you from getting Covid, they mainly act to mitigate the symptoms by helping your body’s defenses to react faster.

Starting next week, I will resume wearing an effective KN-95 or my preferred KF-94 mask at church and other venues where a lot of people are talking or singing.