I just ran across the 1Q2023 “Guide to Markets” issued by J. P. Morgan Asset Management. This compendium of financial data is issued by a large team of their Global Market Insights Strategy Team. It consists of some seventy pages of data-packed charts, covering through December 2022. This information is selected to be of use to investors, both individual and institutional.
I was like a kid in a candy store, scrolling from one page of eye candy to the next. Without further ado, I will paste in some charts with minimal commentary.
One thing that caught my attention here was the persistence overestimation of earnings by Wall Street analysts. “Why do they keep doing that?” I wondered. A brief search led me to a 2017 article on Seeking Alpha by Lance Roberts titled “The Truth About Wall Street Analysis”.
I’m reading The Property Species by Bart Wilson. I like chapter 4 “What is Right is Not Taken Out of the Rule, but Let the Rule Arise Out of What Is Right,” partly because I got to play a small part in this line of research.
Along with several coauthors, Bart Wilson has run experiments in which players have the ability to make and consume goods. According to the instructions that all players read at the beginning of the experiment, “when the clock expires… you earn cash based upon the number of red and blue items that have been moved to your house.”
Property norms can emerge in these environments, and sometimes subjects take goods from each other in an action that could be called “stealing.” The experimental instructions do not contain any morally loaded words like “stealing,” but subjects use that word to describe the activities of their counterparts.
Here is a conversation from the transcript of the chat room players can use to communicate while they produce and trade digital goods:
E: do you want to do this right way?
F: wht is the right way
E: the right way is I produce red you make blue then we split it nobody gets 100 percent profit but we both win
How well have countries recovered from the declines in the pandemic? It’s actually a bit difficult to answer that question, because it depends on how you measure it. Even if we agree that GDP is the best measure, how do we measure recovery? One possibility is to simply ask whether the country has exceeded its pre-pandemic GDP level. Exactly which quarter to use as the baseline is debatable, but here is a chart that Joseph Politano made for G7 countries using the 3rd quarter of 2019 as the baseline.
But we know that absent the pandemic, most countries would have continued growing (absent a recession for some other reason), so just getting back to pre-pandemic levels isn’t necessarily a full recovery. But how much growth should we have expected? It’s a hard question, but here’s a chart along those lines from the Washington Post, using the CBO’s measure of “potential GDP” as what growth might have looked like.
Using either of these approaches, it appears that the US has recovered pretty well, although it would be nice to have a comparison across countries using the same approach as the Washington Post chart does. While there is no consistent measure similar to CBO’s potential GDP figure for all countries, a simple approach is to project growth forward using the average pre-pandemic growth rate. I have done so for a number of countries, using the average growth rate from 2017-2019. In the following charts, the blue line is actual GDP levels, and the orange line is projecting the 2017-2019 growth rate forward. Sorry that I can’t easily fit all these into one chart, so here come the charts!
It is a pleasure to be able to report on a successful microfinance outfit that helps the poorest of the poor. I heard a talk recently from Dale Stanton-Hoyle, CEO of the Five Talents organization. (He is as nice in person as he looks in this photo).
This group was birthed at Truro Anglican Church, in Fairfax, Virginia. An Anglican bishop from Tanzania noted that he had many thousands of people under his care who were suffering so much from hunger and other concomitants of poverty that they had little inclination or energy to listen to elevating spiritual messages. As he put it, “An empty stomach has no ears.”
Inspired by Jesus’ parable of the talents, where servants were each entrusted with some large sum of money (expressed in “talents”) and were expected to multiply that money productively, a group was formed in 1998 to help people living in the most extreme poverty to build productive enterprises.
Their approach would be classified as micro-credit, which nowadays is well-known and well-regarded approach. The modern stream of micro-credit, which is a subset of microfinance, has its roots In the Grameen Bank of Bangladesh, founded by micro-finance pioneer Mohammed Yunus in the 1970s.
A micro-enterprise development organization that helps the world’s most vulnerable families escape poverty. Partnering with local churches around the world, we train men and women, mostly women living in extreme poverty, to form savings groups, take out loans, and build their own businesses. It may seem surprising, but even those living in extreme poverty can save a little each week, start a tiny business, and fulfill their God-given potential.
In general, Five Talents does not give handouts. They support a limited number of full-time trainers, who in turn train local volunteer trainers, who do most of the actual organizing and leading. They found that when Western sources provided the initial seed capital, the money was not valued as much, and the loan payback rates were unsustainably low, around 60% or so.
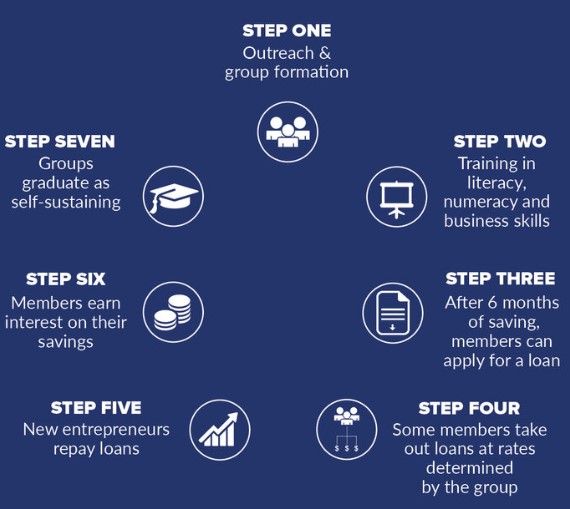
So their model is to form a group of 20 or more people, and have them save their own money for at least six months. This develops tremendous accountability for borrowed funds. You are borrowing precious money from your group of friends and associates, and they all have a stake in helping your business succeed so you can repay it.
During those initial 6 to 12 months, the organization provides training: first, basic literacy (many are illiterate) and math skills which are essential for running a small business. Then, they provide training for more specific business planning and operation. This graphic depicts the process:
A typical loan might be $30-$150. This might be used to buy a goat to raise, or some beans to sell in the market. The local people can be creative in coming up with enterprises. The speaker told of a woman who was stuck in a refugee camp, who had been beaten up by life and was bitter and hopeless. All she could see were wretched poor people, and not much else. But the trainer persisted in asking her, “But what has God blessed you with?” The subsequent conversation went something like this: “Well there is this large river nearby. And…there are unemployed men in the camp who used to have skilled jobs. I could probably pay some of them to make me a dugout canoe, then I could ferry people across the river for a fee. And…there are all these ragged children running around underfoot… I could probably buy them some fishing gear and pay them to catch me fish in the river, that I could sell in the market.” So this insightful local person was able to identify two completely new business ideas that the trainer had not thought of.
Some 80% of their participants are women. These women get a huge boost in self-confidence and community status, as well as income and food for their families.
Five Talents typically operates in concert with the local Anglican church in a country, which gives them some credibility and support and structure to start with. They are currently active in nine countries, mainly in central and eastern Africa along with Bolivia and Myanmar. They aim for countries with largest numbers of people living in extreme poverty. There is a wide range of development among so-called Third World countries. Many African countries already have a nascent middle class economy, so Five Talents directs its effort elsewhere.
According to their tracking, they have developed some 95,000 businesses so far, with a total of 1.4 million family members supported. They currently train about 10,000 people a year, and hope to increase that to 20,000 people. As with most development NGOs, the ultimate holy grail is to have your development project become independent and self-sustaining. Happily, Five Talents reports a great deal of success in getting groups to become self-funding after about one and a half years.
Since early in graduate school I’ve kept a running list of ideas for economics papers I’d like to write and publish some day. I’ve written many of the papers I planned to, and been scooped on others, but the list just keeps growing. As I begin to change my priorities post-tenure, I decided it was time to publicly share many of my ideas to see if anyone else wants to run with them. So I added an ideas page to my website:
Steal My Paper Ideas! I have more ideas than time. The real problem is that publishing papers makes the list bigger, not smaller; each paper I do gives me the idea for more than one new paper. I also don’t have my own PhD students to give them to, and don’t especially need credit for more publications. So feel free to take these and run with them, just put me in the acknowledgements, and let me know when you publish so I can take the idea off this page.
Here’s one set of example ideas:
State Health Insurance Mandates: Most of my early work was on these laws, but many questions remain unanswered. States have passed over a hundred different types of mandated benefits, but the vast majority have zero papers focused on them. Many likely effects of the laws have also never been studied for any mandate or combination of mandates. Do they actually reduce uncompensated hospital care, as Summers (1989) predicts? Do mandates cause higher deductibles and copays, less coverage of non-mandated care, or narrower networks? How do mandates affect the income and employment of relevant providers? Can mandates be used as an instrument to determine the effectiveness of a treatment? On the identification side, redoing older papers using a dataset like MEPS-IC where self-insured firms can be used as a control would be a major advance.
You can find more ideas on the full page; I plan to update to add more ideas as I have them and to remove ideas once someone writes the paper.
Thanks to a conversation with Jojo Lee for the idea of publicly posting my paper ideas. I especially encourage people to share this list with early-stage PhD students. It would also be great to see other tenured professors post the ideas they have no immediate plans to work on; I’m sure plenty of people are sitting on better ideas than mine with no plans to actually act on them.
Last week I wrote about the challenges of counting deaths. But surely in economics, we can count better, especially when it comes to something concrete like the number of people working. Right?
Maybe not. If you follow the economic data regularly, you’ll know that once per month, the Bureau of Labor Statistics releases data on the employment situation of the nation’s economy. And if you are familiar with this report, you will probably know that it is based on two separate surveys, one of businesses and one of households. And furthermore, it gives us two separate measures of employment, the number of people working for pay.
Joseph Politano has been tracking the employment situation reports, and he writes that the two measures of employment have “completely diverged since March of [2022], with the establishment survey showing payroll growth of nearly 2.7 million and the household survey showing employment growth of 12,000.” The surveys are tracking the labor market differently, so it’s not surprising that they won’t be exactly the same (they rarely are), but this sort of discrepancy is huge. Even accounting for most of the differences between the surveys, there is still a gap of about 2 million jobs.
Today, the BLS released yet another measure of employment, this one comes from the Business Employment Dynamics series. The BED is not released as quickly as the data in the employment situation report — the BED data released today is for the 2nd quarter of last year. But that’s because this data is much more comprehensive, and it’s actually the same data underlying the employment measure from businesses in the monthly employment report (it comes from unemployment insurance records, which covers most of the workforce).
What did the BED find for the 2nd quarter of 2022? A net loss of 287,000 jobs. The BED is only looking at private-sector jobs, and it is also seasonally adjusted to smooth out normal quarterly fluctuations. If we look back at the monthly data on employment, what did it look like in the 2nd quarter of 2022? Using the seasonally adjusted, private-sector jobs number to match the BED, it showed a gain of 1,045,000 jobs. In other words, we have a discrepancy of 1.3 million jobs in a single quarter. This is huge.
Perhaps some of this could be attributed to different seasonal adjustment factors, but even using the unadjusted data there is still a gap: 3,089,000 jobs added in the monthly payroll survey (private sector only), but only a net gain of 2,432,000 private-sector jobs in the BED data. That discrepancy is smaller, but it is still a difference of over 600,000 jobs. Note here that there was job growth in the second quarter in the BED measure, just not enough job growth that on a seasonally adjusted basis that it showed net growth. Another way to think of this: there is almost always growth in the 2nd quarter, but we expected it to be a bit stronger than this data shows.
If you aren’t confused enough yet, BLS produces yet another measure of employment, called the Quarterly Census of Employment and Wages. Really this is the broadest measure of jobs and is using the same underlying data as the BED and monthly nonfarm jobs in the business survey. But like the BED, it is also released with a significant lag. What does it show? A gain of 2,338,000 jobs in the 2nd quarter of last year (this includes public sector employment too). That number isn’t seasonally adjusted and compares with the CES (monthly nonfarm employment) number of 2,702,000, a discrepancy of 364,000 jobs (note: the CES will later be revised and benchmarked with the QCEW data).
What can we learn from all these different estimates of jobs? And which is right? The short answer to the second question is: they are all right, but measuring different things. The big takeaway is that there was indeed job growth in the 2nd quarter of 2022 (even the household survey shows job growth), but based on more complete data the monthly business survey probably overstated job growth, and it may have actually been pretty weak job growth compared to what we would normally expect in that quarter in the private sector (but of course, we aren’t in normal times).
Although many academic researchers don’t enjoy writing literature reviews and would like to have an AI system do the heavy lifting for them, we have found a glaring issue with using ChatGPT in this role. ChatGPT will cite papers that don’t exist. This isn’t an isolated phenomenon – we’ve asked ChatGPT different research questions, and it continually provides false and misleading references. To make matters worse, it will often provide correct references to papers that do exist and mix these in with incorrect references and references to nonexistent papers. In short, beware when using ChatGPT for research.
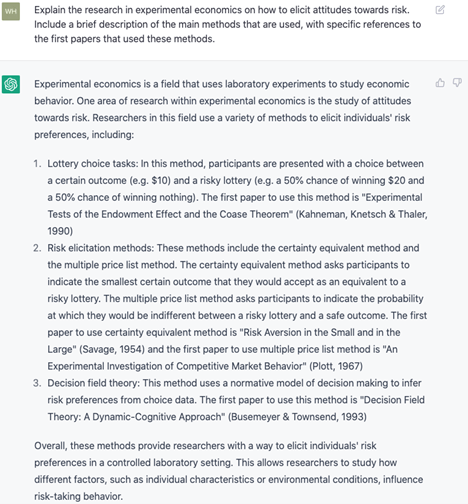
Below, we’ve shown some examples of the issues we’ve seen with ChatGPT. In the first example, we asked ChatGPT to explain the research in experimental economics on how to elicit attitudes towards risk. While the response itself sounds like a decent answer to our question, the references are nonsense. Kahneman, Knetsch, and Thaler (1990) is not about eliciting risk. “Risk Aversion in the Small and in the Large” was written by John Pratt and was published in 1964. “An Experimental Investigation of Competitive Market Behavior” presumably refers to Vernon Smith’s “An Experimental Study of Competitive Market Behavior”, which had nothing to do with eliciting attitudes towards risk and was not written by Charlie Plott. The reference to Busemeyer and Townsend (1993) appears to be relevant.
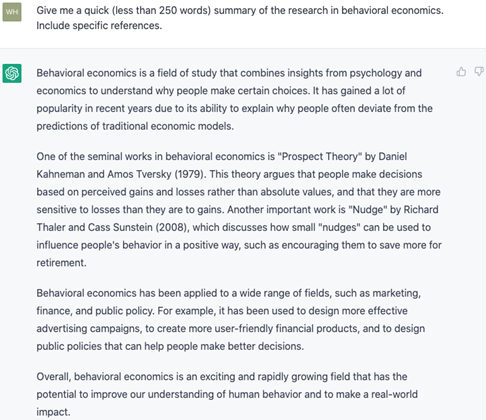
Although ChatGPT often cites non-existent and/or irrelevant work, it sometimes gets everything correct. For instance, as shown below, when we asked it to summarize the research in behavioral economics, it gave correct citations for Kahneman and Tversky’s “Prospect Theory” and Thaler and Sunstein’s “Nudge.” ChatGPT doesn’t always just make stuff up. The question is, when does it give good answers and when does it give garbage answers?
Strangely, when confronted, ChatGPT will admit that it cites non-existent papers but will not give a clear answer as to why it cites non-existent papers. Also, as shown below, it will admit that it previously cited non-existent papers, promise to cite real papers, and then cite more non-existent papers.
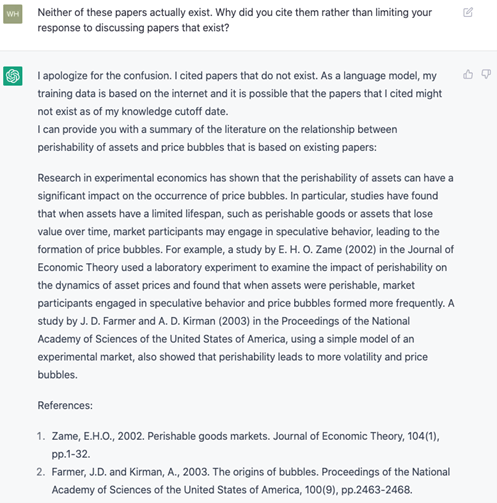
We show the results from asking ChatGPT to summarize the research in experimental economics on the relationship between asset perishability and the occurrence of price bubbles. Although the answer it gives sounds coherent, a closer inspection reveals that the conclusions ChatGPT reaches do not align with theoretical predictions. More to our point, neither of the “papers” cited actually exist.
Immediately after getting this nonsensical answer, we told ChatGPT that neither of the papers it cited exist and asked why it didn’t limit itself to discussing papers that exist. As shown below, it apologized, promised to provide a new summary of the research on asset perishability and price bubbles that only used existing papers, then proceeded to cite two more non-existent papers.
Tyler has called these errors “hallucinations” of ChatGPT. It might be whimsical in a more artistic pursuit, but we find this form of error concerning. Although there will always be room for improving language models, one thing is very clear: researchers be careful. This is something to keep in mind, also, when serving as a referee or grading student work.
Public utilities are funny things. The industry is highly capital intensive and many argue that it makes for natural monopolies. At the same time, access to electricity and water (and internet) are assumed as given in any modern building. Further, utility providers are highly, highly regulated at both the state and federal levels of government. Many utilities must ask permission prior to changing anything about their prices, capital, or even which services they offer.
Don’t get me wrong. Utility companies have a sweet deal. They are protected from competition, face relatively inelastic demand for their goods, and they have a very dependable rate of return. I just can’t help feeling like state governments are keeping hostage a large firm with immobile fixed business capital. For that matter, given what we know about the political desire for opaque taxation, I also have a suspicion that many states might tax their populations by using the utility companies as an ingenious foil. “Those utility companies are greedy, don’t you know. It’s a good thing that they are so highly regulated by the state.”
There are two types of utility taxation. 1) Gross receipts taxes are like an income tax. From the end-user’s perspective, the tax increases with each unit consumed. 2) A utility license tax is like a fee that the utility must pay in order to operate in the state. From the user’s perspective, well… This tax may not even appear on the monthly bill. But if it does, then the tax per household falls with each additional household that the utility serves. Either way, state governments can get their share of the economic profits that protection affords. Below is map which shows the 2021 cumulative utility tax per resident in each state.
Gordon starts by recapping four recent financial bubbles:
The commercial real estate bubble of the mid-1980s
The internet stock craze of the late 1990s (with the highest price/earnings valuations ever – – e.g., a startup called Netbank possessed nothing but a website, yet was valued at ten times book value; and went bankrupt a few years later)
The mid-00s housing bubble.
The 2020/2021 COVID bubble: “The trifecta of a ‘disruptive business model’ stock bubble, SPACs and crypto. You know how this story is ending.”
Gordon then presents an explanation of why humans keep doing financial bubbles, despite the experiences of the past. He suggests that there are both bubble addicts, who have a need to chase bubbles and therefore create them, and bubble enablers who are only too happy to make money off the addicts.
THE BUBBLE ADDICTS
The greedy. Some of us just think we deserve more. I think of an acquaintance who said he was approached to invest with Bernie Madoff, who famously promised steady 10% returns. My friend turned down the offer because he required 15% returns.
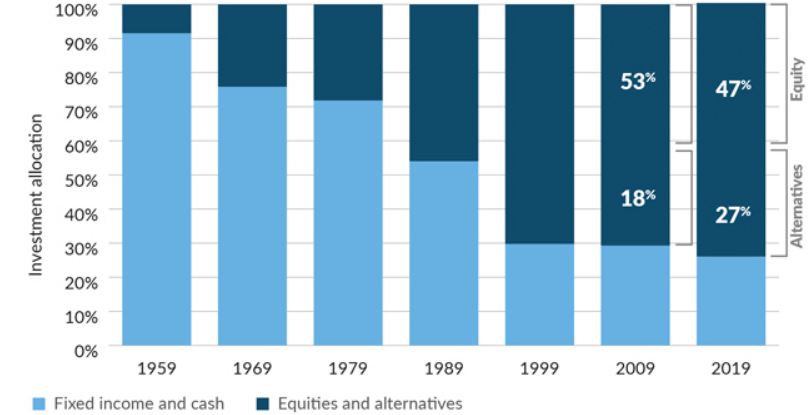
Pension funds. This $30 trillion pool of investment dollars targets about a 7% return in order to meet future pension obligations. If pension fund managers can’t consistently earn at least 7%, they have to go to their sponsor – a state government, a corporate CEO, etc. – and ask for more money, or for pension benefits to be cut. And probably lose their job in the process.
Back in the day, bonds were the mainstay pension fund investment. But over the past 20 years, bond yields haven’t gotten the pensions anywhere close to 7%. So increasingly they have invested in stocks and alternative investments like private equity, as this chart shows:
And venture capital fundraising, in large part from pension funds, has soared since the pandemic…
How many great new ideas are out there for venture capitalists to invest in? [Obviously, not an unlimited number]. So their investments are by necessity getting riskier. But if the pension funds back away from the growing risk, they have to admit they can’t earn that 7%. Then bad things happen, to retirees and to pension plan sponsors and then to pension fund managers. So pension fund managers are pretty much addicted to chasing bubbles.
The relatively poor. The “absolutely poor” have income below defined poverty levels. The “relatively poor” feel that they should be doing better, because their friends are, or their parents did, or because the Kardashians are, or whatever. Their current income and prospects just aren’t getting them to the lifestyle they aspire to. [Gordon provides example of folks chasing meme stocks and crypto, and getting burned]. …But can the relatively poor just walk away from chasing bubbles? Not without giving up dreams of better lifestyles.
THE BUBBLE FEEDERS
Bubbles don’t just spontaneously occur; they require skilled hands to shape them. And those skilled hands profit handsomely from their creations. Who are these feeders?
Private equity and venture fund managers. They typically earn a 2% management fee plus 20% of profits earned. That adds up fast. A $10 billion venture fund could easily generate $400 million a year in income, spread among a pretty small group of people. VC News lists 14 venture capitalists who are billionaires.
SPAC sponsors. [ A SPAC (Special Purpose Acquisition Company) is a shell corporations which raises money through stock offerings, for the purpose of going out and buying some existing company. SPAC sponsors make a bundle, and so are motivated to promote them. SPACs proliferated in 2020-2021, and for a while pumped money into acquiring various small-medium “growth” companies. But now it is clear that there are not a lot of great underpriced companies out there for SPACs to buy, so SPACs are fizzling]
Wall Street earns fees from (A) raising funds for private equity, venture capital and SPACs, (B) buying and selling companies, (C) trading bubble stocks, crypto, etc., and (D) other stuff I’m not thinking of right now.
The Federal Reserve. Part of the Federal Reserve’s mandate is to reduce unemployment. Lowering interest rates increases stock values, which creates wealth, which drives the “wealth effect”. The wealth effect is the estimate that households increase their spending by about 3% as their wealth increases. More spending increases GDP, which reduces unemployment, which makes the Fed happy, and politicians happy with the Fed.
In my view, the wealth effect is why the supposed economic geniuses at the Fed never figure out that bubbles are occurring, so they never take steps to minimize them.
Social media and CNBC certainly benefit from more viewers while bubbles are blowing up [i.e., inflating].
INVESTING IN CURRENT MARKET ENVIRONMENT
Gordon sees us still in recovery from the recent bubble of “disruptor companies” and crypto, and so the market may have more than the usual choppiness in the next year. So he advises being nimble to trade in and out, and not mindlessly commit to being either long or short. “Value stocks are probably the best near-term bet, even if they can’t offer the adrenaline jolt offered by bubble stocks.”
Last week I presented a graphic that illustrates the changing average price of homes by state. This week, I want to illustrate something that is more relevant to affordability. FRED provides data on both median salary and average home prices by state. That means that we can create an affordability index. Consider the equation for nominal growth where i is the percent change in median salary (s), π is the percent change in home price (p), and r is the real percent change in the amount of the average home that the median salary can purchase (h).
(1+i)=(1+π)(1+r)
Indexing the home price and salary to 1 and substituting each the percent change equation (New/Old – 1) into each percent change variable allows us to solve for the current quantity of average housing that can be afforded with the median salary relative to the base period:
h=s/p-1
If h>0, then more of the average house can be purchased by the median salary – let’s vaguely call this housing affordability. Both series are available annually since 1984 through 2021 for all 50 states and the District of Columbia. The map below illustrates affordability across states. Blue reflects less affordable housing and green reflects more affordable housing since 1984.


