I have sourdough starter in my fridge and have tried making two rounds of bread. I write this as a civilian, for others who will never elevate baking above a hobby.
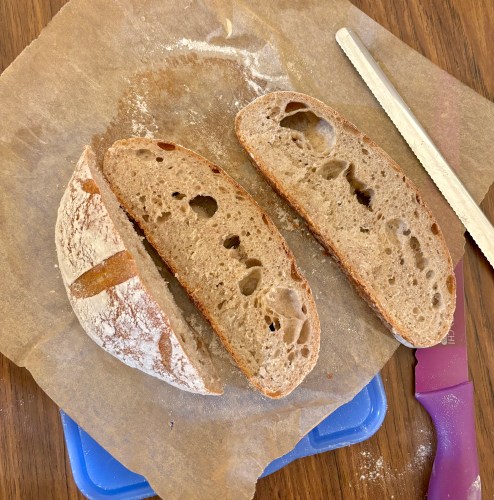
I will begin with a picture of my first bread:
That’s not very fluffy but not terrible. It was real bread to go with butter or soup. My neighbor’s starter was in great condition when she gave it to me, and I followed the standard recipe. I use 80% bread flour and 20% whole wheat flour to make it healthier.
Below I will speculate on whether sourdough projects are a good use of time or not. Call it home economics.
This will be a longer-than-usual post, since I will try to include all the steps I used to grow salad ingredients in a compact (AeroGarden-type) hydroponics system. I hope this encourages readers to try this for themselves. See my previous post for an introduction to the hardware, including small modifications I made to it. I used a less-expensive ($45), reliable 18-hole MUGFA model here, but all the AeroGardens and its many knockoffs should work similarly. Most plant roots need access to oxygen as well as to water; these hydroponic units allow the upper few inches of the root to sit in a (moist) “grow sponge” up out of the water to help with aerobic metabolism.
Step 1. Unbox the hydroponics unit, set up per instructions near a power outlet. Fill tank close to upper volume marking.
Step 2. Add nutrients to the water in the tank: usually there are two small plastic bottles, one with nutrient mix “A” and the other with nutrient mix “B”, initially as dry granules. Add water to the fill lines of each of these bottles with the granules, shake till dissolved. (You can’t mix the A and B solutions directly together without dilution, because some components would precipitate out as solids. So, you must add first one solution, then the other, to the large amount of water in the tank.)
There is more than one way to do this. I pulled the deck off the tank, used a large measuring cup to get water from my sink into the tank, a little below the full line. For say 5 liters of water, I add about 25 ml of nutrient Solution A, stir well, then add 25 ml of Solution B and stir. You could also keep the deck on, have the circulation pump running, and slowly pour the nutrient solutions in through the fill hole (frontmost center hole in the deck). You don’t have to be precise on amounts.
Step 3. Put the plastic baskets (sponge supports) in their holes in the deck, and put the conical porous planting sponges/plugs in the baskets. Let the sponges soak up water and swell. (This pre-wetting may not be necessary; it just worked for me).
Step 4. Plant the seeds: Each sponge has a narrow hole in its top. You need to get your seed down to the bottom of the hole. I pulled one moist sponge out at a time and propped it upright in a little holder on a table where I could work on it. I used the end of plastic bread tie to pick up seeds from a little plate and poke them down to the bottom of the hole. You have to make a judgment call how many seeds to plant in each hole. Lettuce seeds are large and pretty reliable, so I used two lettuce seeds for each lettuce sponge. Same for arugula (turns out that it was better to NOT pre-soak the arugula seeds, contrary to popular wisdom). If both seeds sprout, it’s OK to have two lettuce plants per hole, though you may not get much more production than from one plant per hole. For parsley*, where I wanted 2-3 plants per hole, I used three seeds each. For the tiny thyme seeds, I used about 5 seeds, figuring I could thin if they all came up. For cilantro, I used two pre-soaked seeds. I really wanted chives, but they are hard to sprout in these hydroponics units. I used five chive seeds each in two holes, but they never really sprouted, so I ended up planting something else in their holes.
I chose all fairly low-growing plants, no basil or tomatoes. Larger plants such as micro-dwarf tomatoes can be grown in these hydroponics units; also basil, though need to aggressively keep cutting it back. It may be best to choose all low or all high plants for a given grow campaign. See this Reddit thread for more discussion of growing things in a MUGFA unit.
Once all the plugs are back in their holders, you stick a light-blocking sticker on top of each basket. Each sticker has a hole in the middle where the plants can grow up through, but they block most of the light from hitting the grow sponge, to prevent algae growth. Then pop a clear plastic seeding cover dome on top of each hole, and you are done. The cover domes keep the seeds extra moist for sprouting; remove the domes after sprouting. Make sure the circulation pump is running and the grow lights are on (typically cycling on 16 hours/off 8 hours). This seems like a lot of work describing it here, but it goes fast once you have the rhythm. Once this setup stage is done, you can just sit back and let everything unfold, no muss, no fuss. Here is the seeded, covered state of affairs:
Picture: Seeds placed in grow sponges on Jan 14. Note green light-blocking stickers, and clear cover domes to keep seeds moist for germination. The overhead sunlamp has a lot of blue and red LEDs (which the plants use for photosynthesis), which gives all these photos a purple cast.
Jan 28 (Two weeks after planting): seedlings. Note some unused holes are covered, to keep light out of the nutrient solution in the tank. The center hole in front is used for refilling the tank.
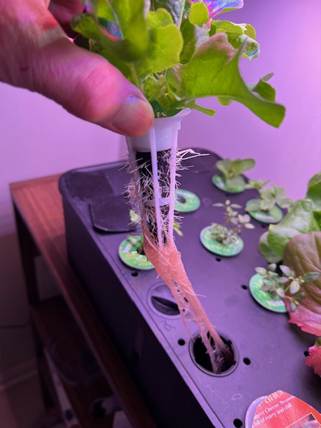
Feb 6. Showing roots of an arugula plant, 23 days after planting.
Step 5. Maintenance during 2-4 month grow cycle. Monitor water level via viewing port in front. Top up as needed. Add nutrients as you add water (approx. 5 ml of Solution A and 5 ml Solution B, per liter of added water). The water will not go down very fast during the first month, but once plants get established, water will likely be needed every 5-10 days. If you keep trimming outside leaves every several days, you can get away with having densely planted greens, whereas if you only harvest say every two weeks, the plants get so big they would crowd each other if you plant in every hole on the deck.
Optional: Supposedly it helps to keep the acidity (pH) of the nutrient solution in the range of 5.5-6.5. I think most users don’t bother checking this, since the nutrient solutions are buffered to try to keep pH in balance. Being a retired chemical engineer, I got this General Hydroponics kit for measuring and adjusting pH. On several occasions, the pH in the tank was about 6.5. That was probably perfectly fine, but I went ahead and added about 1/8 teaspoon of the pH lowering solution, to bring it down to about 6.0. I also got a meter for measuring Electrical Conductivity/Total Dissolved Solids to monitor that parameter, but it was not necessary.
Feb 16: After a month, some greens are ready to snip the outer leaves. Lettuces (buttercrunch, red oak, romaine) on the right, herbs on the left.
~~~~~~~~~~~~~~~~~~~~~~~~~~~~~~~~~~~~~~~~~~~
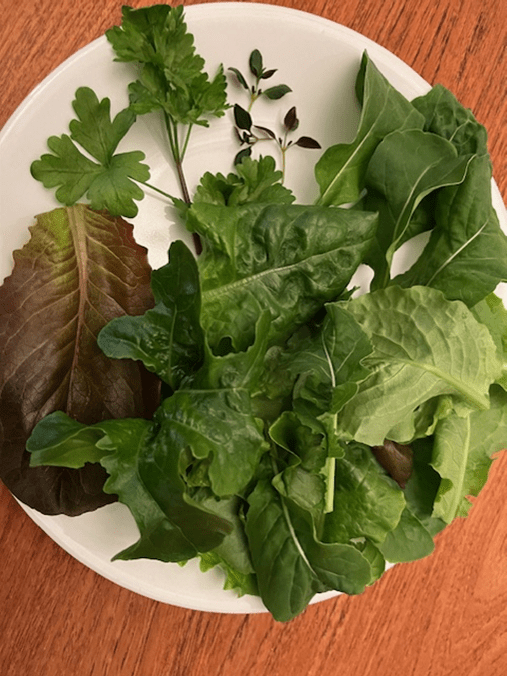
Feb 17: Harvesting a small salad or sandwich filler every 2-3 days now.
March 6: Full sized, regular small harvests. All the lettuces worked great, buttercrunch is especially soft and sweet. Arugula (from the mustard plant family) gave a spicy edge. Italian parsley and thyme added flavor. The cilantro was slower growing, and only gave a few sprigs total.
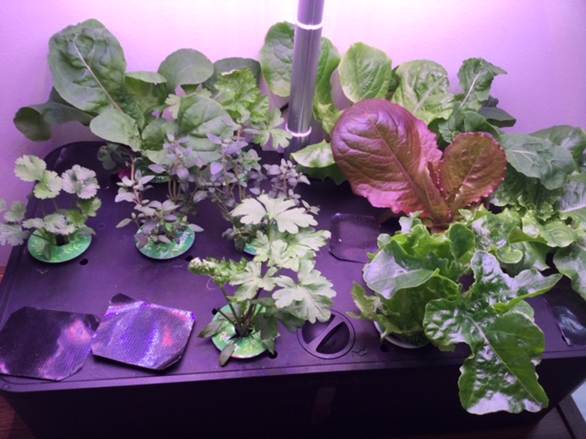
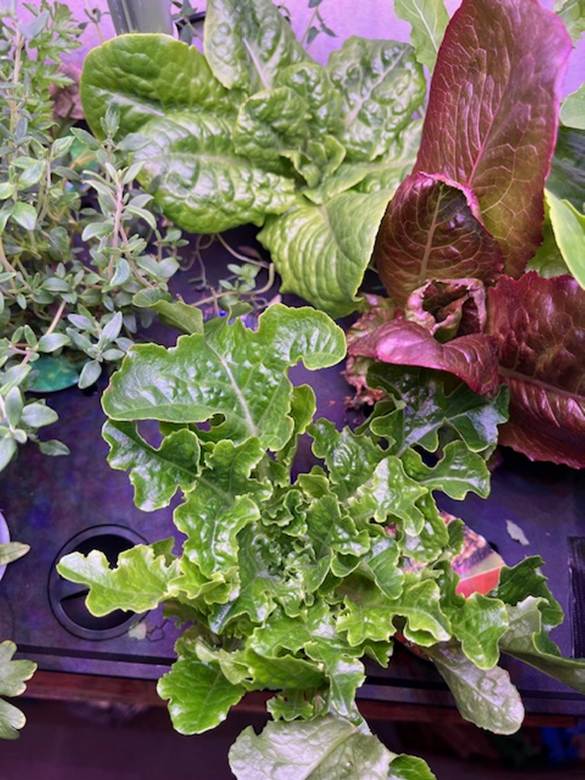
Closeup March 16 (three months), just before closing out the grow cycle. Arugula foreground, lettuce top and right, thyme on left, Italian parsley upper left corner.
Step 6. Close out grow cycle. At some point, typically 2-4 months, it is time to bring a grow cycle to a close. I suppose with something like dwarf tomatoes, you could keep going longer, though you might need to pull the deck up and trim the roots periodically. In my case, after three months, the arugula and cilantro were starting to bolt, though the lettuce, thyme, and parsley were still going strong. As of mid-March, my focus turned to outside planting, so I harvested all the remaining crops on the MUGFA, turned off the power, and gently pulled the deck off the tank. The whole space under the deck was a tangled mass of roots. I used kitchen shears to cut roots loose, enough to pull all the grow sponges and baskets out. The sponges got discarded, and the baskets saved for next time. I peeled off and saved the round green light-blocking stickers for re-use. I cleared all the rootlets from the filter sponge on the pump inlet. Then I washed out the tank per instructions. It took maybe 45 minutes for all this clean-out, to leave the unit ready for a next round of growing.
Stay tuned for a future blog post on growing watercress, which went really well this past fall. Looking to the future: In Jan 2026 I plan to do a replant of this 18-hole (blocked down to 14-holes) MUGFA device, sowing less lettuce (since we buy that anyway) but more arugula/Italian parsley/thyme for nutritious flavorings. For replacement nutrients and grow sponges, I got a Haligo hydroponics kit like this (about $12).
Growing these salad/sandwich ingredients in the kitchen under a built-in sunlamp provided good cheer and a bit of healthy food during the dark winter months. The clean hydroponic setup removed concerns about insect pests or under/overwatering. It was a hobby; at this toy scale it did not “save money”, though from these learnings I could probably rig a larger homemade hydroponics setup which might reduce grocery costs. This exercise led to fun conversations with visitors and children, and was a reminder that nearly everything we eat comes from water, nutrients, and light, directly or indirectly.
*Pro tips on germinating parsley seeds – – Parsley seeds have a tough coating, and can take weeks to germinate. Some techniques to speed things up:
( 1 ) Lightly abrade the seeds by gently rubbing between sheets of sandpaper.
( 2 ) Soak in warmish water for 24-48 hours.
( 3 ) For older seeds, cold stratification (1–2 weeks in a damp paper towel in the fridge) may help break dormancy.
Last year about this time, as the outside world got darker and colder, and the greenery in my outdoor planters shriveled to brown – – I resolved to fight back against seasonal affect disorder, by growing some lettuce and herbs indoors under a sun lamp.
After doing some reading and thinking, I settled on getting a countertop hydroponics unit, instead of rigging a lamp over pots filled with dirt indoors. With a compact hydroponics unit there is no dirt, no bugs, it has built-in well-designed sun lamp on a timer, and is more or less self-watering.
These systems have a water tank that you fill with water and some soluble nutrients. There is a pump in the tank that circulates the water. There is a deck over the tank with typically 8 to 12 holes that are around 1 inch diameter. Into each hole you put a conical plug or sponge made of compressed peat moss, supported by a plastic basket. On the top of each sponge is a little hole, into which you place the seeds you want to grow.
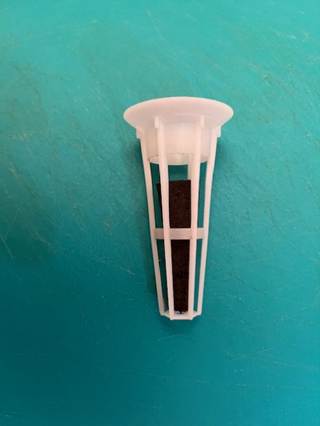
A support basket with a dry (unwetted, unswollen) peat moss grow sponge/plug in it.
As long as you keep the unit plugged in, so the lights go on when they should, and you keep the nutrients solution topped up, you have a tidy automatic garden on a table or countertop or shelf.
The premier countertop hydroponics brand, which has defined this genre over the past twenty years, is Aerogarden. This brand is expensive. Historically its larger models were $200-$300, though with competition its larger models are now just under $200. Aerogarden tries to justify the high cost by sleek styling and customizable automation of the lighting cycles, linked into your cell phone.
I decided to go with a cheaper brand, for two reasons. First, why spend $200 when I could get similar function for $50 (especially if I wasn’t sure I would like hydroponics)? Second, I don’t want the bother and possible malfunction associated with having to link an app on my cell phone to the growing device and program it. I wanted something simple and stupid that just turns on and goes.
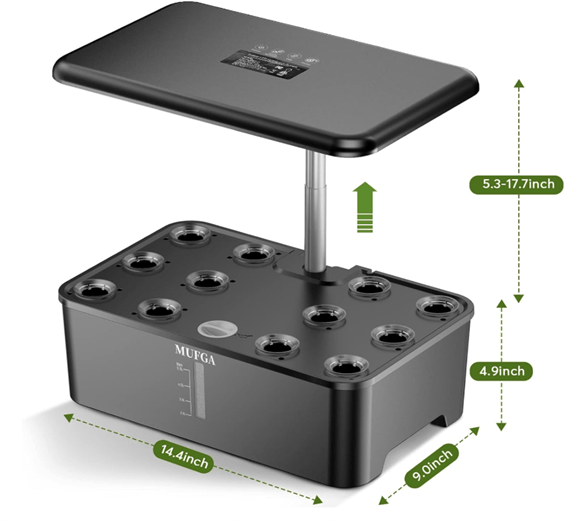
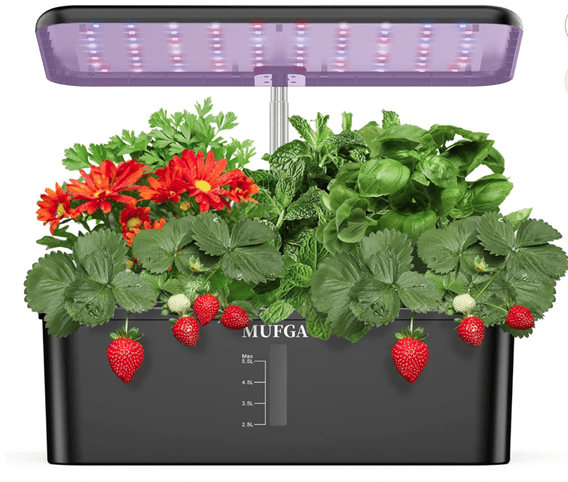
So I went with a MUGFA brand 18-hole hydroponics unit last winter. It is simple and robust. The LED growing lights are distributed along the underside of a wide top lamp piece. The lamp has a lot of vertical travel (14“), so you could accommodate relatively tall plants. The lights have a simple cycle of 16 hours on, 8 hours off. You can reset by turning the power off and on again; I do this once, early on some morning, so from then on the lights are on during the day and the evening, and off at night. The water pump pumps the nutrient solution through channels on the underside of the deck, so each grow sponge has a little dribble of solution dribbling onto it when the pump cycle is on. I snagged a second MUGFA unit, a 12 hole model, when it was on sale last spring. The MUGFA units come complete with grow sponges/plugs, support baskets/baskets for the sponges, nutrients (that you add to the water), clear plastic domes you put over the deck holes while the seeds are germinating, and little support sticks for taller plants. You have to buy seeds separately.
I have made a couple small modifications to my MUGFA units. The pump is not really sized for reaching 18 holes, and with plants of any size you’re likely not going be stuffing 18 plants on that grow deck. Also, the power of the lamp for the 18-hole unit (24 W) is the same as the 12-hole unit; the LEDs are just spread over a wider lamp area. That 24W is OK for greens that don’t need so much light, but may only be enough to grow a few (mini) tomato plants. For all these reasons, I don’t use the four corner holes on the 18-hole unit. Those corner holes get the least light and the least water flow. To increase the water flow to the other 14 holes, I plugged up the outlets of the channels on the underside of the deck leading to those four holes. I cut little pieces of rubber sheeting, and stuffed them in channel outlets for those holes.
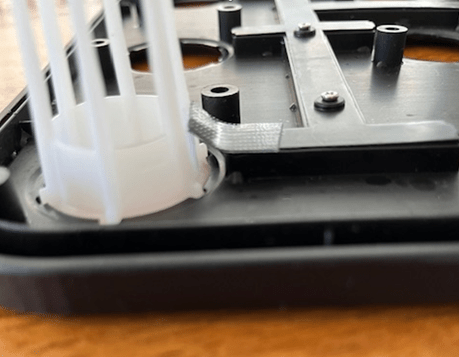
The 12-hole unit has a slightly more pleasing compact form factor, but it has a minor design defect [1]. The flow out of the outlet of each of the 12 channels under the deck is regular, but not very strong. Consequently, the water that comes out of each outlet drops almost straight down and splashes directly into the water tank, without contacting the grow sponge at that hole. The waterfall noise was annoying. The fix was easy, but a little tedious to implement. I cut little pieces of black strong duct tape and stuck them under the outlet of each hole, to make the water travel another quarter inch further horizontally. Those little tabs got the water in contact with the grow sponge basket. The picture below shows the deck upside down, showing the water channels under the deck going to each hole. There is a white sponge basket sticking through the nearest hole, and my custom piece of black duct tape is on the end of the water channel there, touching the basket. (In order to cover the exposed sticky side of the duct tape tab that would be left exposed and touching the basket, I cut another, smaller piece of duct tape to cover that portion of the tab, sticky side to sticky side.). This sounds complicated, but it is straightforward if you ever do it. Also, many cheap knock-off hydroponics units don’t have these under-deck flow channels at all. With MUGFA you are getting nearly Aerogarden type hardware for a third the price, so it is worth a bit of duct tape to bring it up to optimal performance.
12-hole MUGFA deck, upside down with one basket; showing my bit of black duct tape to convey water from the channer over to the basket.
Some light escapes out sideways from under the horizontal lamps on these units. As an efficiency freak, I taped little aluminum foil reflectors hanging down from the back and sides of the lamp piece, but that is not necessary.
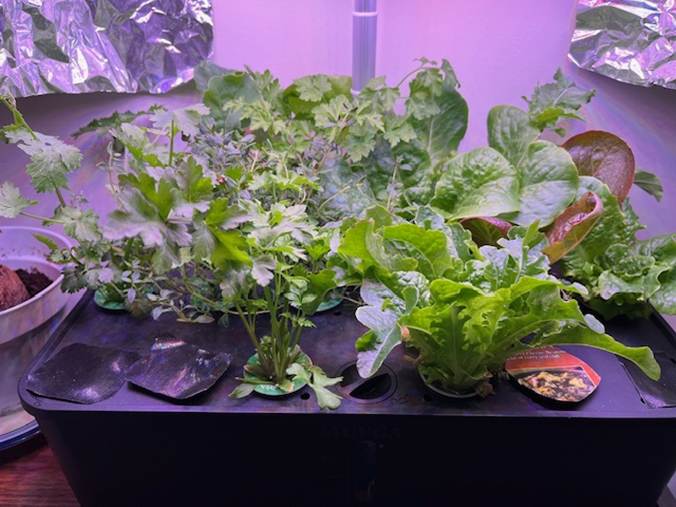
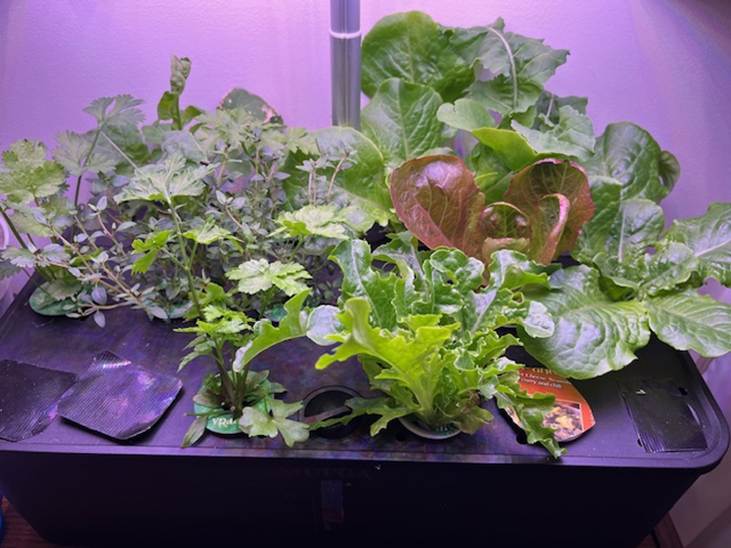
To keep this post short, I have just talked about the hardware here. I will describe actual plant growing in my next post. But here is one picture of my kitchen garden last winter, with the plants about 2/3 of their final sizes:
The bottom line is, I’ve been quite satisfied with both of these MUGFA units, and would recommend them to others. They provided good cheer in the dark of winter, as well as good conversations with visitors and good fresh lettuce and herbs. An alternate use of these types of hydroponics units is to start seedlings for an outside garden.
ENDNOTE
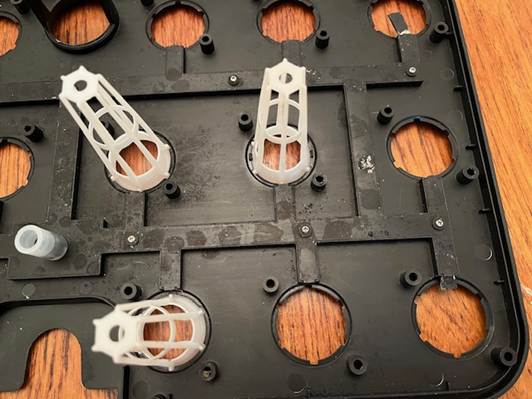
[1] For the hopelessly detail-obsessed technical nerds among us – – the specific design mistake in the 12-hole model is subtle. I’ll explain a little more here. Here is a picture of the deck for the 18-hole model upside down, with three empty baskets inserted. The network of flow channels for the water circulation is visible on the underside. When the deck is in place on the tank, water is pumped into the short whitish tube at the left of this picture, flows into the channels, then out the ends of all the channels. (Note on the corner holes here, upper and lower right, I stuck little pieces of rubber into the ends of the flow channels to block them off since I don’t use the corner holes on this model; that blocking was not really necessary, it was just an engineering optimization by a technical nerd).
Anyway, the key point is this: the way the baskets are oriented in the 18-hole model here, a rib of the basket faces the outlet of each flow channel. The result is that as soon as the water exits the flow channel, it immediately contacts a rib of the basket and flows down the basket and wets the grow sponge/plug within the basket. All good.
The design mistake with the 12-hole model is that the baskets are oriented such that the flow channels terminate between the ribs. The water does not squirt far enough horizontally to contact the non-rib part of basket or the sponge, so the water just drips down and splashes into the tank without wetting the sponge. This is not catastrophic, since the sponges are normally wetted just by sitting in the water in the tank, but it is not optimal. All because of a 15-degree error in radial orientation of the little rib notches in the deck. Who knows, maybe Mugfa will send me a free beta test improved 12-hole model if I point this out to them.
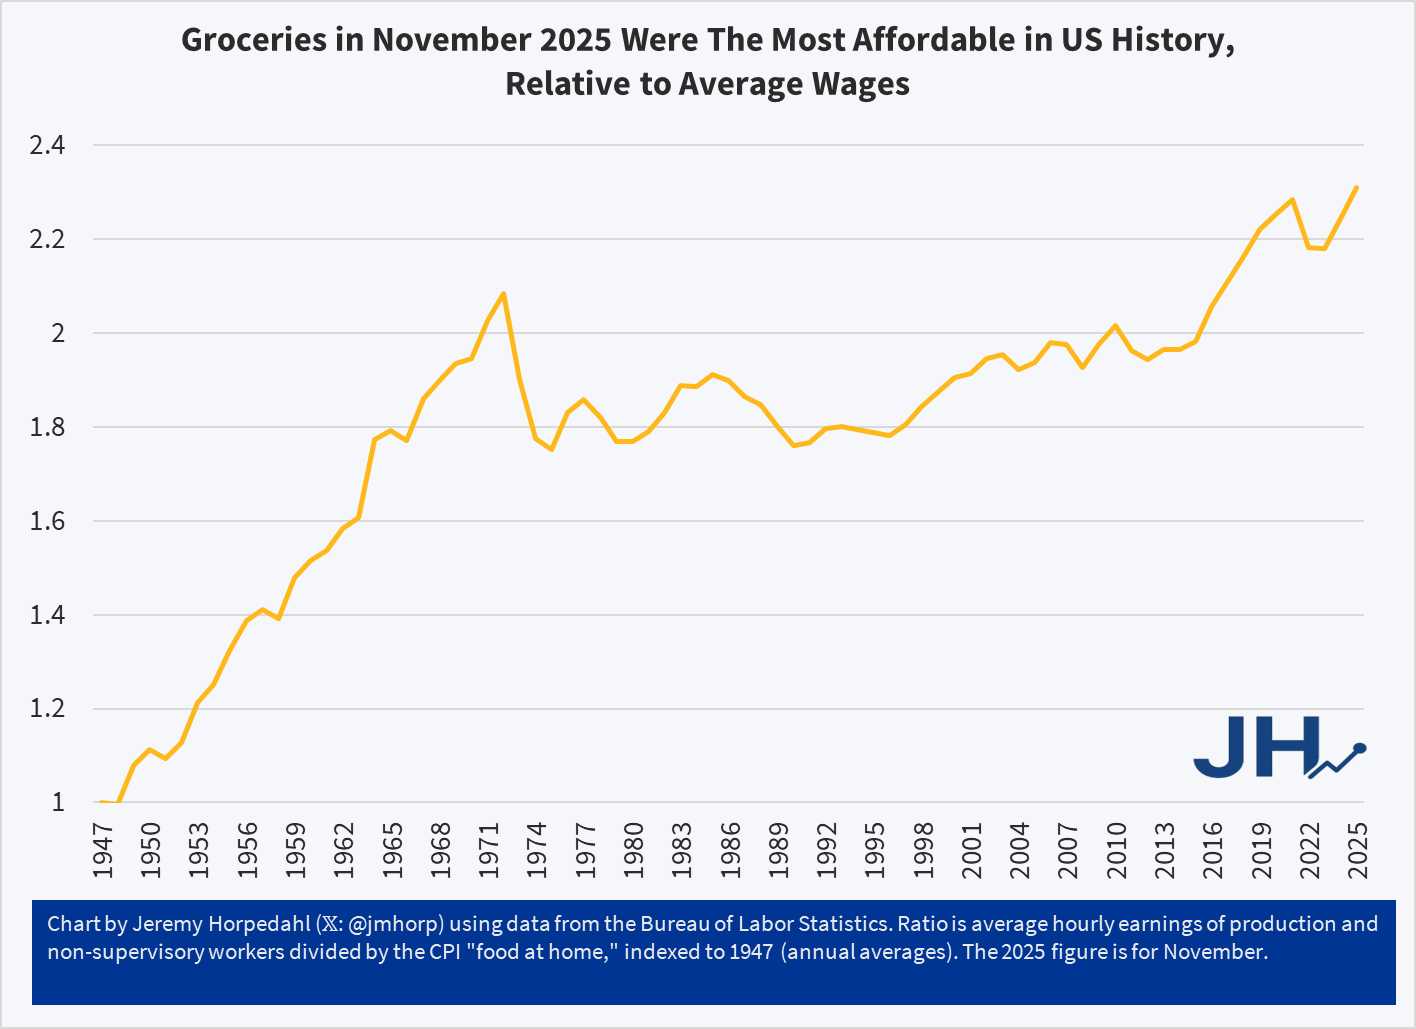
The chart shows a simple measure of relative grocery affordability. Starting with the levels of wages and grocery prices in 1947, if in any year wages increase more than prices, the line goes up (it can also go down, as it does in some years). Cumulatively, you can see that today groceries are over twice as affordable as in 1947.
You could reasonably complain that there hasn’t been much progress since the early 1970s. Fair enough. But there has been significant progress since the 1990s. Even if the progress is less than we would have liked, groceries are still, right now, the most affordable they have ever been in the US relative to average wages. And since US consumers spend by far the lowest share of their income on groceries in the world, we might be tempted to say that right now groceries in the US are the most affordable they have ever been in human history. Period.
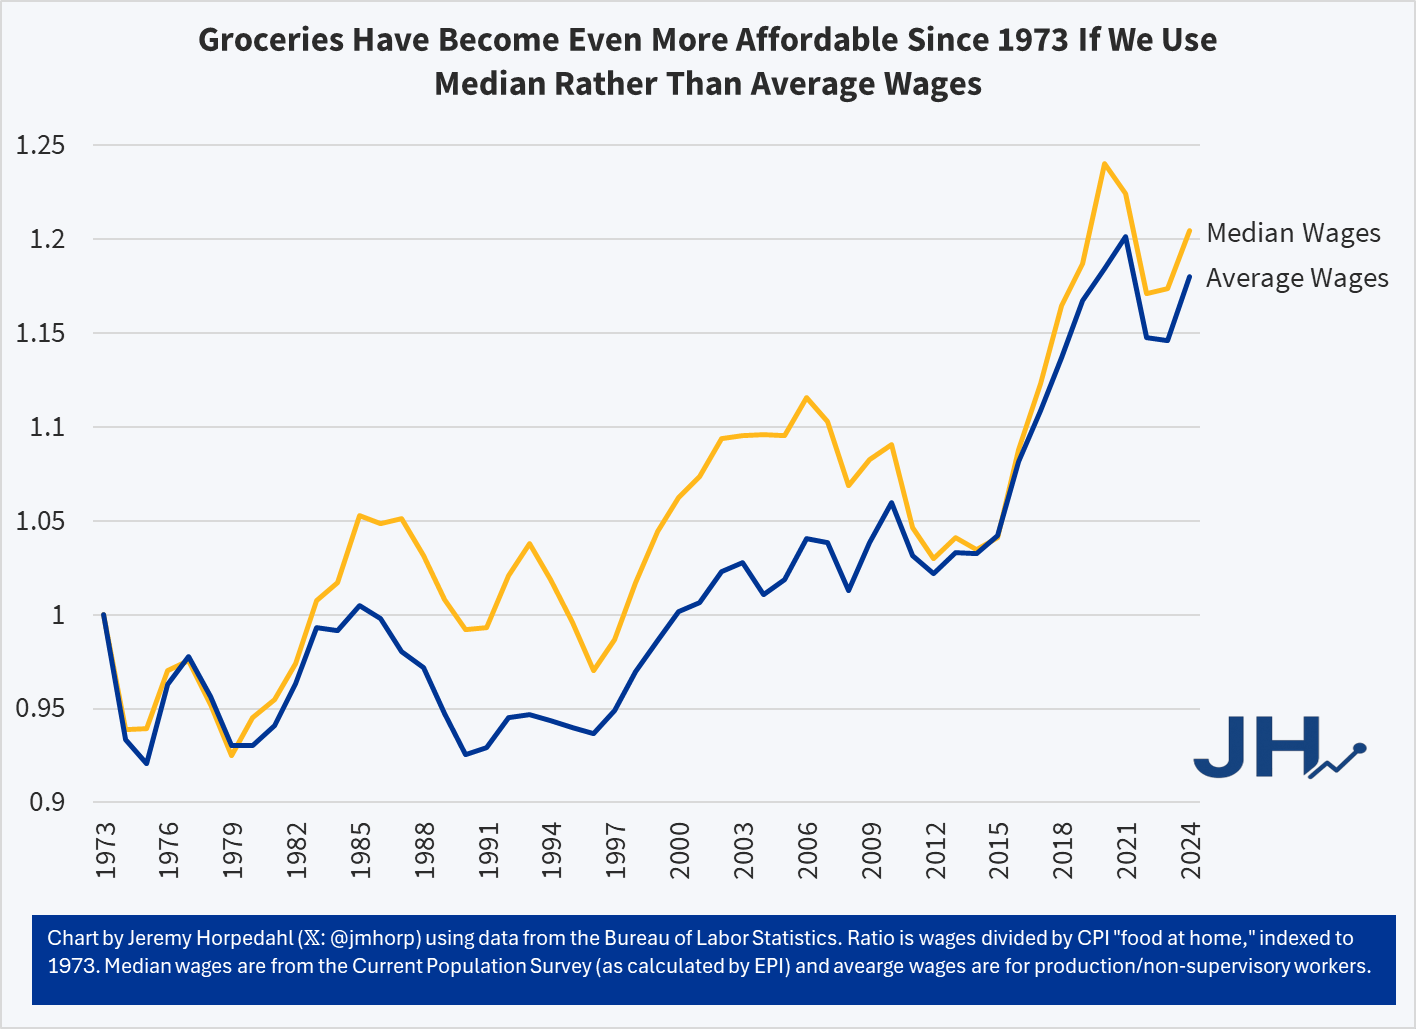
This is not just a trick of using average wages, which can be distorted by outliers. First, we are already using an average wage series that strips out the highest earners (supervisors, managers, etc.). But we can show this more clearly by using a median-wage series, such as the CPS series (calculated by EPI) starting in 1973. Notice this affordability trend gets slightly better if we use median wages from 1973-2024:
It’s true that using the median wage series, 2020 and 2021 look more affordable than 2024 — but that’s because the compositional effects of the job losses in the pandemic really throw off the median wage. But the growth rate since 1973 is slightly better for median rather than average wages — it’s not a trick! And when we have the median wage data for 2025, it will also likely be the most affordable measure on this chart.
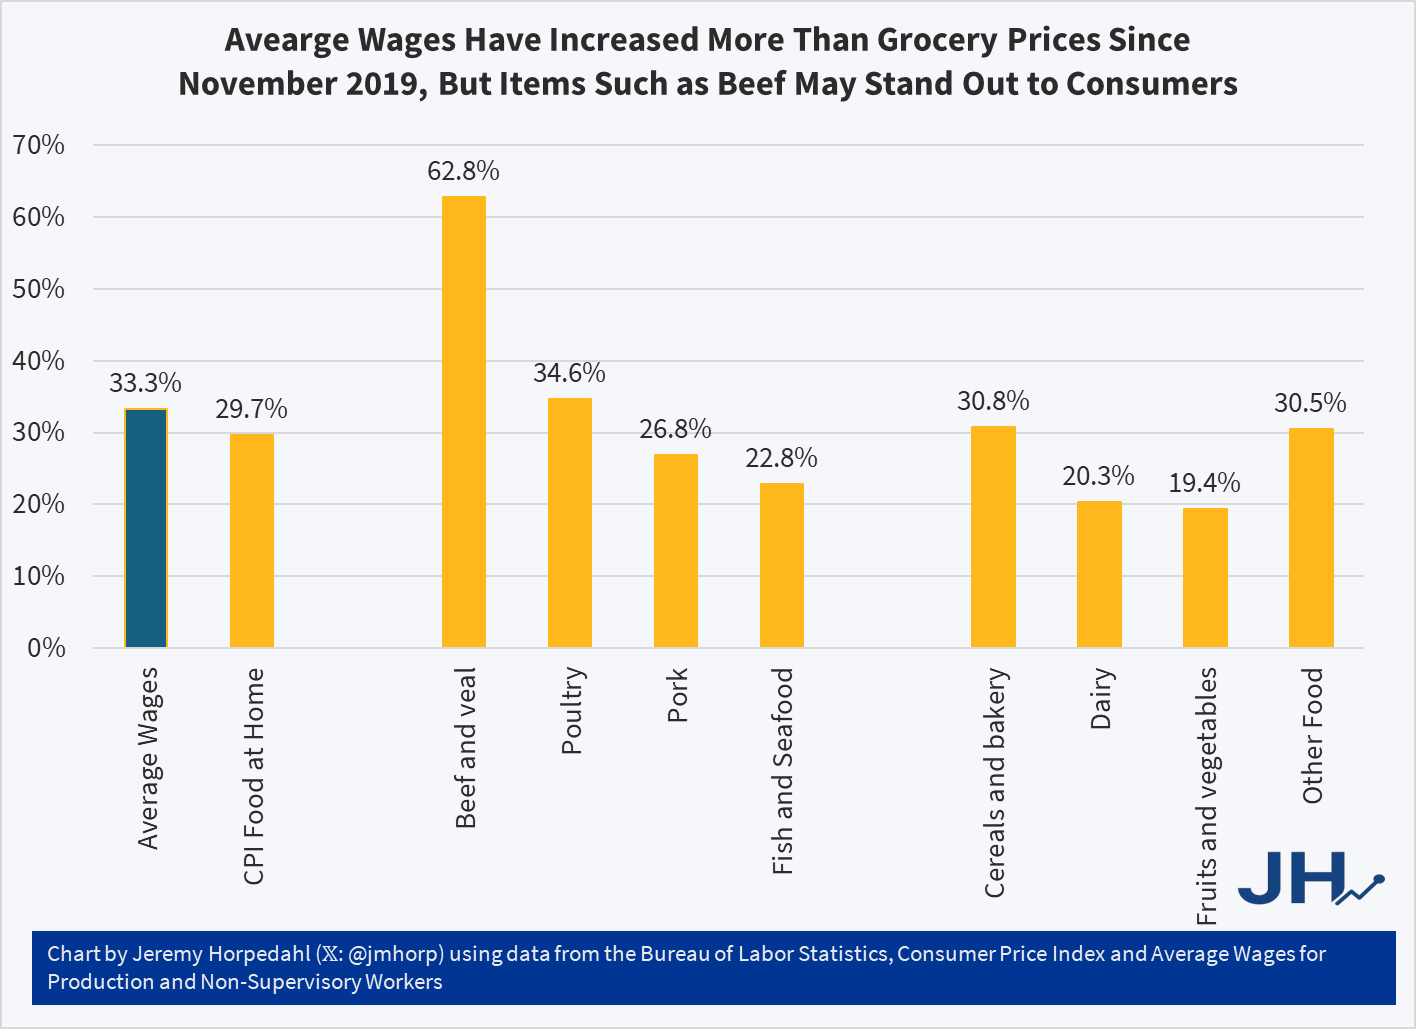
So why are people so pessimistic if wages have been rising faster than grocery prices? One theory: availability bias. People focus on the prices where they notice goods becoming less affordable, but ignore the ones that are more affordable. Many consumers could probably tell you that a dozen eggs increased from $1.40 per dozen in November 2019 to $2.86 today, and at times was much higher, topping $6 briefly in early 2025. Likewise they could tell you that a pound of ground beef soared from $3.81 in late 2019 to $6.54 today. Both of these prices increases vastly exceed wage increases over the same timeframe (about 33 percent for wages), but most consumers probably couldn’t tell you that these were outliers and most major categories of food increased by less than average wages since late 2019:
While the “beef and veal” category has clearly outpaced wages — by almost twice as much! — nearly every other category of meat and as well as other food product prices increased less than wages. Poultry is the one exception, though here it is almost equal to wage increases. But if we are talking about pork or fish, or the non-meat categories, most food is more affordable than in late 2019 relative to wages. Consumers won’t as easily identify these more affordable categories, and they probably have no idea how much average wages increased.
One of the likely effects of the federal government shutdown is that recipients of SNAP benefits (what used to be officially called “food stamps,” a term still used by the general public, especially those that dislike the program) may lose their benefits next month. This would obviously be a hardship for those that depend on this program, but it has also led to bad claims being made about the program, from both supporters and opponents of the program.
Let’s start from the political right: Matt Walsh makes the claim that by subsidizing food consumption “obviously drives up the cost” of groceries.
The number one thing that artificially inflates the price of groceries is the food stamp program. The federal government is subsidizing groceries for 40 million people which obviously drives up the cost. That's why the increase in the cost of groceries tracks exactly with the…
As with all bad claims, there is a nugget of truth baked into them. If the government subsidizes anything, we would expect demand to increase, and thus unless supply is perfectly elastic, there will be some effect on prices. However, we need to think more carefully about the nature of the subsidy.
The way SNAP works is that beneficiaries receive an electronic voucher to spend at the grocery store, which is about $300 per month on average for a household. That $300 must be spent on groceries. However, if that household had already planned to spend $300 or more on groceries, it is unlikely they will spend all of the additional $300 on food. In the limit, it’s entirely possible they will spend no additional money on groceries, merely reducing their out-of-pocket spending on groceries by $300. They will then effectively have $300 more to spend on other goods. More likely is that they will spend some of the additional $300 on groceries, and some of it on other goods.
Many studies have tried to look at the extent to which SNAP benefits affect household spending, but these were mostly observational studies. There was no treatment and control group. But a 2009 paper titled “Consumption Responses to In-Kind Transfers: Evidence from the Introduction of the Food Stamp Program” has a better approach to studying the question. Since the original Food Stamp program was slowly rolled out across the country over more than a decade, you can compare counties that entered the program first to counties that entered it later. By doing so, Hilary Hoynes and Diane Schanzenbach find out some first interesting things about the causal effects of SNAP benefits.
For the claim by Walsh in his Tweet, the most relevant result from the paper is that food stamps impact household spending similarly to a cash transfer. Yes, the program increases household spending on groceries, but it also increases spending on other goods and services. And it does so almost identically to how cash transfers impact household spending. In other words, while pitching the program as assistance for buying groceries may make it more politically palatable, SNAP benefits are no different from a similarly-sized cash transfer for the average recipient. If they do cause any inflation, they do so in the same way as a cash transfer would, and thus there is no specific impact on food inflation.
A second bad claim about SNAP comes from the political left, in this case Minnesota Governor Tim Walz:
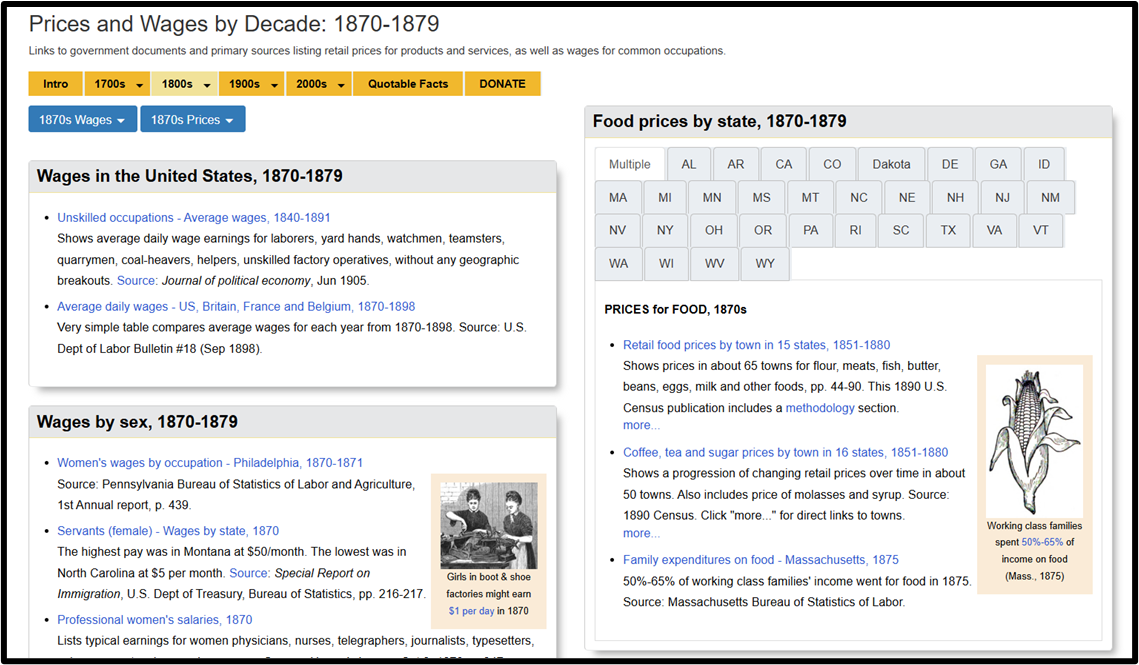
Today I’m just sharing a truly awe-inspiring resource. The University of Missouri has what is essentially a central clearinghouse for prices and wages. If you want the price of anything, then they should be your first stop.
See the screenshot at the bottom. The website links to the original sources for household consumption prices, occupation wages, etc. They make it easy to cut the data by date, industry, location, etc. Because they cite their sources, you can see some data series that are not even available on FRED – without having to perform the painful sleuthing on a government website.
I especially like this site for its historical data. One of the challenges of historical US data is that individual cities may not have prices that are representative of the national levels or trends. Lower levels of market integration make representative samples even more important than in modern data. But really, that was more of a concern for 20th century researchers. Now, we love our panel data. So, the historically less integrated markets of the US provide ‘toy economies’ that include greater regionalism and local shocks.
Although David Jacks has loads of tabulated data, he doesn’t have it all. The Missouri library site links to PDFs of original statistical publications which, while digitized, have never been tabulated into useable data fit for modern researchers.
Academics generally agree on the changing patterns of mortality over time. Centuries ago, people died of many things. Most of those deaths were among children and they were often related to water-borne illness. A lot of that was resolved with sanitation infrastructure and water treatment. Then, communicable diseases were next. Vaccines, mostly introduced in the first half of the 20th century, prevented a lot of deaths.
Similarly, food borne illness killed a lot of people before refrigeration was popular. The milkman would deliver milk to a hatch on the side of your house and swap out the empty glass bottles with new ones full of milk. For clarity, it was not a refrigerated cavity. It was just a hole in the wall with a door on both the inside and outside of the house. A lot of babies died from drinking spoiled milk.
Now, in higher income countries, we die of things that kill old people. These include cancer, falls that lead to infections, and the various diseases related to obesity. We’re able to die of these things because we won the battles against the big threats to children.
What prompts such a dreary topic?
I was perusing the 1870 Census schedules and I stumbled upon some ‘Schedule 2s’. Most of us are familiar with schedule 1, which asks details about the residents living in a household. But schedule 2 asked about the deaths in the household over the past year. Below is a scan from St. Paul, Minnesota.
My new article, “Prohibition and Percolation: The Roaring Success of Coffee During US Alcohol Prohibition”, is now published in Southern Economic Journal. It’s the first statistical analysis of coffee imports and salience during prohibition. Other authors had speculated that coffee substituted alcohol after the 18th amendment, but I did the work of running the stats, creating indices, and checking for robustness.
My contributions include:
National and state indices for coffee and coffee shops from major and local newspapers.
A textual index of the same from book mentions.
I uncover that prohibition is when modern coffee shops became popular.
The surge in coffee imports was likely not related to trade policy or the end of World War I
Both demand for coffee and supply increased as part of an intentional industry effort to replace alcohol and saloons.
An easy to follow application of time series structural break tests.
An easy to follow application of a modern differences in differences method for state dry laws and coffee newspaper mentions.
Evidence from a variety of sources including patents, newspapers, trade data, Ngrams, naval conflicts, & Wholesale prices.
Generally, the empirical evidence and the main theory is straightforward. I learned several new empirical methods for this paper and the economic logic in the robustness section was a blast to puzzle-out. Finally, it was an easy article to be excited about since people are generally passionate about their coffee.
Bartsch, Zachary. 2025. “Prohibition and Percolation: The Roaring Success of Coffee During US Alcohol Prohibition.” Southern Economic Journal, ahead of print, September 22. https://doi.org/10.1002/soej.12794.
Two ideas coalesced to contribute to this post. First, for years in my Principles of Macroeconomics course I’ve taught that we no longer have mass starvation events due to A) Flexible prices & B) Access to international trade. Second, my thinking and taxonomy here has been refined by the work of Michael Munger on capitalism as a distinct concept from other pre-requisite social institutions.
Munger distinguishes between trade, markets, and capitalism. Trade could be barter or include other narrow sets of familiar trading partners, such as neighbors and bloodlines. Markets additionally include impersonal trade. That is, a set of norms and even legal institutions emerge concerning commercial transactions that permit dependably buying and selling with strangers. Finally, capitalism includes both of these prerequisites in addition to the ability to raise funds by selling partial stakes in firms – or shares.
This last feature’s importance is due to the fact that debt or bond financing can’t fund very large and innovative endeavors because the upside to lenders is too small. That is, bonds are best for capital intensive projects that have a dependable rates of return that, hopefully, exceed the cost of borrowing. Selling shares of ownership in a company lets a diverse set of smaller stakeholders enjoy the upside of a speculative project. Importantly, speculative projects are innovative. They’re not always successful, but they are innovative in a way that bond and debt financing can’t satisfy. Selling equity shares open untapped capital markets.
With this refined taxonomy, I can better specify that it’s not access to international trade that is necessary to consistently prevent mass starvation. It’s access to international markets. For clarity, below is a 2×2 matrix that identifies which features characterize the presence of either flexible prices or access to international markets.