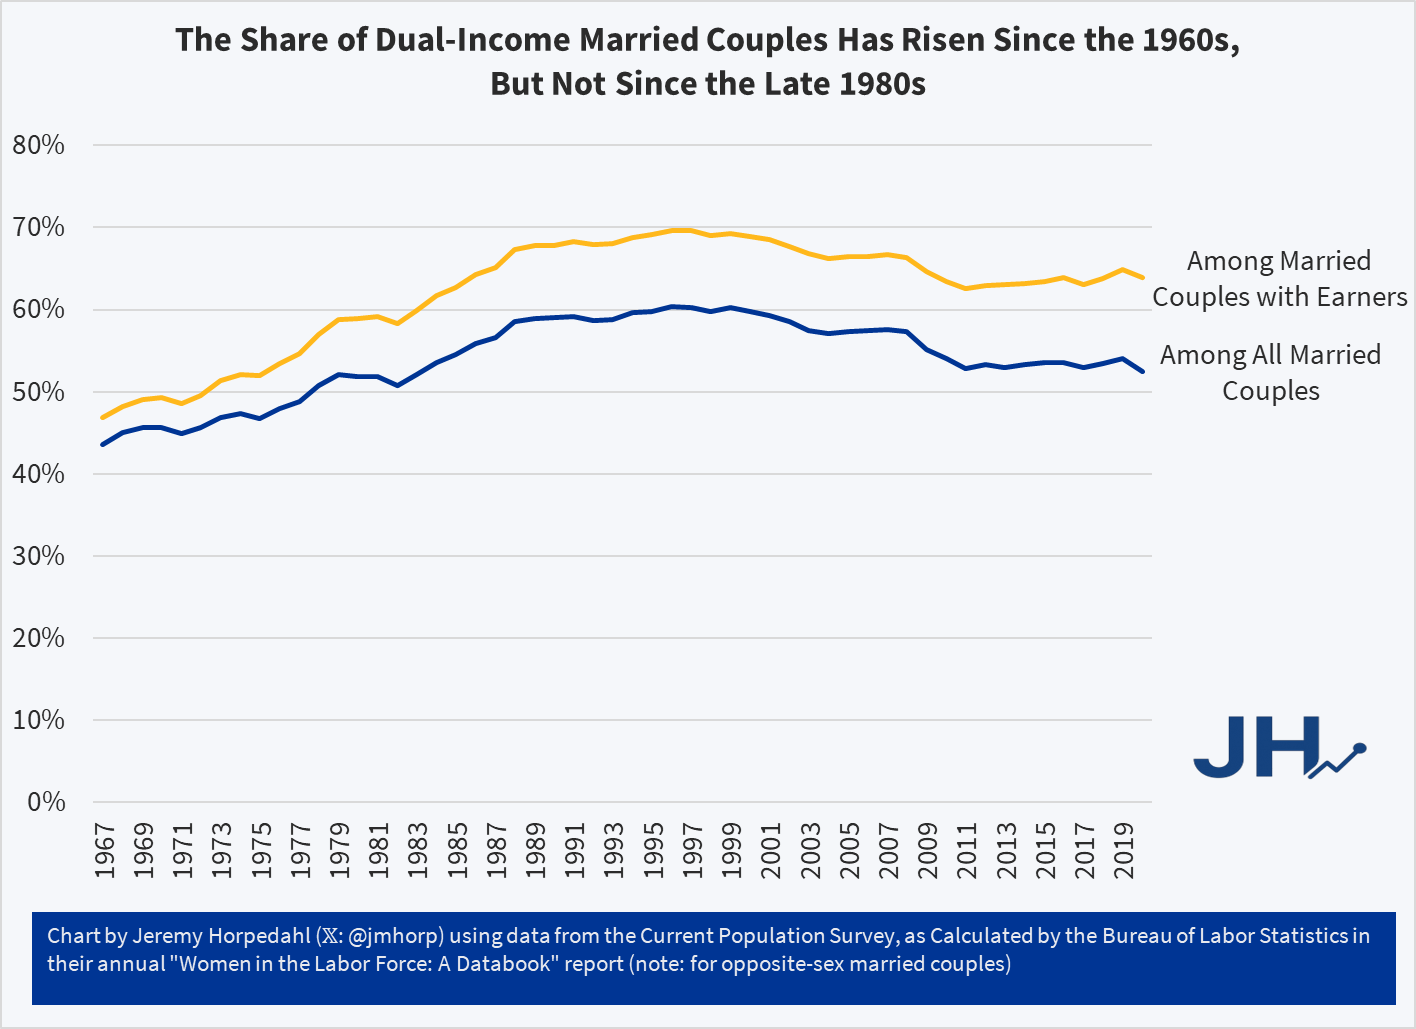
In addition to questions about inflation adjustments and general disbelief, one of the more common questions about this data is how much of it is driven by rising dual-income families, where both the husband and wife work (for purposes of this post, I will look only at opposite-sex couples, since going back to the 1960s this is the only way we can really make consistent comparisons).
In short: most of the growth of high-income families can not be explained by the rise of dual-income families. The basic reason is that the growth in dual-income families had mostly already occurred by the 1980s or 1990s (depending on the measure). So the tremendous growth since about 1990, when just about 15 percent of families were above $150,000 (in 2024 dollars), is better explained by rising prosperity, not a trick of more earners.
You can see this in a number of ways. First, here is the share of married couples where both spouses are working. I have presented the data including all married couples (blue line), as well as only married couples with some earners (gold line), since the aging of the population is biasing the blue-line downwards over time.
This is the third in a series of occasional blog posts on individual initiatives that made a strategic (not just tactical) difference in the course of the second world war.
World War II was not only the biggest, bloodiest conflict, in human history. It played a definitive role in giving us the world we have today. Everyone can find something to complain about in the current state of affairs, but think for a moment what the world would be like if the Axis powers had prevailed.
Having control of the air became crucial in the second world war. It meant you could drop bombs on enemy soldiers, ships, tanks, cities, factories, etc., etc. The Germans showed early on how important that can be. Their terror bombing of the Dutch city of Rotterdam compelled the Netherlands to surrender to spare other cities from being likewise bombed, even though the Dutch armed forces could have held out for some time longer. The German breakthrough in their invasion of France in 1940 was facilitated by a concentrated Stuka dive bombing attack on a key sector of the French front lines. The 1940 Battle of Britain was an air war, where the Germans hoped to whittle the British Air Force capability down enough to permit them to invade across the English Channel. And so on.
The main German fighter plane at first was the Messerschmidt Me 109. It was a good plane, although by 1941 the British Spitfire had become a match for it. Both the Me 109 and the Spitfire were designed around in-line engines, where the cylinders were arranged in two long rows in the engine block. That gave a narrow engine, and hence a skinny profile to the airplane, which tended to reduce wind resistance and make for higher speeds. A weak point of all in-line engines is that they need to have a circulating coolant system, going through a radiator, to cool down the engine block from the heat of the internal combustion. This makes for more complicated maintenance and is very vulnerable to being damaged by enemy fire,
Just when the Brits were starting to wrest air superiority back from the Germans, the FW 190 appeared in the skies over France. Allied pilots were shocked. The new German fighter could out-climb, out-roll, and in many cases out-fight the current Spitfire models. This so-called “butcher bird” gave air superiority back to the Germans.
Its remarkable performance was the result of one man’s engineering philosophy and persistence: Kurt Tank, chief designer at the German aircraft manufacturer Focke-Wulf. Tank was a pilot as well as an engineer, with long and varied prior military experience. He chose a radial engine for his plane, to make it more rugged and easy to maintain. With a radial engine, the individual cylinders all stick out from a central crankcase; airflow past the fins on the cylinders cools the engine. Hence, no vulnerable cooling system and radiator. The conventional thinking was that a radial engine was so fat that an airplane using it would have a wide, draggy profile. His ingenious design features allowed him to make a fast, agile plane. However, was an uphill job for Tank to sell his concept to the German military establishment. Eventually, his results spoke for themselves and the Fw 190 was produced. With its critical spots armored, the Fw 190 was hard to kill. Tank deliberately gave a wide stance and long travel to the landing gear, to allow deployment in rough frontline airfields.
The Fw 190 was a superb low-medium altitude fighter, and was also widely pressed into service (due to its rugged design) as a precision bomber on the front lines. Around 20,000 Fw 190s were produced. They shot down many thousands of Allied planes, killed untold thousands of Allied airmen and soldiers, and destroyed thousands of Allied vehicles, mainly on the Eastern Front. It was not enough to change the ultimate outcome of the war, but Tank stretched it out appreciably, by (largely single-handedly) giving the Germans such a versatile and deadly weapon.
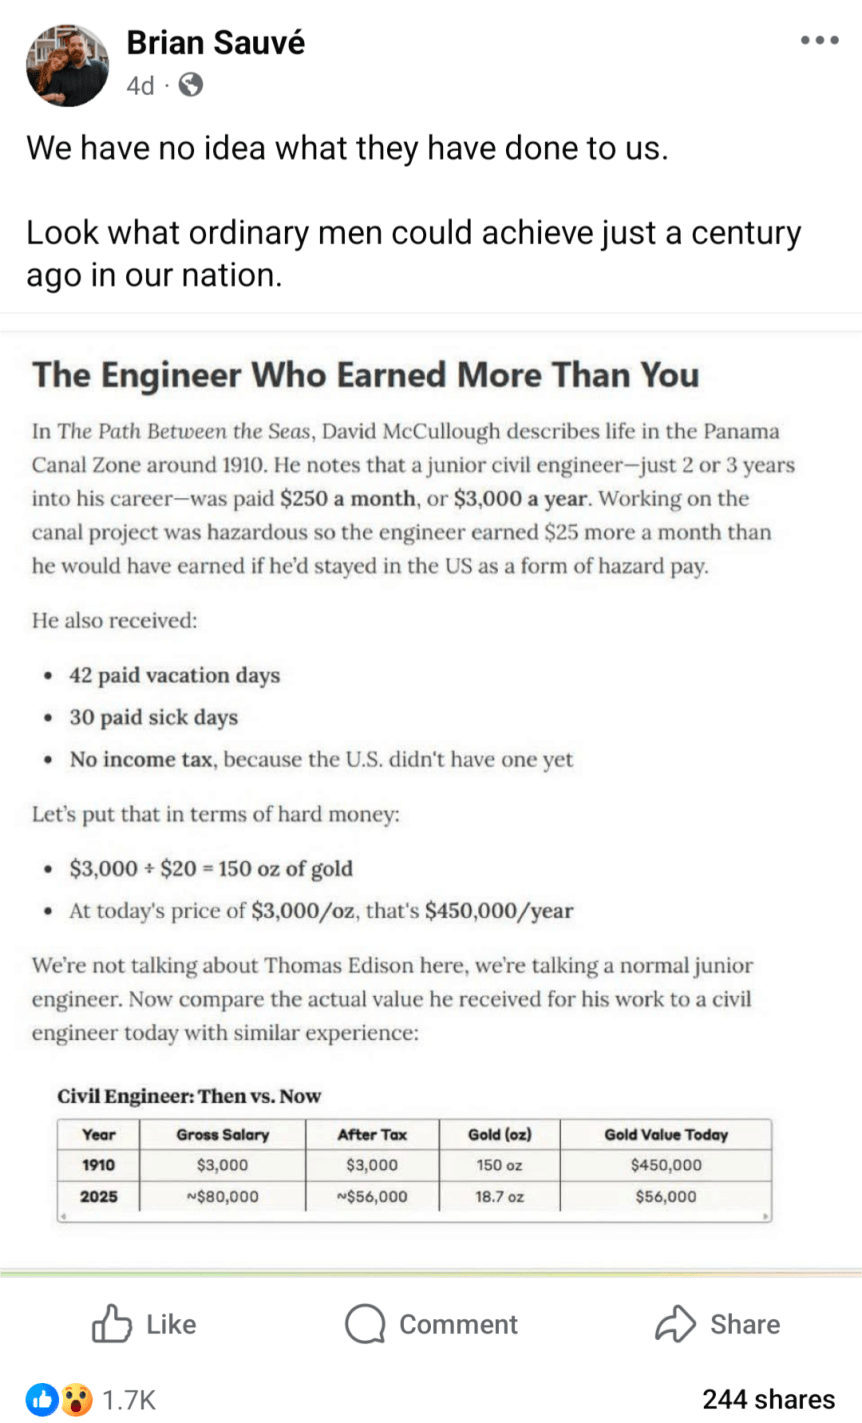
Inflation adjusting income and prices from the past is a common theme in my blog posts, including fact checking of other attempts to do these adjustments. But here is a really novel one, in a viral post from Facebook (which comes from this essay), which claims that a civil engineer earned the equivalent of $450,000 in today’s terms:
Can this be correct? If so, it would represent massive stagnation in incomes over time. Thankfully, there are two major errors, or at least misleading aspects to the calculation.
The listed salary was not one of an “ordinary man” — far from it.
Using gold prices to inflation adjust the incomes is very misleading.
First, the salary: $3,000 per year was definitely not what ordinary men earned. The average wage, for example, for a production worker in manufacturing was 18 cents per hour. You would need to work almost 17,000 hours to earn $3,000 at that wage, which of course is not possible. In reality, the average worker put in 57 hours per week — which means they earned about $500 if they were able to work 50 weeks per year (most probably didn’t). So already we see that the civil engineer working on the Panama Canal is making about 6 times as much as an “ordinary man.” Agricultural workers, the other main industry of 1910, earned about $28 per month ($22 if they also received board) — even less than manufacturing, and only about 1/10 of the engineer
Second, the gold price adjustment is misleading. Yes, in 1910, gold was how we defined currency in the US. But you can’t eat gold, and most people only keep a little gold on hand that can be described as providing services for them (such as jewelry). What people really wanted were real goods and services, and mostly goods. Around 1910, the average American household spent about 40% of their income on food, 23% on housing, and 15% on clothing. Comparing standards of living over time requires us to look at what people spend their money on, not what the currency is denominated in. And that’s what a good consumer price index does: it compares the prices of all consumer spending at different points in time, not just one thing like gold, allowing us to make rough comparisons of income over time.
Using the Measuring Worth historical CPI (which extends the BLS CPI back before 1913), we see that the index was 9.21 in 1910, and it stands at 323.364 in August 2025. So the 18-cent manufacturing wage from 1910 is roughly equivalent to $6.32 in current dollars. The average manufacturing wage today? Around $29. And of course, workers today have a whole range of fringe benefits, worth roughly another $13.58 for private sector workers. This means that an “ordinary man” today working in manufacturing can buy 5-7 times as many real goods and services as his 1910 counterpart for each hour he works. And the work is, of course, much safer today: BLS reports 23,000 industrial deaths in 1913 (61 deaths per 100,000 workers), but only 391 manufacturing deaths in 2023 (0.003 deaths per 100,000 workers).
But what about that extraordinary man in 1910, the civil engineer? How was he doing compared with today? Using the same historical CPI, we can see that $3,000 in 1910 is roughly equivalent to $105,000 today. Not bad! That’s almost exactly the median pay for civil engineers today. But keep in mind the civil engineer working in Panama was an unusually highly paid position. A 1913 report from the American Society of Civil Engineers suggests that most early career civil engineers were making closer to $1,500 per year — half of the Panama engineer. Engineers were also a highly skilled, very rare profession in 1910. And don’t forget that about 10% of the American workers on the Canal died in the construction, mostly from disease so the engineers were probably just as susceptible to death as the laborers.
Finally, we might ask a different question: what if you had held onto gold since 1910? Let’s say your great-great grandfather was a civil engineer, and managed over the course of a few years to save one year’s salary in gold. He even managed to hide it during the 1930s-1970s, when private holding of gold was generally illegal in the US.
How much would that 150 ounces of gold be worth today? That answer is simple: about $615,000 today (gold has gone up a bit just since that calculation was done in May!). But was that a good investment? Not really. A $3,000 investment in the stock market from 1910 to 2024 would be worth about… $120 million (it’s actually a bit more than that, since the market continued to rise after January 2024). Of course, that would have required a bit of active management, since index funds don’t come along until much later. But your great-great grandfather would have been much wiser to set up a trust for you and have it actively managed to approximate the entire US stock market, rather than to bury 150 ounces of gold in his backyard.
Even assuming you lost half the value to management fees, the stock portfolio today would be worth at least 100 times as much as the gold.
This is the second of a series of occasional posts on observations of how some individual initiatives made strategic impacts on World War II operations and outcome. While there were innumerable acts of initiative and heroism that occurred during this conflict, I will focus on actions that shifted the entire capabilities of their side.
It’s the summer of 1941. The war in Europe between mainly Germany and Britain had been grinding on for around two years, with Hitler in control of nearly all of Europe. The Germans then attacked the Soviet Union, and quickly conquered enormous stretches of territory. It looked like the Nazis were winning. Relations with Japan, which aimed to take over the eastern Pacific region were uneasy. The Japanese had already conquered Korea and coastal China, and were eyeing the resource-rich lands of Southeast Asia and Indonesia. It was a tense time.
The Japanese military had been building up for decades, preparing for a war with the United States for control of the eastern Pacific. They developed cutting edge military hardware, including the world’s biggest battleships, superior torpedoes and a large, well-trained aircraft carrier force. They also produced a new fighter plane, dubbed the “Zero” by Western observers.
Intelligence reports started to trickle in that the Zero was incredibly agile: it could outrun and out-climb and out-turn anything the U.S. could put in the air, and it packed a wallop with twin machine cannons. Its designers achieved this performance with a modestly-powered engine by making the airframe supremely light.
As I understand it, the U.S. military establishment’s response to this intel was fairly anemic. It was such awful news, that seemingly they buried their heads in the sand and just hoped it wasn’t true. Why was this so disastrous? Well, since the days of the Red Baron in World War I, the way you shot down your opponent in a dogfight was to turn in a narrower circle than him, or climb faster and roll, to get behind him. Get him in your gunsights, burst of incendiary machine-gun bullets to ignite his gasoline fuel tanks, and down he goes. If the Zero really was that agile, then it could easily shoot down any U.S. plane with impunity. Even if you started to line up behind a Zero for a shot, he could execute a tight turning maneuver, and end up on your tail, every time. Ouch.
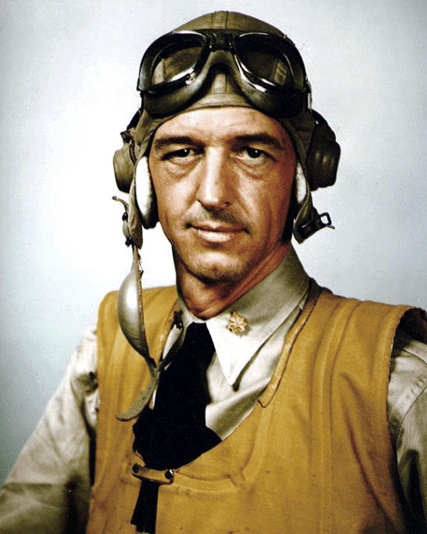
A U.S. Navy aviator named John Thatch from Pine Bluff, Arkansas did take these reports on the Zero seriously. He racked his brains, trying to figure out a way for the clunky American Wildcat fighters to take on the Zeros. He knew the American pilots were well-trained and were good shots, if only they could get some crucial four-second (?) windows of time to line up on the enemy planes.
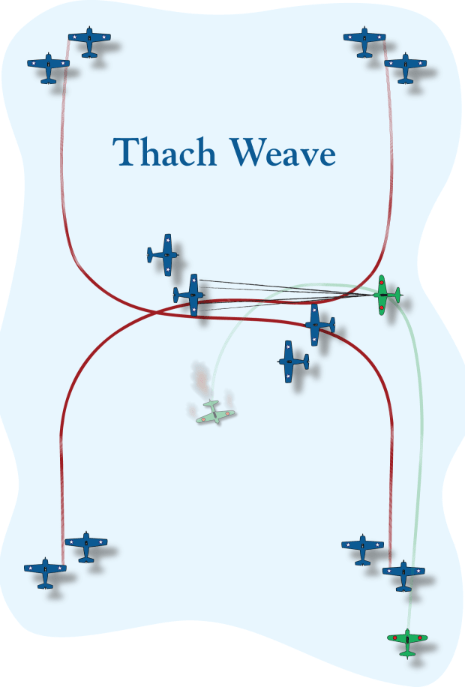
So, he spent night after night that summer, using matchsticks on his kitchen table, trying to invent tactics that would neutralize the advantages of the Japanese fighters. He found that the standard three-plane section (one leader, two wingmen) was too clumsy for rapid maneuvering. He settled on having two sections of two planes each. The two sections would fly parallel, several hundred yards apart. If one section got attacked, the two sections would immediately make sharp turns towards each other, and cross paths. The planes of the non-attacked section could then take a head-on shot at the enemy plane(s) that were tailing the attacked section.
The blue planes are the good guys, with a section on the left and on the right. At the bottom of the diagram, an enemy plane (green) gets on the tail of a blue plane on the right. The left and the right blue sections then make sudden 90 degree turns towards one another. The green plane follows his target around the turn, whereupon he is suddenly face-to-face with a plane from the other section, which (rat-a-tat-tat) shoots him down. In a head-to-head shootout, the Wildcat was likely to prevail, since it was more substantial than the flimsy Zero. Afterwards, the two sections continue flying parallel, ready to repeat the maneuver if attacked again. And of course, they don’t just fly along hoping to be attacked, they can make offensive runs at enemy planes as well, as a unified formation. This technique was later dubbed the “Thatch weave”.
Thatch faced opposition to his unorthodox tactics from the legendary inertia of the pre-war U.S. military establishment. Finally, he and his trained team submitted to a test: their four-plane formation went into mock combat against another four planes (all Wildcats), but his planes had their throttles restricted to maximum half power. Normally that would have made them toast, but in fact, with their weaving, they frustrated every attempt of the other planes to line up on them. This demonstration won over many of the actual pilots in the carrier air force, though the brass on the whole did not endorse it.
By some measures the most pivotal battle in the Pacific was the battle of Midway in June, 1942. The Japanese planned to wipe out the American carrier force by luring them into battle with a huge Japanese fleet assembled to invade the American-held island of Midway. If they had succeeded, WWII would have been much harder for the U.S. and its allies to win.
The way that battle unfolded, the U.S. carriers launched their torpedo planes well before their dive bombers. The Japanese probably feared the torpedo planes the most, and so they focused their Zeros on them. Effectively only Thatch and two other of his Wildcats were the only American fighter protection for the slow, poorly-armored torpedo bombers by the time they got to their targets. Using his weave maneuver for the first time in combat, he managed to shoot down three Zeros while not getting shot down himself. This vigorous, unexpectedly effective defense by a handful of Wildcats crucially helped to divert the Japanese fighters and kept them at low altitudes, just in time for the American dive bombers to arrive and attack unmolested from high altitude.
In the end, four Japanese fleet carriers were sunk by the dive-bombers at Midway, at a cost of one U.S. carrier. That victory helped the U.S. to hang on in the Pacific until its new carriers started arriving in 1943. Thatch’s tactic made a material difference in that battle, and was quickly promulgated throughout the rest of the U.S. carrier force. It was not a complete panacea, of course, since the once the enemy knew what you were about to do, they might be able to counter it. However, it did give U.S. fighters a crucial tool for confronting a more-agile opponent, at a critical time in the war. Thatch went on to train other pilots, and eventually became an admiral in the U.S. Navy.
Yesterday on Twitter I shared a chart showing the age at first marriage for white men and women in the US, with data going back to 1880. I pointed out an interesting fact: at least for men, the age was essentially the same in 1890 and 1990 (27), though for women it was a bit higher in 1990 than in 1890 (by about 1 year).
This Tweet generated quite a bit of interest (over 800,000 impressions so far), and (of course!) a lot of skeptical responses. One skeptical response is that I cut off the data in 1990, when trends since then have shown continuously rising ages at first marriage, and by 2024 the comparable figures were much higher than in 1890 (by about 4 years for men and 6.5 years for women). In one sense, guilty as charged, though I only came across this data when looking through the Historical Statistics of the US, Millennial Edition, and that was the most current data available when it was printed. Here is a more updated chart from Census:
But there is another interesting fact about that data: the massive decline age of first marriage in the first half of the 20th century. Between 1890 and 1960, the median age at first marriage fell by about 3 years for men and 2 years for women. For men, most of the decline (about 2 years) had already happened by 1940. Thus, if we start from the low-point of the 1950s and 1960s (as many charts do, such as this one), it appears marriage is continuously getting less common in US history, while the fuller picture shows a U-shaped pattern.
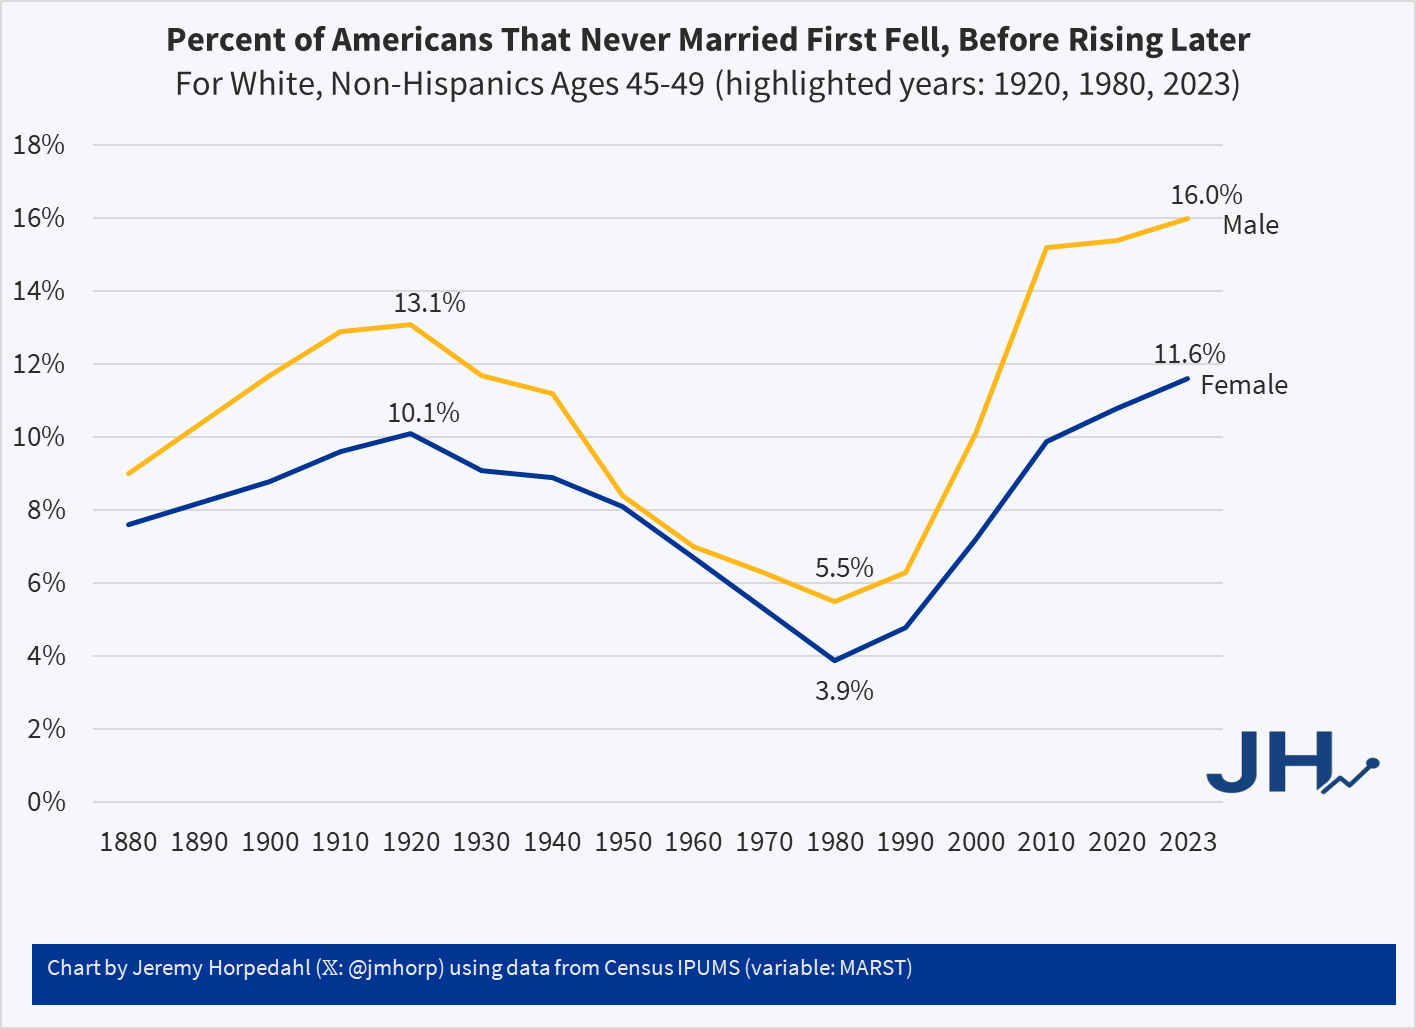
This same pattern shows up in another measure of marriage data: the percentage of people that never get married. If we look at White, Non-Hispanic Americans in their late 40s, the picture looks something like this (keen observers will note that the Hispanic distinction is a modern one dating from the 1970s, but Census IPUMS has conveniently imputed this classification back in time based on other demographic characteristics):
Looking at people in their late 40s is useful because, at least for women, they are past their childbearing years. And using, say, the late 50s age group doesn’t alter the picture much: even though some people get married for the first time in their 50s, it’s always been a small number.
Here we can see an even more dramatic pattern. 100 years ago, it was not super rare for people to never marry: over 1/10 of the population didn’t! But by 1980 (thus, for people born in the early 1930s), it was much rarer: less than 4% of women were never married (among White, Non-Hispanics). In fact, the peak in 1920 of 10% unmarried women wasn’t surpassed again until 2013! And it’s not substantially higher today than 1920 for women, especially when considering the full swing downward. Men are quite a bit higher today, though the 1920 peak of 13% wasn’t surpassed again until 2006.
For a measure that peaks in 1920, we might wonder if new immigrants are skewing the data in some way, given that this is right at the end of about 4 decades of mass immigration. But just the opposite: if we focus on native-born women, the 1920 level was even higher at 11.1%, which wasn’t surpassed until 2022, and even in the latest figures it is less than 1 percentage point higher than 1920.
Precisely why we observed this U-shaped pattern in marriage (both first age and ever married) is debated among scholars, though my sense among the general public is that it isn’t much thought about. Most people (from my casual observation) seem to assume that marriage rates and ages were always lower in the past, and that modern times are the outliers. But in reality, the middle part of the 20th century seems to be the outlier. The “Baby Boom” of roughly 1935-1965 is possibly better understood as a “Marriage Boom,” with more babies naturally following from more and younger marriages.
This is the first of a series of occasional posts on observations of how some individual initiatives made strategic impacts on World War II. Most major decisions were made by teams of qualified engineers or military staff or whatever. But there were cases where one person’s visionary action made a material difference. There were, of course, many thousands of individual acts of initiative and heroism that went into the outcome of any given battle. However, I will focus on actions that shifted the entire capabilities of their side.
In this regard, I recently read how the intervention of President Roosevelt helped to give the U.S. nine additional aircraft carriers in the Pacific at a time when they were critically needed. As of U.S. entry into WWII in December, 1941, America had a total of 7 carriers, while Japan had 11.
It had been clear for a while that the U.S. needed more carriers, but (pre-Pearl Harbor), the Navy was more focused on building battleships; for centuries, big ships carrying big cannons were the vessels that ruled the seas. Navy brass had run studies of carrier sizing, and decided they would rather have fewer, larger carriers, due to operational efficiencies. A problem was these large carriers took years to construct.
Thus, as of 1940 the projections were that the U.S. Navy would receive no new carriers before 1944. As a naval war with Japan looked more and more likely, the President got concerned. FDR had been Assistant Secretary of the Navy during World War I, and maintained an interest in naval affairs, so he had informed judgement here. In October, 1940, Roosevelt sent a letter to the Chief of Naval Operations, expressing interest in converting merchant ships into carriers for secondary duties such as convoy escort, antisubmarine warfare, aircraft transport, and air support of landing beaches. The Navy’s response was lukewarm. In 1941, FDR proposed that some of the many cruisers under construction could be converted to small carriers. The Navy considered this, and on 13 October 1941, the General Board of the United States Navy replied that such a conversion showed too many compromises to be effective: such carriers would be less stable platforms than the big carriers, and carry less than half the number of planes per ship.
I think most presidents would have given up at this point, but not FDR. He immediately ordered another study (I assume with the implicit message, “…and this time give the boss the answer he wants”). Lo and behold, on 25 October 1941, the Navy’s Bureau of Ships reported that aircraft carriers could in fact be converted from cruiser hulls. They would be of lesser capability, but fast enough for fleet action, and available much sooner than large carriers.
The December 7, 1941 attack on Pearl Harbor changed everything. That ninety-minute raid showed that aircraft carriers were by far the most critical warships. A carrier could reach out a hundred miles and easily sink any battleship with torpedo bombers, as Japan showed on that “day of infamy” and further demonstrated by sinking British battleships near Singapore, and chasing the British navy largely out of both the Pacific and the eastern Indian Oceans. (If the brass had been paying attention, the British Navy had already used carrier-based torpedo bombers to cripple battleships at the Taranto raid and with sinking the Bismarck, well before Pearl Harbor).
The U.S. did end up converting some (slow) merchant ships to carriers, and built a huge number of small, slow, fragile “escort” carriers for transporting planes and for shore bombardment. But there was still an immediate need for better-protected small “fleet” carriers which were fast enough to keep up with the big carriers and which could survive being hit by a bomb. Japanese leaders knew they could not prevail in a long drawn-out war, so their strategy was to inflict so much damage on American military and territorial assets in the first year of conflict that the U.S. would sue for peace under Japanese terms. Japan, like Germany, was very successful at first. The Japanese overran nearly all of Southeast Asia, including the Philippines (an American possession), the Dutch East Indies (a source of rubber, petroleum, and minerals) and the British stronghold at Singapore. They came perilously close to invading Australia. So the first year or so was critical: the Allies needed to survive the onslaught from a better-prepared opponent until American mobilization took full effect.
The Navy settled on repurposing a suite of nine Cleveland class light cruisers which were under construction. These new “light carriers” could carry about 30 planes apiece, compared to a complement of around 60 planes on the full-sized ships. The smaller carriers carried fewer spares, rolled more in heavy seas, and had smaller flight decks which led to more accidents. Nevertheless, they provided a boost to U.S. naval air power at a critical time.
The U.S. entered the war with seven fleet carriers, of which six were assigned to the Pacific. In the course of 1942, four of those six fleet carriers were sunk, and the other two were severely damaged from bombs and torpedoes. Thus, there was a time in October, 1942 that the U.S. had not a single operational carrier in the Pacific, while Japan was fielding around six. That was dire.
No new U.S. carriers were commissioned until the last day of 1942 (U.S.S. Essex). That was a long dry spell. Finally, in the first six months of 1943 eight fleet carriers commissioned. Of these, three were full-sized ships, while five were the cruiser-based light carriers. That finally gave the U.S. some breathing room, which allowed it to defend its assets and pursue offensive operations. These “Independence-class” light carriers fought in many battles, sometimes providing around a quarter of the fleet airpower.
Thereafter, the astonishing mid-century American industrial capacity took over. From mid-1943 through mid-1945 another 17 fleet carriers (including four more Independence-class light carriers in the second half of 1943) poured out of U.S. shipyards, along with some 60 “escort” carriers. By late 1944, this gigantic fleet had utterly overwhelmed Japan’s navy.
But it was largely Roosevelt’s vision and repeated poking of the stodgy Navy staff that produced the first batch of light carriers which helped tipped the balance of forces during the critical first eighteen months of the war.
Academics generally agree on the changing patterns of mortality over time. Centuries ago, people died of many things. Most of those deaths were among children and they were often related to water-borne illness. A lot of that was resolved with sanitation infrastructure and water treatment. Then, communicable diseases were next. Vaccines, mostly introduced in the first half of the 20th century, prevented a lot of deaths.
Similarly, food borne illness killed a lot of people before refrigeration was popular. The milkman would deliver milk to a hatch on the side of your house and swap out the empty glass bottles with new ones full of milk. For clarity, it was not a refrigerated cavity. It was just a hole in the wall with a door on both the inside and outside of the house. A lot of babies died from drinking spoiled milk.
Now, in higher income countries, we die of things that kill old people. These include cancer, falls that lead to infections, and the various diseases related to obesity. We’re able to die of these things because we won the battles against the big threats to children.
What prompts such a dreary topic?
I was perusing the 1870 Census schedules and I stumbled upon some ‘Schedule 2s’. Most of us are familiar with schedule 1, which asks details about the residents living in a household. But schedule 2 asked about the deaths in the household over the past year. Below is a scan from St. Paul, Minnesota.
When reading an old novel or watching a period drama movie or TV show, it is almost inevitable that some historical currency amounts will be mentioned. This is especially true when the work is dealing with money and wealth, for example the series “The Gilded Age” is about rich people in late 19th century America. So money comes up a lot. I wrote a post a few weeks ago trying to contextualize a figure of $300,000 from 1883 for that show.
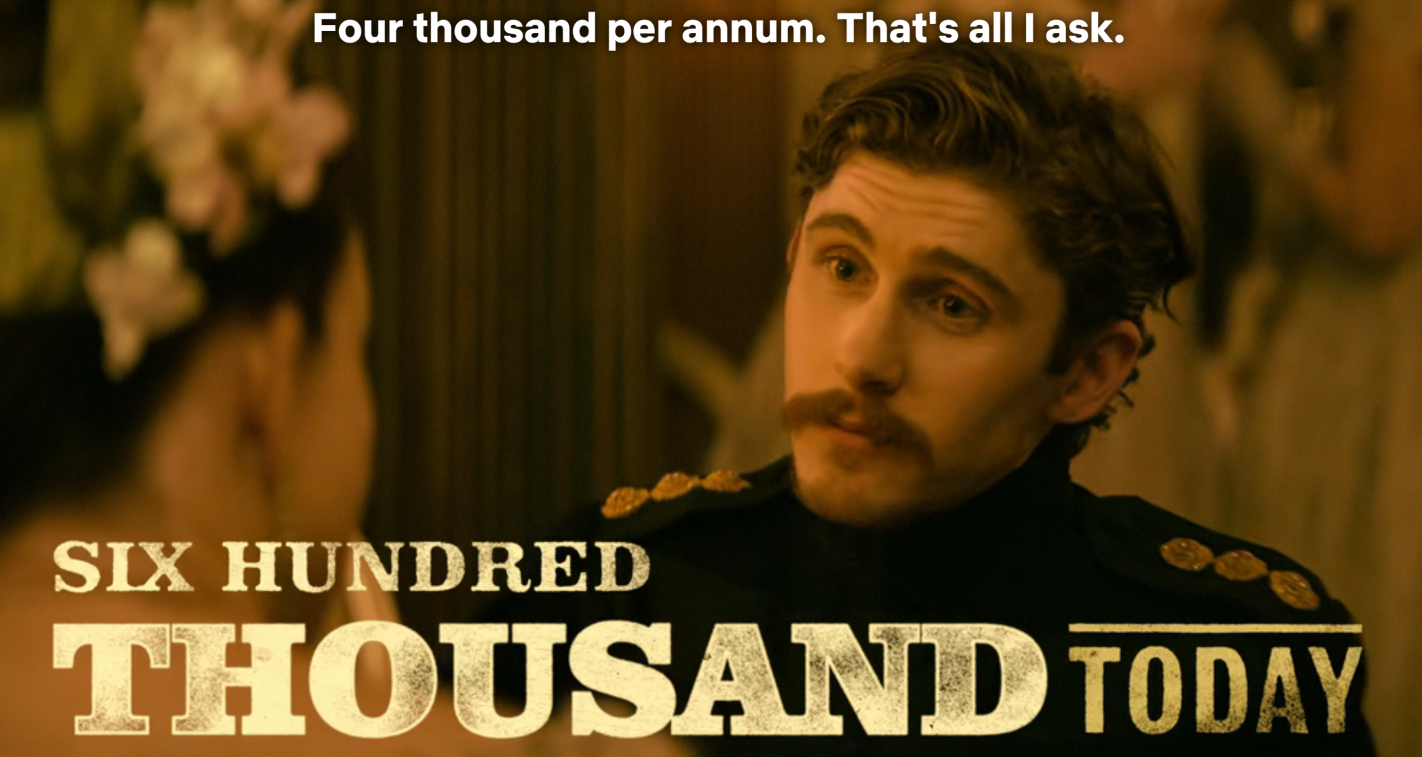
A new Netflix series “The House of Guinness” is another period piece that spends a lot of time focusing on rich people (the family that produces the famous beer), as well as their interactions with poorer folks. So of course, there are plenty of historical currency values mentioned, this time denominated in British pounds (the series is primarily set in Ireland, where the pound was in use). On this series, though, they have taken the interesting approach of giving the viewers some idea of what historical currency values are worth today, by overlaying text on the screen (the same way they translate the Gaelic language into English).
For example, in Episode 4 of the first season, one of the Guinness brothers is attempting to negotiate his annual payment from the family fortune. He asks for 4,000 pounds per year. On the screen the text flashes “Six Hundred Thousand Today.”
The creators of the show are to be commended for giving viewers some context, rather than leaving them baffled or pausing the show to Google it. But is 600,000 pounds today a good estimate? Where did they get this number? As with the “Gilded Age” estimate, it’s complicated, but it is probably more than you think.
My new article, “Prohibition and Percolation: The Roaring Success of Coffee During US Alcohol Prohibition”, is now published in Southern Economic Journal. It’s the first statistical analysis of coffee imports and salience during prohibition. Other authors had speculated that coffee substituted alcohol after the 18th amendment, but I did the work of running the stats, creating indices, and checking for robustness.
My contributions include:
National and state indices for coffee and coffee shops from major and local newspapers.
A textual index of the same from book mentions.
I uncover that prohibition is when modern coffee shops became popular.
The surge in coffee imports was likely not related to trade policy or the end of World War I
Both demand for coffee and supply increased as part of an intentional industry effort to replace alcohol and saloons.
An easy to follow application of time series structural break tests.
An easy to follow application of a modern differences in differences method for state dry laws and coffee newspaper mentions.
Evidence from a variety of sources including patents, newspapers, trade data, Ngrams, naval conflicts, & Wholesale prices.
Generally, the empirical evidence and the main theory is straightforward. I learned several new empirical methods for this paper and the economic logic in the robustness section was a blast to puzzle-out. Finally, it was an easy article to be excited about since people are generally passionate about their coffee.
Bartsch, Zachary. 2025. “Prohibition and Percolation: The Roaring Success of Coffee During US Alcohol Prohibition.” Southern Economic Journal, ahead of print, September 22. https://doi.org/10.1002/soej.12794.
Housing is certainly more expensive than in the past. I have written about this several times, including a post from last year showing that between about 2017 and 2022 housing started to get really expensive almost everywhere in the US, not just on the West Coast and Northeast (as had previously been the case). I don’t think the housing affordability crisis is in serious doubt anymore, and it can’t be explained over the past few years by increasing size and amenities, since those haven’t changed much since 2017 (though it is relevant when comparing housing prices to the 1970s).
But why did this happen? Knowing why is crucial, not merely to blame the causes, but because the policy solution is almost certainly related to the causes. I and many others have argued that supply-side restrictions, such as zoning laws, are the primary culprit. The policy solution is to reduce those restrictions. But a recent op-ed titled “Why your parents could afford a house on one salary – but you can’t on two,” the authors place the blame for housing prices (as well as the stagnation of living standards generally) on a different factor: Nixon’s 1971 “severing the dollar’s link to gold.” The authors have a book on this topic too, which I have not yet read, but they provide most of the relevant data in this short op-ed.
Does their explanation make sense? I am skeptical. Here’s why.