Venture-capital backed startups almost all cluster in the same handful of industries, mostly various types of software. This leaves a variety of large and economically important sectors with almost no venture-capital backed startups. That means those industries see fewer new companies and new ideas; they must rely on either growth from existing firms, which are unlikely to embrace disruptive innovation, or on startups that bootstrap and/or finance with debt, which tend to grow slowly.
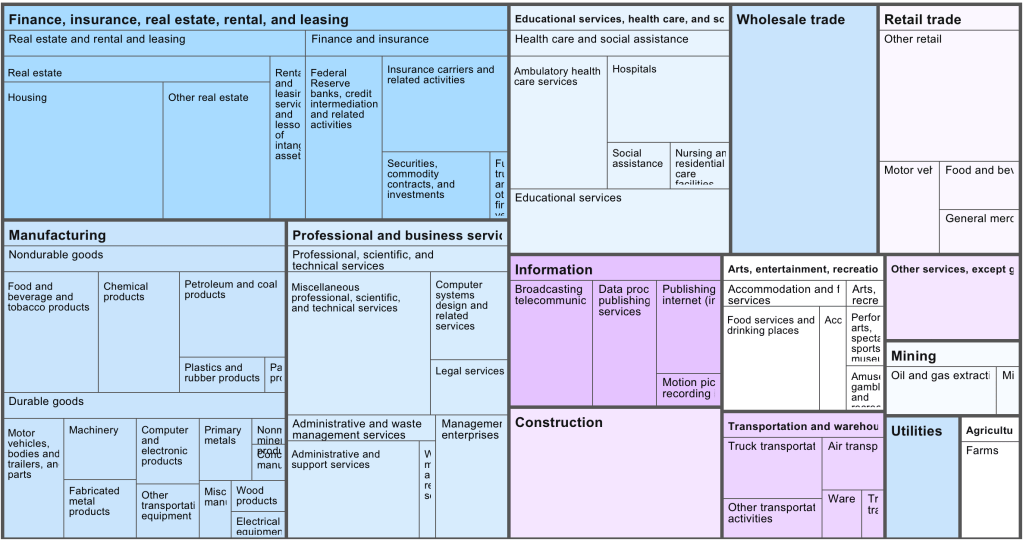
Venture capital firm Fifty Years has done a nice job cataloging exactly which industries see the most, and least, investment relative to their size. Here is their picture of the US economy by industry market size:
Now their picture of which industries get the investment (though unfortunately, they aren’t very clear about their data source for it):
They use this to create an “Opportunity Ratio”- current market size divided by current startup funding:
They call the industries with the largest Opportunity Ratios the “Top Underfunded Opportunities”:
I don’t necessarily agree; some industries face shrinking demand, prohibitive regulation, or other fundamental issues making them bad candidates for investment. Conversely, investors haven’t just focused on software randomly or through imitation; they see that it is where the growth is.
Still, herding by investors is real, and I always like the strategy of finding a new game instead of trying to win at the most competitive games, so I do think there is something to the idea of investing in an unsexy industry like paper. Growing up in Maine and watching one paper mill after another close, I always wondered how they managed to lose money in a state that is 90% trees, and whether anyone could find a way to reverse the trend. Perhaps related technology like mass timber or biochar will be the way to take advantage of cheap lumber.
Thanks again to Fifty Years for releasing the data.
This continues our occasional series on stock options for amateurs.
I find options to be a nice tool in my investing arsenal. The previous post in this series was Stock Options Tutorial 1. Options Fundamentals. That post dealt with buying options, to provide simple examples. For reasons to explained in a future post, I usually prefer to sell options. Anyway, here we will look briefly at how options are priced. It is important to get an intuitive understanding of this, in order to be comfortable actually using options in your account.
The current price of an option, if you wanted to buy or sell it, is called the premium. There are two components that go into the premium, the intrinsic value and the extrinsic (or “time”) value:
The intrinsic value is easy to figure out, once you understand it. It is simply how much you would profit if you owned the option, and decided to exercise it right now. For instance, if you owned a call with a strike price of $50, but the stock price is $55, you could exercise the call and force whoever sold you the call to sell you the stock at a price of $50/share; you could turn around and immediately sell that share for $55, pocketing $5/share. We say that the option in this case is $5 in the money, and the intrinsic value is $5.
If the stock price were $60, it would be $10 in the money; you could pocket $10/share for exercising it. If the stock price were say $90, the option would be $40 in the money, and so on.
However, if the stock price were $50 (the $50 option is “at the money”) or lower (option is “out of the money”), you would get no benefit from being able to purchase this stock for $50, and so the intrinsic value of the option would be zero.
With a put (which is an option to sell a stock at a particular price), this is all reversed. If the stock is $5 lower than the option strike price, the option is $5 in the money and has a $5 intrinsic value, since if you own it, you could say buy the stock at $45, and force the put option seller to buy it from you at $50/share:
Suppose the current price of a stock is $50. And suppose you suspect its price may be above $50, say $60 sometime in the next month, so you would like to have the option of buying it at $50 sometime in the future, and then selling it into the market at (say) $60, for a quick, guaranteed profit of $10. Sounds great, yes?
Since a $50 call is right at the money (since the stock price is also $50), the intrinsic value of a $50 call is zero. Does this mean you could go out and buy a $50 call option for nothing? No, because the seller of the option is taking a risk by providing you that option. If the stock really does go to $60, he could be out the $10. Therefore, he will demand a higher price than the intrinsic price, to make it worth his while. This extra premium over the intrinsic premium is the extrinsic premium, which varies greatly with the time till expiration of the option.
If you wanted the option of buying the stock at $50 sometime in the next week, the option seller would charge only a small amount; after all, what are the odds that the stock will rise a lot in one week? However, if you wanted to extend that option period out to one year, he will charge you a high extrinsic premium, since there is a bigger chance that the stock could soar will over $50 sometime in that long timeframe.
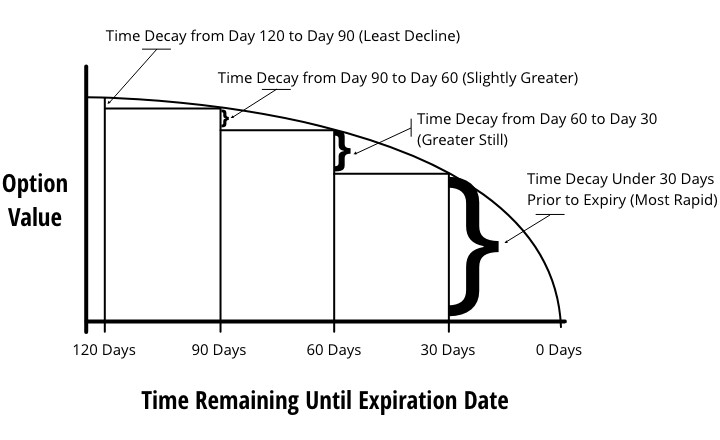
Another way of framing this is, if you buy a $50 call option today with an expiration date a year from now, you will pay a high extrinsic value. But as the months roll by, and it gets closer to the expiration date, this extrinsic value or time premium will shrink down ever more quickly towards zero:
Now, computing the actual amount of the extrinsic value is really gnarly. The Black-Scholes model provides a theoretical value under idealized conditions, but for us amateurs, we pretty much have to just take what the market gives us. In deciding whether to buy or sell an option, I look at what the current market pricing is for it.
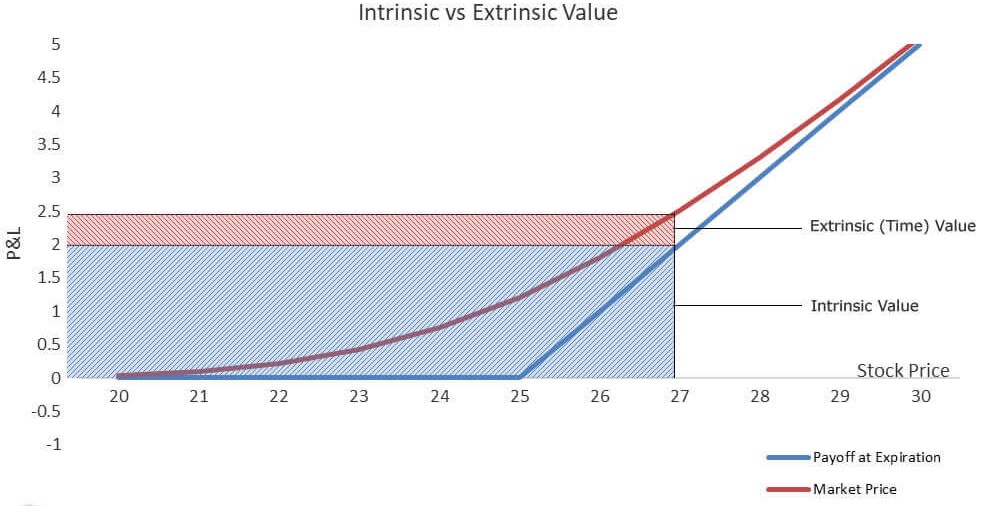
It turns out that an option which is priced at the money has the highest extrinsic value. As you get further into or out of the money, the extrinsic component of the total premium for the option diminishes. Below is one final graphic which pulls all this together:
The call option strike price is $25. The blue line shows the intrinsic value (labeled as “payoff at expiration”) at each stock price – this is zero at or below $25, and increases 1:1 as the stock price climbs above $25. The red curve shows the full market price of the option, including the extrinsic (time) premium. The spacing between the red and the blue lines shows the amount of the extrinsic premium. That spacing is greatest when the stock price is equal to the $25 strike price. The shaded areas specify the intrinsic and extrinsic values at a stock price of $27.
And (not shown here) as time passed and the option got closer to expiry, the extrinsic value would shrink (decay), and the red curve would creep closer and closer to the blue curve.
Boaz Weinstein is a really smart guy. At age 16 the US Chess Federation conferred on him the second highest (“Life Master”) of the eight master ratings. As a junior in high school, he won a stock-picking contest sponsored by Newsday, beating out a field of about 5000 students. He started interning with Merrill Lynch at age 15, during summer breaks. He has the honor of being blacklisted at casinos for his ability to count cards.
He entered into heavy duty financial trading right out of college, and quickly became a rock star. He joined international investment bank Deutsche Bank in 1998, and led their trading of then-esoteric credit default swaps (securities that payout when borrowers default). Within a few years his group was managing some $30 billion in positions, and typically netting hundreds of millions in profits per year. In 2001, Weinstein was named a managing director of the company, at the tender age of 27.
Weinstein left Deutsche Bank in 2009 and started his own credit-focused hedge fund, Saba Capital Management. One of its many coups was to identify some massive, seemingly irrational trades in 2012 that were skewing the credit default markets. Weinstein pounced early, and made bank by taking the opposite sides of these trades. He let other traders in on the secret, and they also took opposing positions.
(It turned out these huge trades were made by a trader in J. P. Morgan’s London trading office, Bruno Iksil, who was nick-named the London Whale. Morgan’s losses from Iksil’s trades mounted to some $6.2 billion.)
For what it’s worth, Weinstein is by all accounts a really nice guy. This is not necessarily typical for many high-powered Wall Street traders who have been as successful as he.
Weinstein and the Sprawling World of Closed End Funds
If you have a brokerage account, you can buy individual securities, like Microsoft common stock shares, or bonds issued by General Motors. Many investors would prefer not to have to do the work of screening and buying and holding hundreds of stocks or bonds. No problem, there exist many funds, which do all the work for you. For instance, the SPY fund holds shares of all 500 large-cap American companies that are in the S&P 500 index, so you can simply buy shares of the one fund, SPY.
Without going too deeply into all this, there are three main types of funds held by retail investors. These are traditional open-end mutual funds, the more common exchange-traded funds (ETFs), and closed end funds (CEFs). CEFs come in many flavors, with some holding plain stocks, and others holding high-yield bonds or loans, or less-common assets like spicy CLO securities. A distinctive feature of CEFs is that the market price per share often differs from the net asset value (NAV) per share. A CEF may trade at a premium or a discount to NAV, and that premium or discount can vary widely with time and among otherwise-similar funds. This makes optimal investing in CEFs very complex, but potentially-rewarding: if you can keep rotating among CEF’s, buying ones that are heavily discounted, then selling them when the discount closes, you can in theory do much better than a simple buy and hold investor.
I played around in this area, but did not want to devote the time and attention to doing it well, considering I only wanted to devote 3-4% of my personal portfolio to CEFs. There are over 400 closed end funds out there. So, I looked into funds whose managers would (for a small fee) do that optimized buying and selling of CEFs for me.
It turns out that there are several such funds-of-CEF-funds. These include ETFs with the symbols YYY and PCEF, CEFS, and also the closed end funds FOF and RIV. YYY and PCEF tend to operate passively, using fairly mechanical rules. PCEF aims to simply replicate a broad-based index of the CEF universe, while YYY rebalances periodically to replicate an “intelligent” index which ranks CEFs by yield, discount to net asset value and liquidity. FOF holds and adjusts a basket of undervalued CEFs chosen by active managers, while RIV holds a diverse pot of high-yield securities, including CEFs. The consensus among most advisers I follow is that FOF is a decent buy when it is trading at a significant discount, but it makes no sense to buy it now, when it is at a relatively high premium; you would be better off just buying a basket of CEFs yourself.
I settled on using CEFS (Saba Closed-End Funds ETF) for my closed end fund exposure. It is very actively co-managed by Saba Capital Management, which is headed by none other than Boaz Weinstein. I trust whatever team he puts together. Among other things, Saba will buy shares in a CEF that trades at a discount, then pressure that fund’s management to take actions to close the discount.
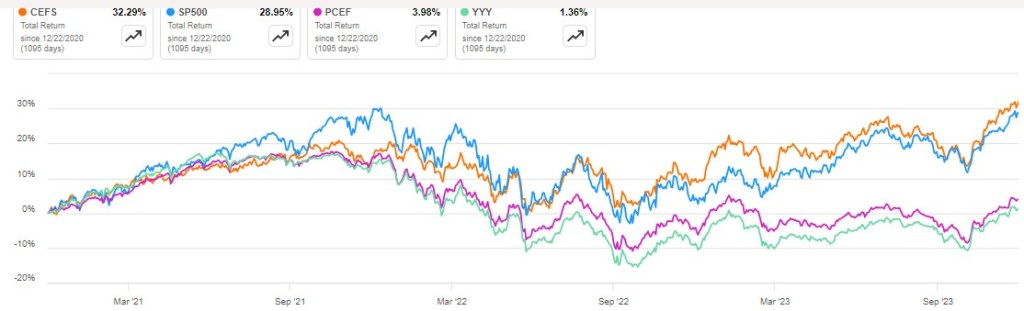
The results speak for themselves. Here is a plot of CEFS (orange line) versus SP500 index (blue), and two passively-managed ETFs that hold CEFs, PCEF (purple) and YYY (green) over the past three years:
The Y axis is total return (price action plus reinvestment of dividends). CEFS smoked the other two funds-of-funds, and even edged out the S&P in this time period. It currently pays out a juicy 9% annualized distribution. Thank you, Mr. Weinstein, and Merry Christmas to all my fellow investors.
Boilerplate disclaimer: Nothing in this article should be regarded as advice to buy or sell any security.
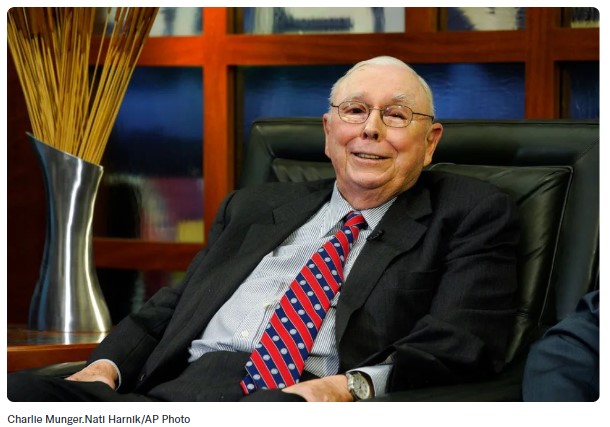
A big piece of news in the investment world has been the passing of Charlie Munger on Nov 28 at age 99. He was vice chair of Berkshire Hathaway, and Warren Buffett’s right-hand man there.
Munger grew up in Omaha, Nebraska, which is Warren Buffett’s hometown as well. They met at a dinner party there in 1959, and hit it off with one another personally. Munger was a really smart guy. After joining the US Army Air Corps in1943, he scored highly on an intelligence test and was sent to study meteorology at Caltech. After the war he was accepted into Harvard Law School despite lacking a formal undergraduate degree, and graduated summa cum laude.
In his 50s, Munger lost his left eye after cataract surgery failed. A doctor warned he could lose his right eye too, so he began learning braille, but the condition improved.
He entered law practice, and eventually started his own firm, but he became more interested in investing. He racked up 19.8% annual returns investing on his own, between 1962 and 1975. Buffett convince Munger to give up law and join him as vice-chairman of Berkshire Hathaway in 1978.
Perhaps Buffett’s most famous investing saying is “It’s far better to buy a wonderful company at a fair price than a fair company at a wonderful price”. He credits this approach to Munger: “Charlie understood this early – I was a slow learner.” Before being influenced here by Munger, Buffett had been more inclined to buy very low-priced shares in mediocre companies.
Munger was heavily involved with Buffett’s decisions. “Berkshire Hathaway could not have been built to its present status without Charlie’s inspiration, wisdom and participation,” Buffett said following Munger’s death. That tribute is no overstatement: from the time Munger joined Berkshire Hathaway in 1978 till now, shares of the company soared 396,182% (i.e., $100 invested in Berkshire Hathaway in 1978 is worth $396,282 today). This performance dwarfs the 16,427% appreciation of the S&P 500 over the same time period. When he died, Munger was personally worth $2.6 billion.
The internet is rife with sites displaying memorable or useful quotes from Charlie Munger. For example, “I never allow myself to have an opinion on anything that I don’t know the other side’s argument better than they do”; and three rules for a career: “1) Don’t sell anything [to others] you wouldn’t buy yourself; 2) Don’t work for anyone you don’t respect and admire; and 3) Work only with people you enjoy.”
Some of these quote lists focus on sayings which provide guidance to individual investors, such as this from CNBC:
“I think you would understand any presentation using the word EBITDA, if every time you saw that word you just substituted the phrase, ‘bull—- earnings.’ ″
The 2003 Berkshire shareholder meeting was one of the many occasions Munger called out what he saw as shady accounting practices, in this case EBITDA — a measure of corporate profitability short for earnings before interest, taxes, depreciation and amortization.
In short, Munger felt that companies often highlighted convoluted profitability metrics to obscure the fact that they were severely indebted or producing very little cash.
“There are two kinds of businesses: The first earns 12%, and you can take it out at the end of the year. The second earns 12%, but all the excess cash must be reinvested — there’s never any cash,” Munger said at the same meeting. “It reminds me of the guy who looks at all of his equipment and says, ‘There’s all of my profit.’ We hate that kind of business.”
To invest like Munger and Buffett, don’t fall for the flashiest numbers in the firms’ investor presentations. Instead, dig into a company’s fundamentals in their totality. The more a company or an investment advisor tries to win you over with esoteric terms, the more skeptical you should likely be.
As Buffett put it in his 2008 letter to shareholders: “Beware of geeks bearing formulas.”
Munger’s Secret to Happiness
Out of all these witty and helpful quotes, I’ll conclude by zeroing in on what Charlie Munger thought was the single most important factor in achieving personal happiness. He said it a number of different ways:
A happy life is very simple. The first rule of a happy life is low expectations. That’s one you can easily arrange. And if you have unrealistic expectations, you’re going to be miserable all your life. I was good at having low expectations and that helped me. And also, when you [experience] reversals, if you just suck it in and cope, that helps if you don’t just stew yourself into a lot of misery.
Put simply, a stock option is a contract to buy (if it is a call option) or to sell (if it is a put option) a given stock at some particular price (“strike price”), by some particular expiration date.
Example: Buying Apple Call Option Instead of the Stock
In a little more detail: if you buy a call option on a stock, that gives you the right to buy that stock at the strike price (“call” the stock away from some current stockholder). For most American stocks the option holder can exercise this right at any time, up till the end of the expiration day. (For so-called European options, you can only exercise the option on the expiration date itself.) Let’s jump into an example. As of late morning 11/27/2023 when I am writing this, the price of Apple stock is $190 per share. Suppose I have a strong conviction that within the next month or so, Apple will go up by 10 dollars (5%) to $200/share.
One thing I can do is plunk down 100 x $190= $19,000 to buy 100 shares of Apple, and wait. If Apple does indeed reach my target price of $200 in some reasonable timeframe, and I sell it there, I will make a profit of 100 shares x $10 / share = $1000 on my initial investment of $19,000. That represents a 5.3% return on my investment.
But suppose because of some unexpected factor (Taiwan invasion?), that the price of Apple plunges by say 30% to $133/share, and remains there for the indefinite future. If I want to get my money out of this affair and move on, I would face a huge loss of 100 shares x (190-133)= $5,700 dollars on my large $19,000 investment.
Instead of buying the stock outright, I could buy a call option. There are a number of specific strategies and choices here, but to keep it simple, I could buy an Apple call option with a strike price of 190 (the current price of Apple) and an expiration date of say December 29, 2023. At the moment, that call option would cost me $3.80 per share, or $380 dollars for a standard options contract that involves 100 shares.
If Apple stock hits my price target of $200 sometime in the next month, I could exercise this option and purchase 100 Apple shares for $19,000 dollars, (100 x $ 190 strike price) and immediately sell them into the market 100 x $200/share = $20,000 dollars. That would give me a net profit of: (profit on stock buy & sell) minus (cost of call option) = 100 x ( ($200 – $190 ) – $3.80 ) = $620. That is a return of 163% on my $380 investment. Woo hoo! (If I did not want to actually exercise the call, I could have sold it back into the options marketplace; the value of the call would have risen by somewhat less than $10 dollars since the time I bought it, so I could take my profit that way, without going through the cycle of actually buying the shares and immediately selling them.)
If Apple stock fails to rise by more than the $3.80 dollars a share that I paid for the call option, I will lose money on this trade. If Apple stays at or below 190, this call option expires valueless, and I will have lost 100% of my option purchase price. (If say two weeks goes by and the share price is hovering just below 190, this call option might still be worth something like $1.90/share, and I might choose to sell it and bail on this trade, to recover half of my $3.80 instead of risking the loss of all of it; there are many, many ways to trade options).
Now, in the event that Apple shares plunge by 30% and stay low indefinitely, I would only lose the $380 that the options cost me, instead of the $5,700 dollars I would lose if I had bought the stock outright.
This example demonstrates some of the benefits of buying stock options: You can make a huge return on your invested/risked capital if your stock price thesis plays out, and you can be shielded from any losses other than the cost of the option. The big weakness of this approach is that your hoped-for stock move must occur within a limited timeframe, before the expiration date, or else you can lose 100% of your investment. Folks who trade options for a living make lots and lots of small trades, knowing that they will lose on a significant percentage of these trades, hoping that their wins will outweigh their losses.
Buying Put Options for Hedging and Speculation
This has been a somewhat long-winded explanation of one way of utilizing options, namely, buying calls. Buying a put option, on the other hand, gives you the right to require that someone will buy a stock from you at the strike price (here, you are “putting” the stock to the person who sold you the option).
Puts are often used as for protective hedging. Suppose I own 100 shares of Apple stock that is currently valued at 190 dollars a share, and I want to protect against the effects of a possible plunging share price. As an example, I might buy a March 15, 2024 put with a strike price of 175, for $2.80. If Apple price falls, I would absorb the first 15 dollars per share of the losses, from 190 to the strike price of 175. However, that put would protect me against any further losses, since no matter how low the share price goes, I could sell my shares at $175. (Again, instead of actually selling my shares, I might sell the puts back into the market, since their value would have increased as Apple share price fell). Buying puts in this manner is like buying insurance on your portfolio: it costs you a little bit per month, but prevents catastrophic losses.
Buying puts can also be used for speculative trading. Suppose I was convinced that Apple stock might fall well below $175 in the next three months. Without owning Apple shares, I might buy that March 2024 175 put for $2.80 per share, or $280 for a 100-share contract. If Apple share price went anywhere below (175 – 2.80 = 172.20), I would make money on this trade. If the price went back down to its recent low of 167, my net profit would be around 100 x (172.2 – 167) = $520. This would be nearly doubling the $280 I put into buying the puts. But again, if Apple price failed to fall as hoped, I might lose all of my $280 option purchase price.
Where to Find Options Prices
There are lots of YouTube tutorials on trading stock options. Here is quick ten-minute intro: Stock Options Explained, by The Plain Bagel. If you want to check out the prices of options, they are shown on websites like Yahoo Finance, Seeking Alpha (need to give email to sign in; you can ignore all the ads to make you purchase premium), and your own broker’s software.
I usually prefer to sell options, rather than buy them, but that is another post for another time. As usual, this discussion does not constitute advice to buy or sell any security.
Austrian economists rightfully have some gripes about mainstream macroeconomics – specifically about aggregation. The conventional wisdom says that a fall in output can be prevented or remedied in the short-run by an expansion of total spending (via increasing the money supply). Total output is stabilized and the crisis is averted. Even if rising spending preceded the output decline, the standard prescription is the same.
The Austrian Business Cycle theory says that, actually, the prior expansion in spending resulted in yet-to-be-realized poor investments due to easy credit. The decline in output is self-inflicted by unsustainable endeavors, and the money supply expansion response prevents the correction. The consequence is more malinvestment. The Austrians say that the focus on gross investment is a misleading aggregation and commits the fallacy of composition that all investment is the same or the same on relevant margins.
Both schools of thought are on firm ground. I don’t see them as conflicting. They both make valid points and are correct about the world. The conventional wisdom is able to paper-over short-run hiccups, and the Austrians recognize that resources are suboptimally allocated. The two sides are talking past each other to some extent.
The market process of seeking profits and satisfying consumer demands is a messy process. Prices and profits (and losses) incentivize firms with information that they use to adjust their behavior. They innovate and reallocate resources from bad projects and toward money-making projects. When firms earn negative profits (a loss) they learn that their understanding of the world was wrong and that they malinvested their scarce resources. Therefore, malinvestment is a standard and *necessary* part of the market process of identifying and serving the changing and unknown demands of individuals. Without malinvestment we lack the necessary information to distinguish success from failure.
Mal-investment is harmful insofar as it represents resources that were invested such that future output did not rise as it could have otherwise. So, while malinvestment is necessary to the market process, a preponderance of it makes us poorer in the future. Luckily, firms have incentives and finite resources such that mal-investment remains somewhat tamed. Indeed, malinvestment is the cost that we bear for innovation and identifying what works.
The issue is that the above discussion is oriented to the long-run. The conventional wisdom is oriented toward resolving the short-run threats. The two meet one another when malinvestment realizations occur in a correlated manner. It’s not that policy causes malinvestment. Rather, depressed interest rates and easy credit prevent firms from identifying which of their projects turned out to be more or less productive. Firms persist in bad investments because they can’t discriminate between the failed and successful projects ex ante.
So, when interest rates suddenly rise, low or negative productivity projects are identified and resources are reallocated. The discovery and reallocation process takes time. And if many projects are found to be failures at once, then the result is a drop in economic activity that is detectable at the aggregate level. The problem is not that malinvestment exists. The problem is that malinvestment was permitted to persist and grow such that the eventual realization of losses is correlated and has macroeconomic effects. We observe spending, output, and employment declines. That’s the ‘business cycle’ part of the Austrian Business Cycle. Interest rates rising helps to identify the bad projects. That’s good. But policy that increases the popularity of bad projects is bad. It makes us poorer in the long-run and more vulnerable to declines in the short-run.
The latest Global Valuation update this week shows that Poland (along with Colombia) has some of the world’s cheapest stocks. Their overall Price to Earnings ratio is 8, compared to 28 for the US:
Does this mean Polish stocks are a good deal, or that investors are rationally discounting them as being risky or slow-growing? After all, they had a low P/E ratio last time I wrote about them too.
Stocks can rise either based on higher investor expectations (higher P/Es) or improved fundamentals (earnings rise, investors see this and bid up the price, but only enough to keep the P/E ratio roughly constant). Over the past year Polish stocks have done the latter; I bought EPOL (the only ETF I know of that focuses Poland) a year ago because its P/E was about 6. Since then its up 70% and the P/E is still… about 6.
Why haven’t investors been excited enough about this earnings growth to bid up the valuation? I think the biggest concern has been political risk, given that the ruling Law and Justice party has been alienating the EU and arguably undermining the rule of law and finding pretexts to arrest businessmen critical of the government.
The recent Polish election promises to change all this. A coalition of ‘centrist’ opposition parties won enough votes to oust the current government, and Washington, the EU, and business seem relieved:
As Europe’s sixth-largest economy, a revitalised pro-EU attitude in Poland would be particularly welcome.
“It will be a positive development for sure because it will unlock the (EU) money that has been withheld and reduce a lot of the tension that has been created with Brussels,” said Daniel Moreno, head of emerging markets debt at investment firm Mirabaud.
Some 110 billion euros ($116 billion) earmarked for Poland from the EU’s long-term budget and the post-pandemic Recovery and Resilience Facility (RRF) remain frozen due to PiS’ record of undercutting liberal democratic rules.
The case for optimism is an influx of EU funds, less risk for business, and an appetite for higher valuations among Western investors who no longer dislike the government.
Being an economist I also have to give you the “other hand”, the case for pessimism: the new government hasn’t actually formed yet, meaning the current one still has the chance for shenanigans; population growth has been strong recently with the influx of Ukrainian refugees, but it is likely to go negative again soon; and EPOL is almost half financial services, which have relatively low P/E even in the US right now.
Nothing is guaranteed but this is my favorite bet right now. I find it amusing that this “risky” emerging market has had a great year while “safe” US Treasury bonds are having a record drawdown (easy to be amused when I don’t own any long bonds and they have done surprisingly little damage in terms of blowing up financial institutions so far). I emphasize the investing angle here but hopefully this signals a bright future for the Polish people.
Disclaimers: Not investment advice, I’m talking my book (long EPOL), I’ve never been to Polandand I’m judging their politics based on Western media reports
What is the VIX and why should you care? The CBOE Volatility Index (VIX) is a measure of the expected near-term price swings in the S&P 500 stock index (SPX). The VIX value is derived from the prices that market participants are willing to pay for options that expire roughly 30 days in the future. Typically, movements upward in VIX correspond to movements downward in broad market averages, since price volatility is usually associated with some “problem” cropping up. During market turbulence, the VIX can shoot up very high, very fast, with a percentage of change far higher than for stock prices.
The VIX is know as the “fear gauge,” since it provides a standardized measure of market volatility expectations. It is thus a number that conveys significant information about the attitudes of market participants. Also, it provides opportunities for investors to make (or lose) a lot of money quickly. You cannot invest directly in the VIX (it is just a calculated number), but you can buy/sell VIX futures and options on those futures. Also, there are convenient funds that buy (e.g., VXX) or short (e.g., SVIX) the VIX futures. Because the VIX makes much bigger percentage moves than stock themselves, you can make a killing with a modest investment, providing you get the timing right.
For instance, over the past twelve months, the SPY S&P 500 fund has gone up by about 18%, so $10,000 would have gone to $11,800. That’s pretty nice. But in that same period, SVIX went up by 143%, which would take $10,000 to $24,300 (see below). (Nerdy notes: (a) SVIX shorts the VIX, so it generally goes up when VIX goes down, i.e., when stocks go up. (b) There is another factor with SVIX called the monthly roll, when tends to make it rise something like 2-4% a month on average. This monthly roll factor is layered on top of the rise and fall in SVIX value based on VIX level. So even if VIX is flat, SVIX may go up something like 30% in a year. )
SVIX and SPY share prices for the past year. Source: Seeking Alpha
Of course, the price swings on SVIX cut both ways. It is down hugely from its highs a month ago, as VIX has increased from roughly 14 to 20. You can go even more crazy by purchasing/shorting VIX-related funds like UVXY that are leveraged at more than 1.0X.
Even you were even more clever, you could have made even more, much more, by working VIX options. Also, if you just want to hedge your stock portfolio against sudden drops, it is often more economical to do that by buying (call) options on the VIX, than by buying (put) options on the stocks (e.g., SPX, SPY) themselves.
During long periods of market stability, the VIX tends to slowly drift downward, to an asymptote somewhere in the 12-13 range. For example, in the five-year plot below, VIX spend much of 2019 around 13, then shot up over 80 within a month when the scope of the COVID pandemic became apparent. It then drifted downwards (with many spikes along the way, especially during the big bear market of 2022), getting down to around 14 for much of June-September of this year.
VIX Level for past five years. Source: Seeking Alpha.
It is notable for VIX to be this low, considering a number of serious current market concerns (the relatively high valuation of the stock market, stubborn inflation, hawkish fed, gridlock in Washington, etc.). And now with serious conflict in the Middle East resulting from the massive attacks on Israeli civilians, the VIX has so far only risen to 20.
A number of market commentators have noted the seemingly anomalously low level of the VIX, and have proffered various explanations. They observe that macroeconomic outlook continues to look probably OK. They also point to some fundamental changes in the stock market operations. One factor is the rise of zero-day options, very short-term stock options that expire within one day. More of the speculative action has gone to those options, with proportionately less in the month-out options that drive the VIX.
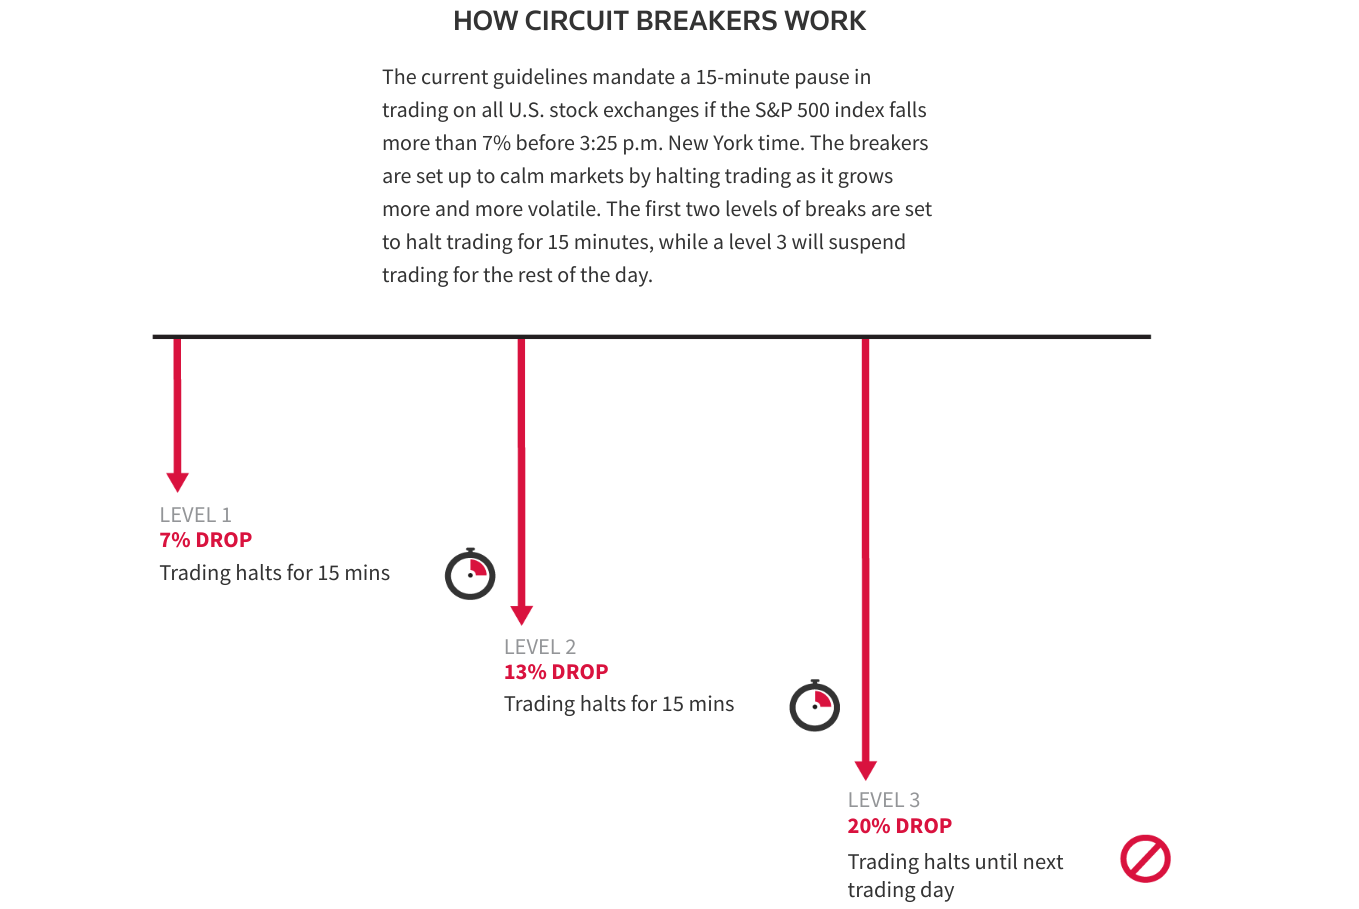
Also, the stock exchanges have implemented various “circuit-breakers,” which halt trading for specified time periods, if swings in stock prices get out of hand. This gives participants a chance to cool off and recalibrate, and not have to make frantic, quick (possibly losing) trades in order to protect themselves. Here is a diagram illustrating these circuit breakers, which are triggered by big moves in the broad S&P 500 stock average:
Source: Seeking Alpha, article by Christopher Robb
There are also Limit Up/Limit Down (LULD) rules in place that temporarily halt trading in an individual stock if its price swings exceed some designated band. is designed to stop excess volatility in a single stock. With these protective circuit-breakers in place, market participants seem less worried about huge price swings coming at them, and hence may feel less of a need to “buy insurance” by purchasing options. This suppression of stock option prices in turn leads to a lower calculated VIX.
As usual, this blog post is not meant to be advice to buy or sell any security. (And seriously, the “never bet more than you can afford to lose” rule applies doubly with the high-volatility products discussed here).
Bill Gross grew PIMCO into a trillion dollar company by trading bonds, earning the epithet “Bond King“. But in an interview with Odd Lots this week, he disclaims both bonds and his title. He wasn’t the king:
My reputation as a bond king was first of all made by Fortune. They printed a four page article with me standing on my head doing yoga, and I was supposedly the bond king, and that was good because it sold tickets. But I never really believed it. The minute you start believing it, you’re cooked.
Who is the real bond king? The Fed:
The bond kings and queens now are are at the Fed. They rule, they determine for the most part which way interest rates are going.
Who still isn’t the bond king? Any other trader, especially Jeff Gundlach:
To be a bond king or a queen, you need a kingdom, you need a kingdom. Okay, Pimco had two trillion dollars. Okay, DoubleLine’s got like fifty five billion. Come on, come on, that’s no kingdom. That’s like Latvia or Estonia whatever. Okay, and then then look at his record for the last five, six, seven years. How does sixtieth percentile smack of a bond king? It doesn’t.
Why he doesn’t believe in long-term bonds right now:
We have a deficit of close to two trillion. The outstanding treasury market is about 33 trillion… about thirty percent of the existing outstanding treasuries, so ten trillion have to be rolled over in the next twelve months, including the two trillion that’s new. So that’s that’s twelve trillion dollars. Where the treasuries that have to be financed over the next twelve months, and who’s going to buy them at these levels? Well, some people are buying them, but it just seems to be a lot of money. And when you when you add on to that, Powell is doing quantitative tightening, as you know, and that theoretically is a trillion dollars worth of added supply, I guess. And so it just seems like a very dangerous time based on supply, even if inflation does comedown.
By revealed preference I agree with Gross, in that I don’t own any long-term bonds. Their yields are way up from 2 years ago, making them somewhat tempting, but I can get higher yields on short-term bonds, some savings accounts, and some stocks. So I see no reason to go long term, especially given the factors Gross highlights. If he’s right, better long-term yields will be here in a year or two. If he turns out to be wrong, I think it would be because of a severe recession here or in another major economy, but I don’t expect that. So what is Gross buying instead of bonds? He likes the idea of real estate:
All all my buddies at the country club are in real estate, and they’ve never paid a tax in their life…. I’ve paid a lot of taxes.
He landed on Master Limited Partnerships, common in the energy sector, as an easier way to avoid taxes, and has 40% of his wealth there. Those are yielding more like 9% and have the tax benefits, though they are risker than treasury bonds. The rest of his portfolio he implies is in stocks, describing some merger arbitrage opportunities. I am a bit tempted by bonds because they’ve done so badly recently (and so have gotten much cheaper), but like Gross I think we’re still not to the bottom.
I like a good lump sum tax. People *must* pay the tax without exception and the advantage over current progressive marginal income taxes is that the marginal wage received doesn’t fall with greater earnings. Employment rises and output rises. To the extent that college students fail to understand their student loans, the indebted graduates essentially pay a lump sum tax each period.
Of course, the exception is income based repayment (IBR) – especially with forgiveness after X years. IBR adjusts the incentives substantially. Under the standard system, your wages are garnished if you fail to make loan payments. Under IBR, lower earnings trigger lower monthly payments. Clearly, in contrast to the standard method, IBR incentivizes more leisure, less income, more black market activity, and higher loan balances. Indeed, all the more so if there is a forgiveness horizon. Someone just has to have low enough income for say 15 years, and their past debt is forgiven (with caveats & conditions).
My principal objection to IBR policy is the resulting malinvestment in human capital. Defaulting on loans is a sign that some investment was inadequately productive to repay the resources consumed by its endeavor. We call that a loss. Real resources of time, attention, and goods and services were consumed in order to produce capital that failed to serve others more than the opportunity cost of those resources.


